Debug With Chrome™ DevTools(使用 Chrome™ DevTools 进行调试)
In this guide, you will learn how to use development tools (DevTools) within the Chrome™ browser to help identify unexpected behavior or gather necessary browser logs to provide to Palantir Support.
One of the most important tools in debugging ambiguous errors is Chrome™ DevTools ↗. This provides a wealth of information for debugging the problem and allows you to look at some internals around what is going on behind the scenes of the webpage you are viewing. Think of it as popping the hood on a car - you get to look inside and see what is really going on.
Use Chrome™ DevTools
You can access the console log with the following steps:
- Right-click on an element on the webpage that you have open.
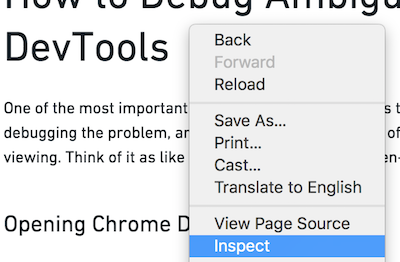
- Select Inspect. This will open a screen on the side of the webpage.
- At the top, navigate to the Console tab, which is where most errors will appear.
- Failed requests will have a red color. Find the red requests that seem relevant to what is failing on the page, or the specific requests that the support team has instructed you to provide. You may need to have the network window open as you perform the relevant action in order for the error messages to appear.
- Select the chevron on the left to expand the request. Often this will contain additional useful information, like an error message and an errorInstanceID.
The important bit for now is the toolbar at the top. For most troubleshooting, the Console and Network tabs will contain relevant error messaging and will be the most helpful for support teams. However, the Elements tab can also be useful in identifying issues, so we will cover that as well.
Console tab
The Chrome™ Console, as pictured below and accessible via the Console tab in the toolbar, has two primary purposes. The first is for use by the web application itself. The web application is allowed to print anything it wants in the console - debugging information, error logs, information messages, and so on.
The second purpose is for the user to run snippets of code and examine the results. However, this useage is beyond the scope of this guide.
When you encounter an error, it is often useful to open the console and scroll up through the history, particularly looking for errors (usually highlighted in red). These errors will be useful to report and often contain further information about what went wrong.
For example, when we load the debugging using DevTools page, we should find the following snippet in the console logs:
You may see a lot of informational lines, which are the simple white lines above, as well as errors shown in red. The error of note shows a GET request for a URL followed by the number 404, the HTTP Error Code signifying "File not found". If we were looking at the console to get more information on an error, this error would be very useful to include along with the file name. In this example, there is a reference to a you-found-me.png where the file could not be found.
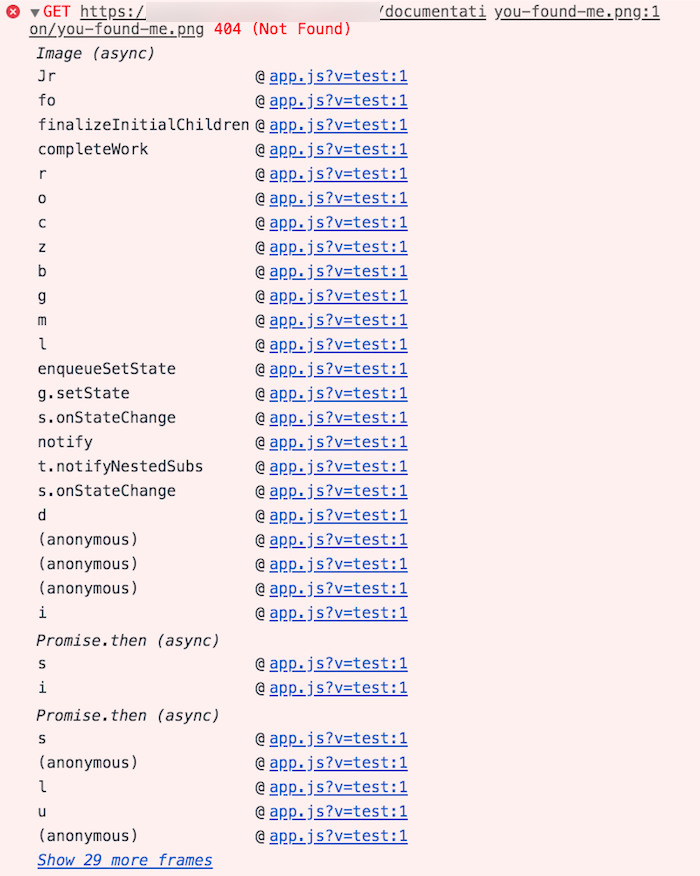
In a lot of cases, it is also useful to expand the error to obtain additional information. You do this by selecting the small triangle at the start of the error:
To access the console log on a specific page:
- Right-select an element on the page you have open and select Inspect. This will open a screen on the side of the webpage.
- Navigate to the Console tab near the top of the page.
- Failed requests will have a red color. Find the red requests that appear relevant to what is failing on the page.
- Select the chevron on the left to expand the request. Often this will contain more information such as an error message and an errorInstanceID.
- If you are not seeing any relevant errors, try re-triggering the behavior that caused the failure with the console log open.
This action can provide your support team with more information to troubleshoot. You can grab these logs by right-selecting on the error information and selecting Save as. You may need to rename your saved file from a .log file to a TXT file to upload it to the platform.
For more information, see Chrome™ DevTools Console overview documentation ↗.
Network tab
When you select a button in a Palantir application, your browser sends a request to a server which the server processes before sending a response. A single webpage may make many requests which do not cause the page to reload but may, for example, update the data you are seeing or send new data to the server. The Network tab lets you examine all the requests your browser is making, as well as check the responses received.
To access the network log on a specific page:
- Right-select an element on the page you have open and select Inspect. This will open a screen on the side of the webpage.
- Navigate to the Network tab near the top of the page.
- Failed requests will have a red color. Find the red requests that seem relevant to what is failing on the page.
- Select the chevron on the left to expand the request. Often this will contain more information such as an error message and an errorInstanceID.
- If you are not seeing any relevant errors, try re-triggering the behavior that caused the failure with the console log open.
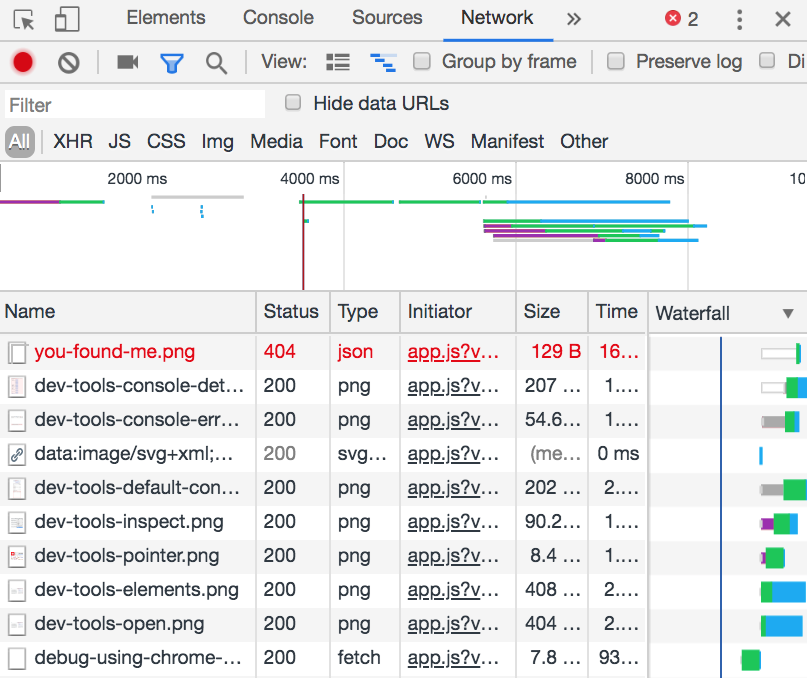
Note the Status column. This contains the HTTP Status Code of the request received in the response as discussed earlier in this document. Note there is a 404 error, and many requests which begin with 2, which means the request succeeded.
Here are some best practices for using this view to get more information about the error. First, look at the two buttons in the top-left corner of the sidebar:
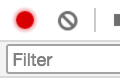
The first icon in red indicates the Network tab is currently recording. This means that when a new request is made, it will be logged in the view underneath. If this is unavailable, you should toggle recording on. Similarly, if you find the requests log are populating faster than you can examine it, you can select it to again turn recording off.
The second symbol (the circle with a line through) lets you clear the log. This is useful to do right before you enact the minimum steps to reproduce. This action clears the log of all currently recorded requests so that you can see just those new requests that come in.
The best way to use this log is to:
- Perform the minimum steps to reproduce the error, but right up until just before the error.
- Clear the log.
- Perform the final step that causes the error.
- Examine new requests, particularly looking for any HTTP error codes. You may wish to attach a screenshot of the requests to your report.
If you find a particular request to be interesting, perhaps because it has a relevant HTTP Error Code, the following information would be useful to include in an error report. Here is an example of a request with an error generated when navigating to the front page:

Note that it is in red, denoting an error, and that the error code is 500, which means Internal Server Error. Already, this is useful information to report; we can include a screenshot of the error and say that it is hitting "500 - Internal Server".
The first thing to note is the URL that the request is made to. In this case, the redirect?code=... is the URL we are contacting. This is useful for identifying the service causing the error. For example, if the URL contains foundry-metadata, then the foundry-metadata service is causing the problem - this would certainly be useful to include in an error report.
The cURL equivalent to the request is also useful to report. You can copy it to include in your report by right-selecting the request itself and selecting Copy > Copy as cURL from the menu.
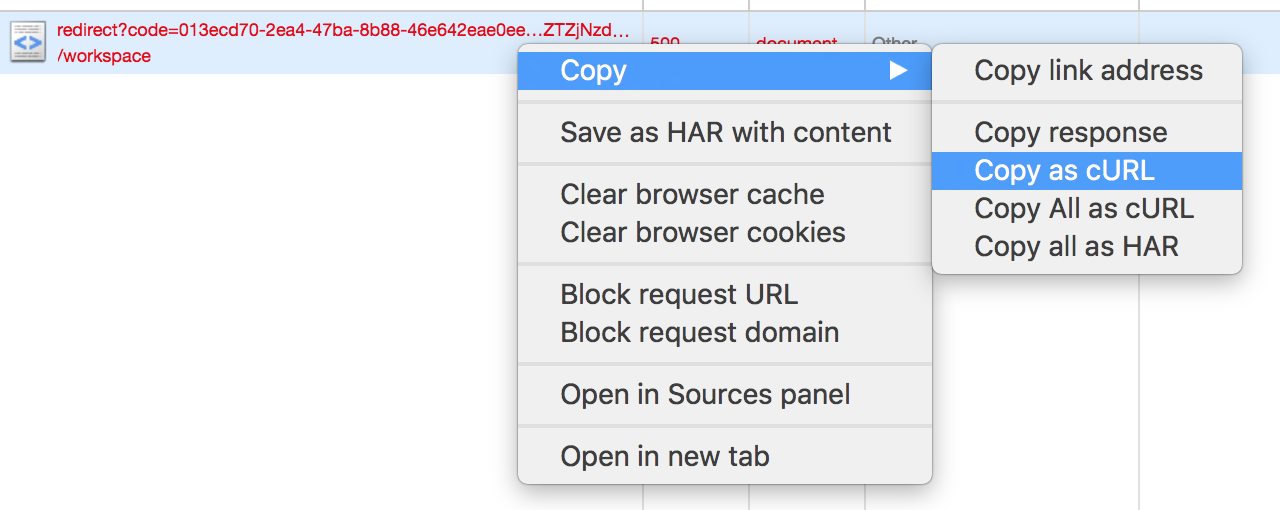
cURL is a command line tool that lets you do exactly what the request does from the command line. This button copies the exact request that was made to the clipboard and will let the debugger run the cURL request wherever and however they want, enabling examination of the request to identify what could be wrong. This is particularly useful with 4xx errors. If there are any error IDs, take note of them as well. You may want to save this copy as a TEXT file to send to Palantir Support, but take care:
- To remove any existing tokens from the log for security reasons or they will be revoked by your Palantir team. You can check whether your file contains tokens by searching for "token" and "bearer" and deleting the string of letters that follows.
- To redact sensitive information before sharing.
The last element that will be useful to include in a report is the response itself, which you can access with Copy response from the same copy menu.
To access the Network tab on a specific page:
- Right-select an element on the page you have open and choose Inspect. This will open a screen on the side of the web page.
- Navigate to the Network tab near the top of the page.
- Sometimes the Network tab is not populated when you open it. Populate the tab by refreshing the page or re-triggering the behavior that failed.
- The second column in the network tab is "Status". Select Status until they are sorted descending. This will bring failed requests to the top as they will have a higher status code. Failed requests will also be colored red.
- Find the request that could be relevant to what is failing on the page for you. Select the request to bring up more information, such as an error message or an errorInstanceID.
Find trace IDs in the Network tab
TraceIDs are unique identifiers of requests that enable the matching of processes happening in the browser to the records stored in logs.
To find traceIDs, open the Network Tab as described in the previous section. Different requests may be worth investigating depending on the situation; in general, red-colored (indicating failure) requests are often useful when an error is displayed in the browser.
Choose a request to see its details.
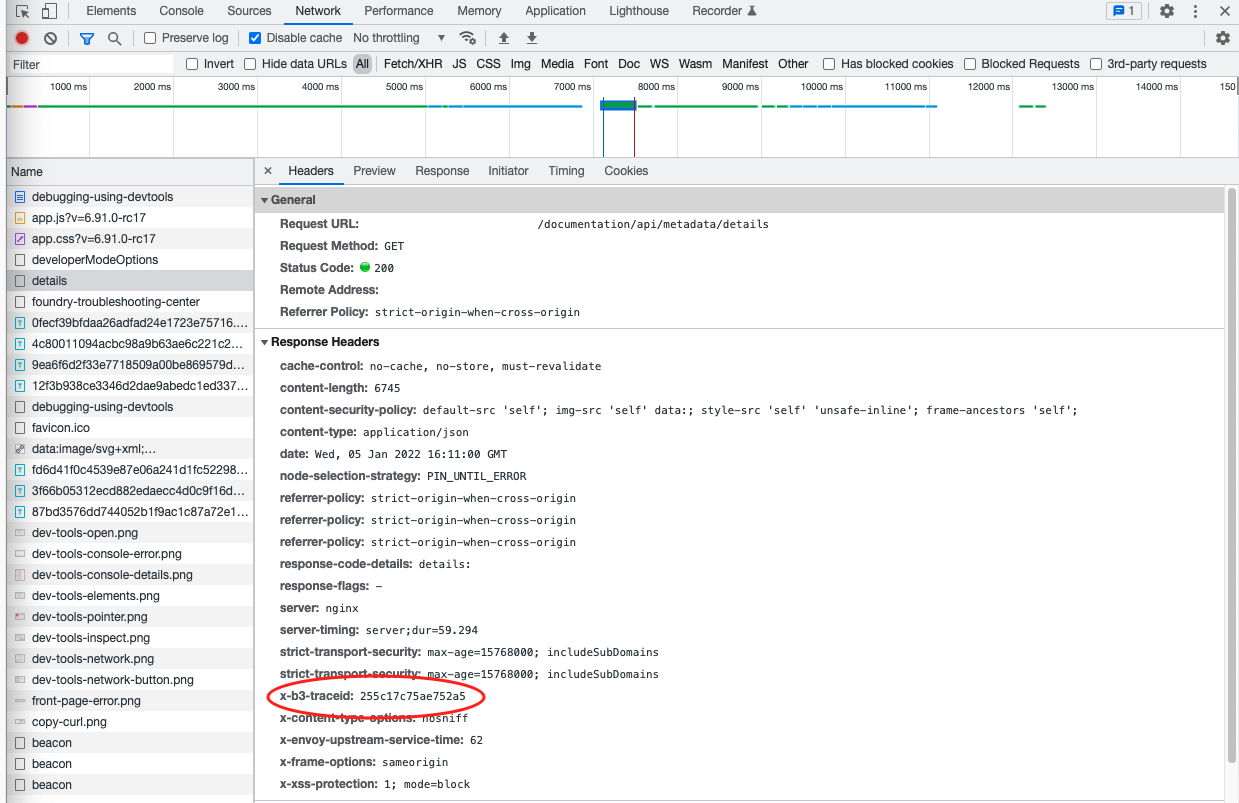
Find x-b3-traceid within Response Headers, highlighted in red in the image above.
Copy the value, in this case 255c17c75ae752a5, and share it as text with Palantir support.
For more information, review the Chrome™ DevTools inspect network activity documentation ↗.
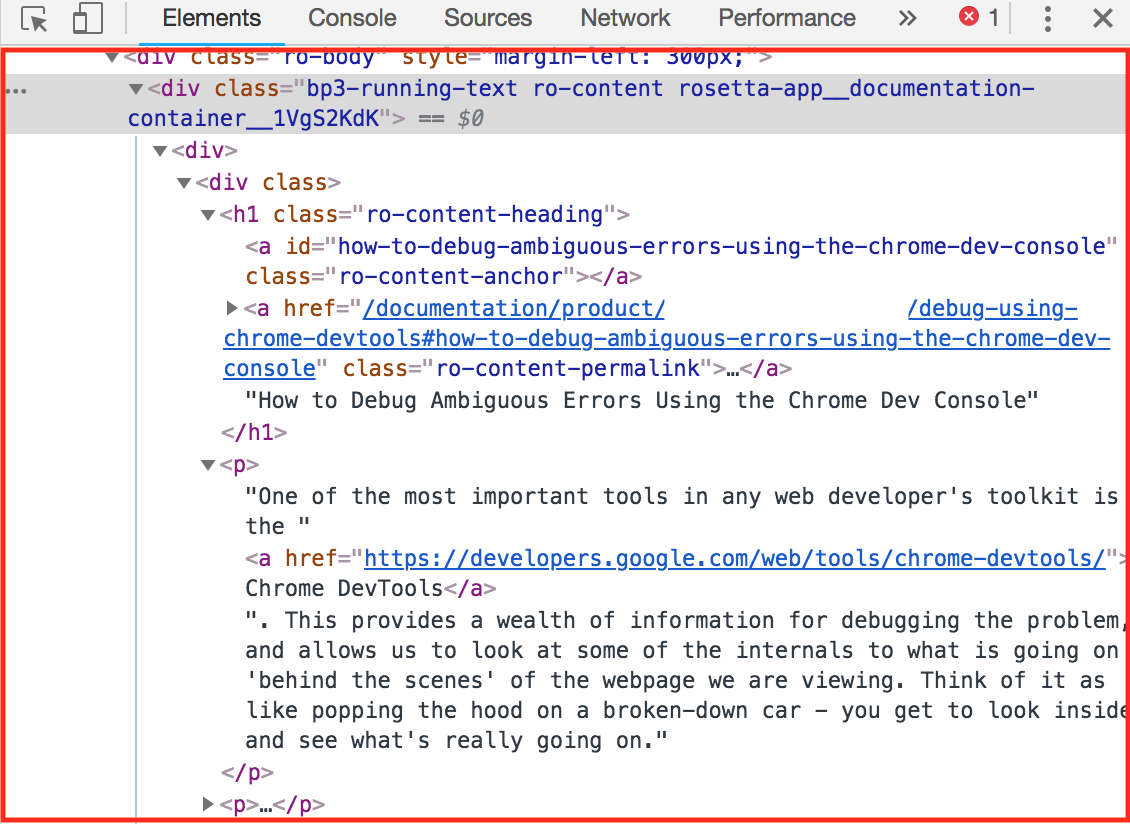
Elements tab
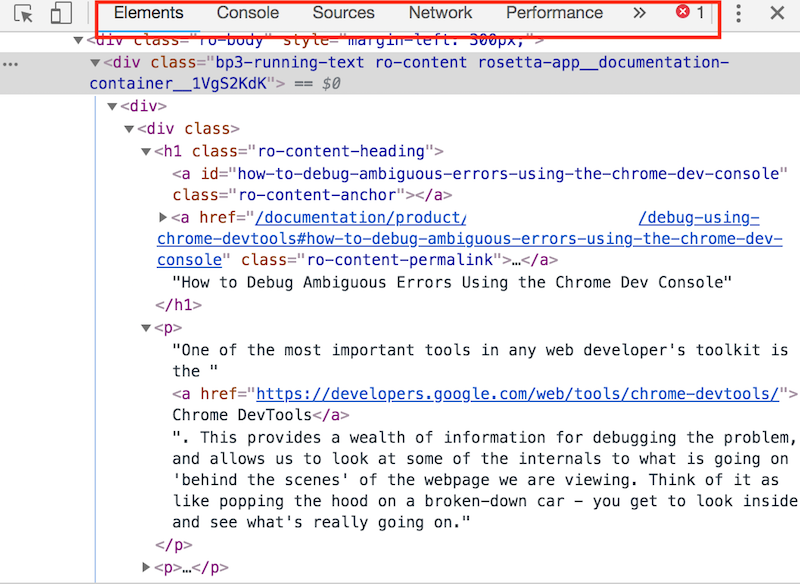
The elements tab shows you the "DOM" (Document Object Model) of the page you are viewing. This constitutes all the visual content you are seeing on the page represented in its underlying HTML form:
This tree of HTML data can be explored by using the Inspect Element tool. There are two ways to use this. First, we can use the pointer version, accessible by this button in the DevTools toolbar:
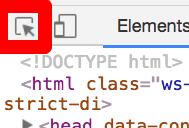
After we select this button, the pointer becomes "active" and lets us choose Elements on the webpage and view them in the DOM.
The second way to use this is to right-select on something in the page and choose Inspect from the dropdown. This has the same effect as using the pointer version.
If necessary, this can provide your support team with additional information to aid in troubleshooting.
For more information, review the Chrome™ DevTools elements documentation ↗.
Chrome™ is a trademark of Google Inc.
中文翻译
使用 Chrome™ DevTools 进行调试
在本指南中,您将学习如何使用 Chrome™ 浏览器中的开发工具(DevTools)来识别意外行为,或收集必要的浏览器日志以提供给 Palantir 支持团队。
调试模糊错误时最重要的工具之一是 Chrome™ DevTools ↗。它提供了丰富的信息来帮助调试问题,并允许您查看正在浏览的网页背后的一些内部运作机制。可以将其想象为打开发动机盖——您可以查看内部,了解真正发生了什么。
使用 Chrome™ DevTools
您可以通过以下步骤访问控制台日志:
- 在打开的网页上右键点击某个元素。
- 选择 检查(Inspect)。这将在网页侧面打开一个面板。
- 在顶部导航到 控制台(Console) 选项卡,大多数错误会显示在此处。
- 失败的请求会显示为红色。找到与页面上失败内容相关的红色请求,或支持团队要求您提供的特定请求。您可能需要在执行相关操作时保持网络窗口打开,以便错误消息出现。
- 点击左侧的展开箭头以展开请求。这通常包含额外的有用信息,例如错误消息和 errorInstanceID。
目前重要的是顶部的工具栏。对于大多数故障排除,控制台(Console) 和 网络(Network) 选项卡将包含相关的错误消息,并且对支持团队最有帮助。然而,元素(Elements) 选项卡在识别问题时也很有用,因此我们也会介绍它。
控制台选项卡
如下图所示,Chrome™ 控制台可通过工具栏中的 控制台(Console) 选项卡访问,它有两个主要用途。第一个是供 Web 应用程序本身使用。Web 应用程序可以在控制台中打印任何内容——调试信息、错误日志、信息消息等。
第二个用途是供用户运行代码片段并检查结果。然而,这种用法超出了本指南的范围。
当您遇到错误时,打开控制台并向上滚动浏览历史记录通常很有用,特别是查找错误(通常以红色高亮显示)。这些错误在报告时很有用,并且通常包含有关出错原因的更多信息。
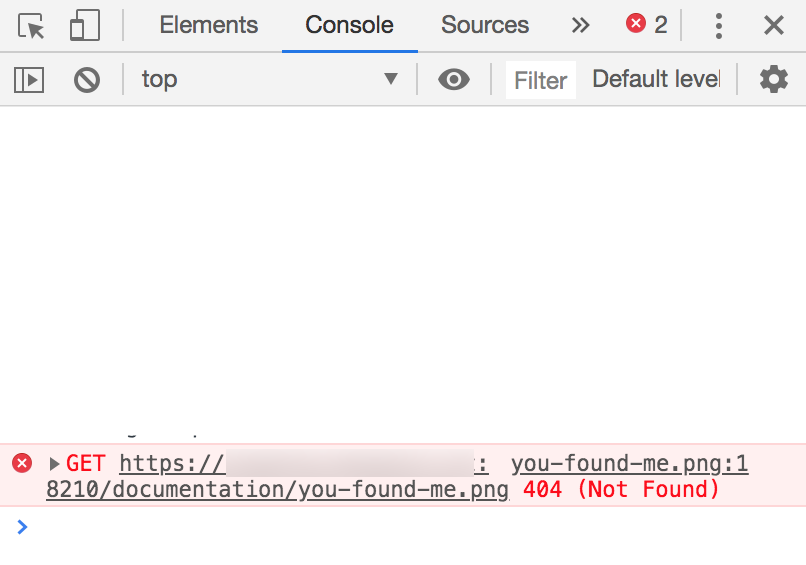
例如,当我们加载使用 DevTools 调试页面时,我们应该在控制台日志中找到以下片段:
您可能会看到许多信息行(上面简单的白色行)以及以红色显示的错误。值得注意的错误显示了对某个 URL 的 GET 请求,后跟数字 404,即表示"文件未找到"的 HTTP 错误代码。如果我们在查看控制台以获取有关错误的更多信息,那么将此错误连同文件名一起包含将非常有用。在此示例中,有一个对 you-found-me.png 的引用,但该文件无法找到。
在许多情况下,展开错误以获取更多信息也很有用。您可以通过点击错误开头的三角形来实现:
要在特定页面上访问控制台日志:
- 在打开的页面上右键点击某个元素,然后选择 检查(Inspect)。这将在网页侧面打开一个面板。
- 导航到页面顶部附近的 控制台(Console) 选项卡。
- 失败的请求会显示为红色。找到与页面上失败内容相关的红色请求。
- 点击左侧的展开箭头以展开请求。这通常包含更多信息,例如错误消息和 errorInstanceID。
- 如果您没有看到任何相关错误,请尝试在控制台日志打开的情况下重新触发导致失败的行为。
此操作可以为您的支持团队提供更多信息以进行故障排除。您可以通过右键点击错误信息并选择 另存为(Save as) 来获取这些日志。您可能需要将保存的文件从 .log 重命名为 TXT 文件,以便上传到平台。
有关更多信息,请参阅 Chrome™ DevTools 控制台概述文档 ↗。
网络选项卡
当您在 Palantir 应用程序中点击按钮时,您的浏览器会向服务器发送请求,服务器处理该请求后再发送响应。单个网页可能会发出许多不会导致页面重新加载的请求,但可能会更新您正在查看的数据或向服务器发送新数据。网络(Network) 选项卡允许您检查浏览器发出的所有请求,以及检查收到的响应。
要在特定页面上访问网络日志:
- 在打开的页面上右键点击某个元素,然后选择 检查(Inspect)。这将在网页侧面打开一个面板。
- 导航到页面顶部附近的 网络(Network) 选项卡。
- 失败的请求会显示为红色。找到与页面上失败内容相关的红色请求。
- 点击左侧的展开箭头以展开请求。这通常包含更多信息,例如错误消息和 errorInstanceID。
- 如果您没有看到任何相关错误,请尝试在控制台日志打开的情况下重新触发导致失败的行为。
请注意 状态(Status) 列。其中包含响应中收到的请求的 HTTP 状态代码,如本文档前面所述。注意有一个 404 错误,以及许多以 2 开头的请求,这意味着请求成功。
以下是一些使用此视图获取更多错误信息的最佳实践。首先,查看侧边栏左上角的两个按钮:
第一个红色图标表示网络选项卡当前正在记录。这意味着当发出新请求时,它将被记录在下面的视图中。如果此功能不可用,您应切换 记录(recording) 为开启。同样,如果您发现请求日志填充速度过快而无法检查,您可以再次点击它以关闭记录。
第二个符号(带斜线的圆圈)允许您清除日志。这在您即将执行重现错误的最小步骤之前执行非常有用。此操作会清除当前记录的所有请求日志,以便您只看到新传入的请求。
使用此日志的最佳方法是:
- 执行重现错误的最小步骤,但直到错误发生前一步。
- 清除日志。
- 执行导致错误的最后一步。
- 检查新请求,特别关注任何 HTTP 错误代码。您可能希望将请求的截图附加到报告中。
如果您发现某个特定请求很有趣,可能是因为它具有相关的 HTTP 错误代码,以下信息将有助于包含在错误报告中。以下是一个导航到首页时生成错误的请求示例:
注意它以红色显示,表示错误,并且错误代码为 500,表示内部服务器错误。这已经是报告中有用的信息;我们可以包含错误的截图,并说明它遇到了"500 - 内部服务器错误"。
首先要注意的是请求所指向的 URL。在本例中,redirect?code=... 是我们正在联系的 URL。这对于识别导致错误的服务很有用。例如,如果 URL 包含 foundry-metadata,那么 foundry-metadata 服务导致了问题——这肯定有助于包含在错误报告中。
请求的 cURL 等效命令也值得报告。您可以通过右键点击请求本身,然后从菜单中选择 复制(Copy) > 复制为 cURL(Copy as cURL) 来复制它并包含在报告中。
cURL 是一个命令行工具,允许您从命令行执行与请求完全相同的操作。此按钮将发出的确切请求复制到剪贴板,并允许调试器在任何地方以任何方式运行 cURL 请求,从而能够检查请求以识别可能存在的问题。这对于 4xx 错误特别有用。如果有任何错误 ID,也请记录下来。您可能希望将此副本保存为 TEXT 文件发送给 Palantir 支持团队,但请注意:
- 出于安全原因,从日志中移除任何现有令牌,否则它们将被您的 Palantir 团队撤销。您可以通过搜索"token"和"bearer"并删除后面的字符串来检查文件是否包含令牌。
- 在共享之前对敏感信息进行脱敏处理。
报告中最后一个有用的元素是响应本身,您可以通过同一复制菜单中的 复制响应(Copy response) 来访问它。
要在特定页面上访问 网络(Network) 选项卡:
- 在打开的页面上右键点击某个元素,然后选择 检查(Inspect)。这将在网页侧面打开一个面板。
- 导航到页面顶部附近的 网络(Network) 选项卡。
- 有时打开网络选项卡时它没有内容。通过刷新页面或重新触发失败的行为来填充选项卡。
- 网络选项卡中的第二列是"状态(Status)"。点击 状态(Status) 直到它们按降序排列。这会将失败的请求移到顶部,因为它们具有更高的状态代码。失败的请求也会显示为红色。
- 找到可能与页面上失败内容相关的请求。点击该请求以获取更多信息,例如错误消息或 errorInstanceID。
在网络选项卡中查找 Trace ID
TraceID 是请求的唯一标识符,能够将浏览器中发生的过程与日志中存储的记录进行匹配。
要查找 traceID,请按照上一节所述打开网络选项卡。根据情况,不同的请求可能值得调查;通常,当浏览器中显示错误时,红色(表示失败)的请求通常很有用。
选择一个请求以查看其详细信息。
在 响应标头(Response Headers) 中找到 x-b3-traceid,如上图中红色高亮所示。
复制该值,在本例中为 255c17c75ae752a5,并以文本形式与 Palantir 支持团队共享。
有关更多信息,请查阅 Chrome™ DevTools 检查网络活动文档 ↗。
元素选项卡
元素选项卡显示您正在查看的页面的"DOM"(文档对象模型)。这构成了您在页面上看到的所有视觉内容,以其底层 HTML 形式呈现:
这个 HTML 数据树可以通过使用检查元素工具来探索。有两种使用方法。首先,我们可以使用指针版本,通过 DevTools 工具栏中的此按钮访问:
选择此按钮后,指针变为"活动"状态,允许我们选择网页上的 元素(Elements) 并在 DOM 中查看它们。
第二种使用方法是右键点击页面上的某个内容,然后从下拉菜单中选择 检查(Inspect)。这与使用指针版本的效果相同。
如有必要,这可以为您的支持团队提供额外的信息以帮助故障排除。
有关更多信息,请查阅 Chrome™ DevTools 元素文档 ↗。
Chrome™ 是 Google Inc. 的商标。