Announcements(公告)
Map Layer Editor | Source GeoJSON from dataset
The Map Layer Editor allows users to create, edit, and preview map layers, which can be used in the Map application.
With this update, when creating a vector layer in the Map Layer Editor, you can now select GeoJSON files stored in datasets as a source of data. GeoJSON is one of the most common formats for geospatial data, so it's common to end up with GeoJSON files in datasets as a result of data connections or pipeline transforms. Use the Map Layer Editor to quickly create layers from your GeoJSON files and visualize your geospatial data!

External Transforms: Connect with code
Date published: 2023-02-23
Interface directly with external APIs using Python
Palantir Foundry now natively supports external transforms via Python code to facilitate API communication with third party providers. Instead of constructing a call with the Data Connection REST adapter to get data, you can interface directly with external APIs and make use of built-in SDKs where available. With the external systems setting enabled in Code Repository, you can:
- Bring external data into Foundry as regular datasets and benefit from the native Code Repository features.
- Use arbitrary libraries and SDKs encapsulating additional logic to facilitate complex queries to endpoints.
- Store, define, and apply the credential used for each API call directly from your repository.
Leverage SDKs to integrate data
External transforms enables you to leverage a third-party provider’s SDK directly for connecting to and interacting with external systems. This capability makes an API call from a Code Repository as seamless as if it were from your local development environment, saving you both time and effort. For instance, you can now forego writing logic to determine which records to connect to, how to get data from a particular format, or determine the frequency of ingests depending on the API. You can also use arbitrary libraries encapsulating additional logic — imported from the Libraries tab in Code Repositories — in your Python environment.

Set and forget connections and credentials
With external transforms, you can keep relevant information required for your external connection on hand and within the context of the code you author. Take advantage of existing connections — first configured in Control Panel — and store API access credentials directly from the External systems tab within Code Repository.
Author external transforms logic in Code Editor
The set-up is simple. Just import the required libraries for writing transforms and external systems. The example shown here demonstrates an API call using External Transforms. The API response from this call is written to a Foundry dataset created in the specified location and ready for transformations in Code Repository or as part of your workflow in Foundry.

When should I use External Transforms?
External transforms allow you to make full use of developer tooling in Code Repositories, including branches, checks and CI, debugging, and release management as you would for regular data transformations in Foundry.
Use external transforms to leverage the ability to bring external data to Foundry as a regular dataset, use arbitrary libraries and take advantage of native SDKs.
For more information on how external transforms can be enabled and written, review the calls to external systems documentation.
Quiver: Custom visualization with Vega Plots
Date published: 2023-02-14
Create custom data visualizations in Quiver
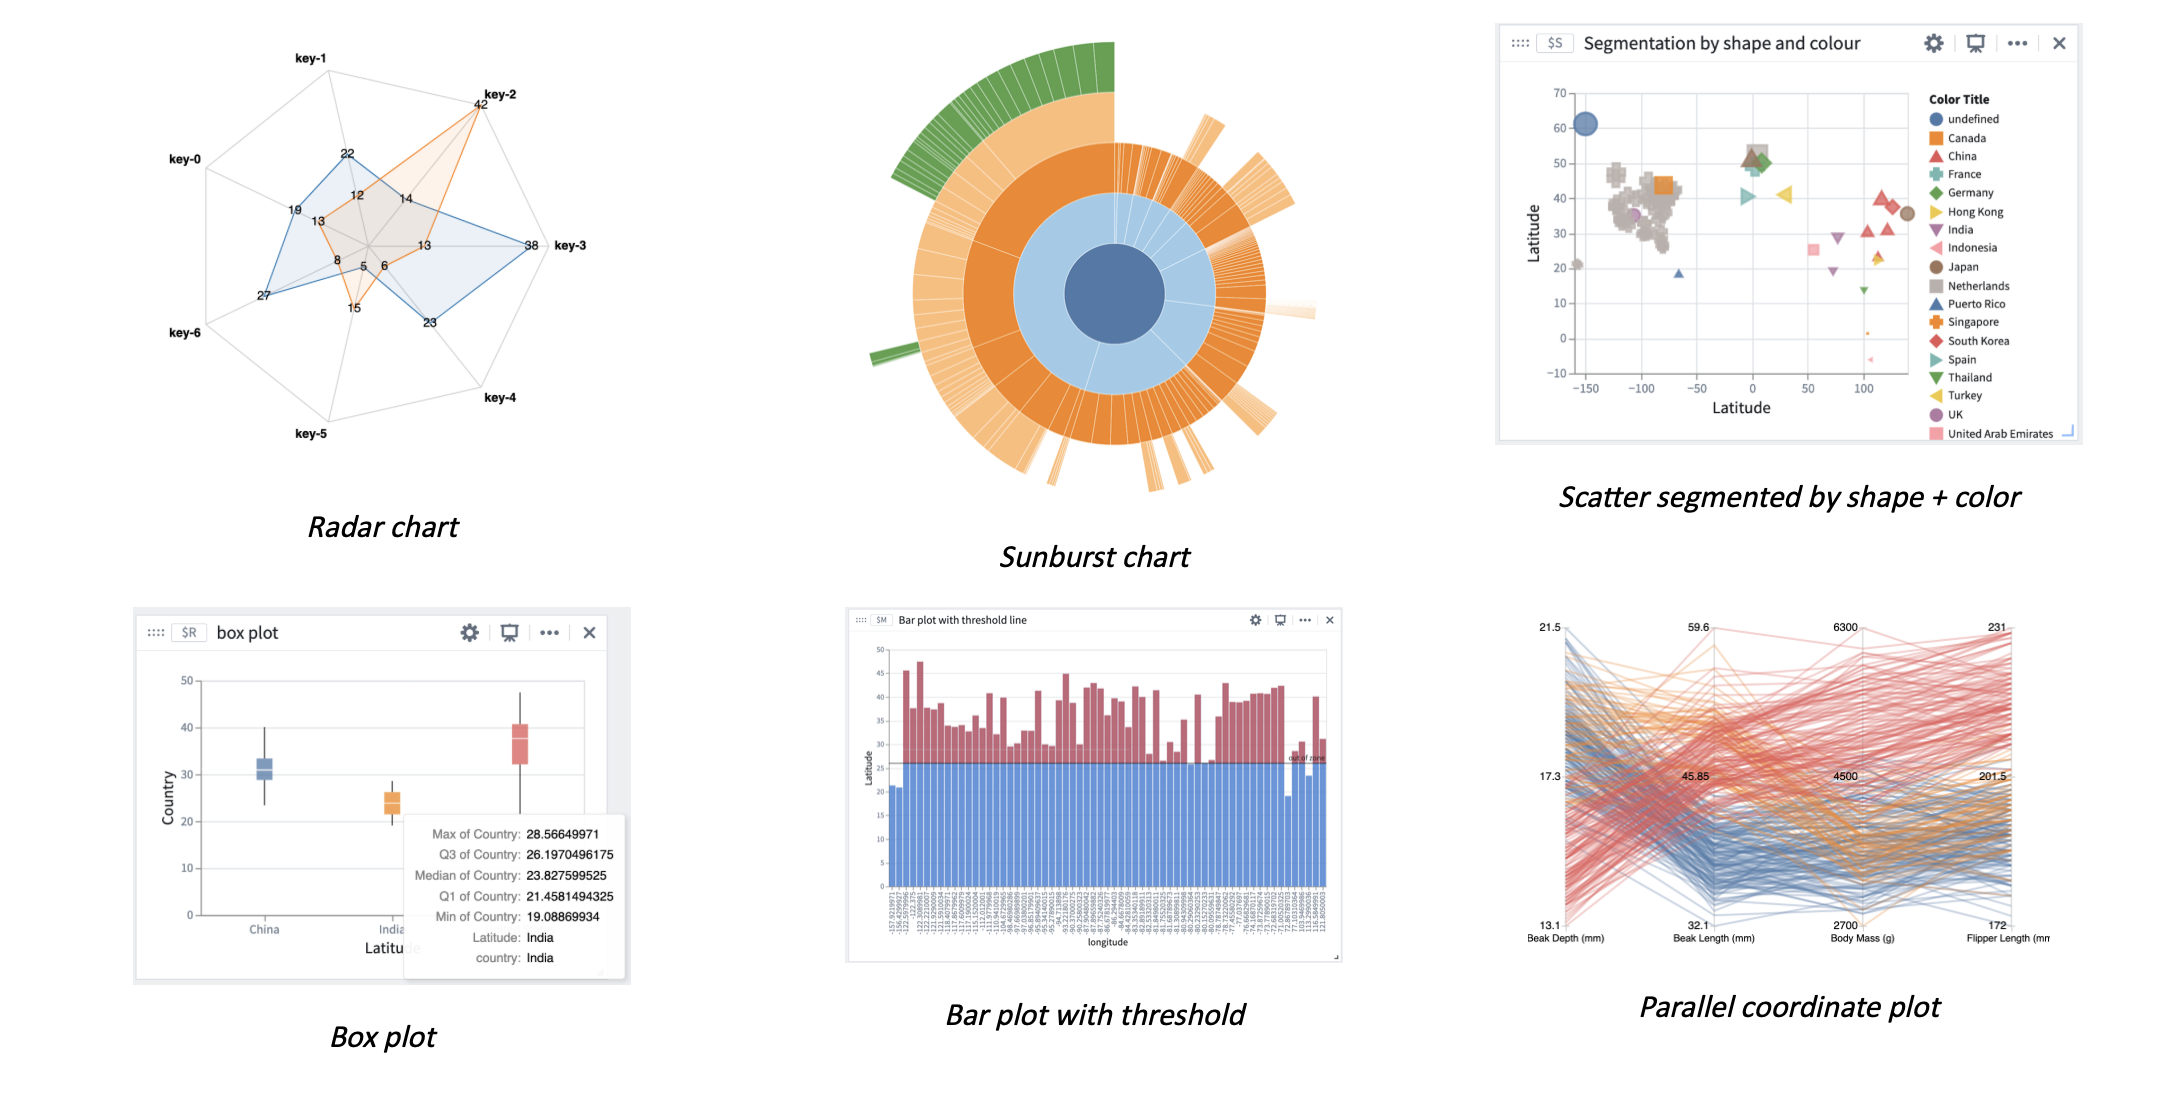
A rich set of visualization options are now available for data presentation in Quiver with Vega or Vega-lite plots. Vega is a visualization grammar that opens up a range of additional options to view your data on top of the Ontology and in other supported Quiver data sources.
In addition to the existing time series charts and objects charts, you can now create custom visualizations such as box plots, sunbursts, radar charts, and more. Vega plots can also be easily embedded in other applications, such as Workshop, where a Quiver dashboard can be added.
Use transform tables to create a Vega or Vega-lite plot
Vega plots can be created in Quiver from the main Chart toolbar or as a consequent action for transform tables. Transform tables are the primary input to Vega plots in Quiver and their use ensures that data can be loaded on the front-end with a consistent and standardized format, regardless of originating data source. Transform tables are also a useful tool for data preprocessing, such as deriving new columns, unioning, joining, or grouping. As a reminder, transform tables can currently be created from object sets, pivot tables, bar plots, and arrays.

Reference transform tables in the Vega plot using their global identifier, for example $A. To reference specific columns in the transform table, reference using $A.column_name notation. Most Vega specifications start out by passing a transform table reference into the values key of the data section. Where applicable, arrays and scalar values can also be passed into the Vega plot using $ notation.
There are a number of preset Vega template specifications available for selection to pre-populate the JSON spec. Simply replace the referenced global identifiers with that of your desired transform table.
When should I use Vega or Vega-lite plots?
Use Vega and Vega-lite plots to visualize data from the Ontology and to present in Palantir Foundry applications wherever Quiver dashboards are supported.
Get started in Quiver with built-in design templates such as bubble, box, waterfall, sunburst and a number of other types of plots, or author your own. For authoring common visualizations in a more concise way, consider using the Vega-Lite library.
Review the Vega plot documentation located within the Quiver collection to learn more. For design inspiration and more advanced usage cases, review Vega ↗ and Vega-lite’s ↗ own documentation for a variety of visualization designs.
Workshop: New Links Widget
Date published: 2023-02-13
The new Workshop Links widget allows builders to display the links of an object set variable in a widget. Users can then drill down through links and linked objects, preview object properies, and open sets of linked objects for further exploration in Object Explorer.
Application builders can choose the input object set and select which links are shown, expanded, and sorted by default.

[Beta] Introducing Use Cases: Organize and build
Date published: 2023-02-06
Note that this is an announcement for a beta capability and therefore this application or feature may not be available on all Foundry enrollments.
Project overflowing with object types and actions types are used in your use case? Can't find input and output datasets when they're spread across projects? Or just looking to clean and organize the resources in your use case? The Use Case app provides a new framework to organize and consolidate the key resources and object types within a project.
The Use Case app solves two critical workflows; it guides new application builders by providing rails around creating workflows on top of the Ontology and it provides visibility and organization as builders prepare their use case for production.

Visibility improves in both directions - the Use Case app gives a top-down view of resources and how they're related in the project, along with helpful rails and best practices for ensuring a use case is production-grade. Use Cases also show up in the Ontology Management App dependency view, making it easy to see all the various projects using any given Object Type.

Dive in by creating a new Use Case or migrating an existing project. You'll find the Use Case app in the Application Portal.
Additional highlights
APIs
Dataset endpoints | APIs for Foundry datasets (including branches, transactions, and files) are now generally available. Previously, these endpoints were in public preview.

Search and aggregate objects | New "search objects" and "aggregate objects" endpoints are now generally available. Previously, these endpoints were in public preview.

Analytics | Contour
Enable contents side panel | Added a new sidebar panel to view the contents of the current analysis. Use this view to filter, organize, reorder, and navigate to paths in an analysis. The sidebar panel enables easy drag and drop reordering of paths within an analysis. For example, you can view the relationship between paths and explore which paths start from the results of other paths in the analysis.

Path descriptions | Paths can now be annotated with custom descriptions to describe their contents or purpose within the context of an analysis. To add a description, select the "Click to add a description" field at the top of a path.

Add saved layers to Contour map board | Added a new layer type for saved layers to the new map board. You can now choose a saved map layer from your files to add to your map board.

Add embedded images to Contour dashboard text cells | Images can now be embedded into text cells of dashboards. To add an image, navigate into a text cell and then select the picture icon in the toolbar that appears.

Analytics | Quiver
Remove creation of object canvas templates | Removed the option to create a new Object Canvas Template, as part of the transition to dashboards. Selecting New canvas now always creates a free form canvas. Existing templates will continue to exist and be editable, and converting a Free form canvas to an Object canvas templates is still possible using Convert to object canvas template, which will first prompt users to consider creating a dashboard instead.

App Building | Slate
Copy widgets from the sidebar | You can now copy widgets into your clipboard directly via the sidebar in a new context menu.

Add document title service for changing Slate tab title | You can now dynamically change the browser tab title by setting the slate.setWindowTitle Action in the Events panel.

App Building | Workshop
Pivot Table: support default sorting by aggregation column | Within the Pivot Table widget, builders can now configure default sorting criteria by either grouping or aggregation column. Multi-column default sorts are also supported.
Chart XY: Support for resizable scatter chart bubbles | Users can now dynamically or statically define the size of scatter chart bubbles within the Chart XY.

Chart XY widget: Support variables in chart annotations | Annotation series can now be both statically defined and variable-backed In the Chart XY widget. For example, a chart could be configured to have a dynamic annotation that represents a variable threshold / limit that changes as different objects are selected.

Data Integration | Pipeline Builder
Adding a new Aggregate multiple columns board | Added a new transform board called Aggregate multiple columns that allows for defining an aggregation expression and applying it on selected columns based on a condition statement.
Ontology | Object Explorer
Improved Object View editor start-up performance | The Object View Editor application has undergone a series of performance improvements, greatly improving the start-up time and reducing the amount of data it loads. Customers with more mature Ontologies should expect to see greater improvements, with load times being reduced from potentially upwards of 10 seconds down to consistent sub-second times.
中文翻译
公告
地图图层编辑器 | 从数据集获取 GeoJSON 源
地图图层编辑器(Map Layer Editor)允许用户创建、编辑和预览地图图层,这些图层可在地图(Map)应用程序中使用。
通过此次更新,在地图图层编辑器中创建矢量图层时,您现在可以选择存储在数据集中的 GeoJSON 文件作为数据源。GeoJSON 是地理空间数据最常用的格式之一,因此通过数据连接或管道转换,数据集中的 GeoJSON 文件很常见。使用地图图层编辑器,您可以快速从 GeoJSON 文件创建图层并可视化地理空间数据!
外部转换:通过代码连接
发布日期:2023-02-23
使用 Python 直接与外部 API 交互
Palantir Foundry 现在原生支持通过 Python 代码进行外部转换(External Transforms),以促进与第三方提供商的 API 通信。您无需使用数据连接 REST 适配器构建调用来获取数据,而是可以直接与外部 API 交互,并在可用时利用内置 SDK。在代码仓库(Code Repository)中启用外部系统设置后,您可以:
- 将外部数据作为常规数据集引入 Foundry,并享受原生代码仓库功能。
- 使用封装了额外逻辑的任意库和 SDK,以促进对端点的复杂查询。
- 直接从您的仓库存储、定义和应用每次 API 调用所使用的凭据。
利用 SDK 集成数据
外部转换使您能够直接利用第三方提供商的 SDK 来连接和与外部系统交互。此功能使代码仓库中的 API 调用如同在本地开发环境中一样无缝,节省您的时间和精力。例如,您现在可以省去编写逻辑来确定要连接哪些记录、如何从特定格式获取数据或根据 API 确定摄取频率的步骤。您还可以在 Python 环境中使用封装了额外逻辑的任意库——从代码仓库的"库"(Libraries)选项卡导入。
设置并遗忘连接和凭据
通过外部转换,您可以将外部连接所需的相关信息保存在手边,并置于您编写的代码上下文中。利用现有连接——首先在控制面板中配置——并直接从代码仓库的"外部系统"(External systems)选项卡存储 API 访问凭据。
在代码编辑器中编写外部转换逻辑
设置很简单。只需导入编写转换和外部系统所需的库。此处显示的示例演示了使用外部转换的 API 调用。此调用的 API 响应将写入在指定位置创建的 Foundry 数据集,并准备好用于代码仓库中的转换或作为 Foundry 工作流的一部分。
![]()
何时应使用外部转换?
外部转换允许您充分利用代码仓库中的开发者工具,包括分支、检查和 CI、调试以及发布管理,就像在 Foundry 中进行常规数据转换一样。
使用外部转换来利用将外部数据作为常规数据集引入 Foundry 的能力,使用任意库并利用原生 SDK。
有关如何启用和编写外部转换的更多信息,请参阅外部系统调用文档。
Quiver:使用 Vega 图表进行自定义可视化
发布日期:2023-02-14
在 Quiver 中创建自定义数据可视化
现在,通过 Vega 或 Vega-lite 图表,Quiver 中提供了丰富的可视化选项用于数据展示。Vega 是一种可视化语法,它在本体(Ontology)和其他支持的 Quiver 数据源之上,开辟了一系列额外的选项来查看数据。
除了现有的时间序列图表和对象图表之外,您现在还可以创建自定义可视化,例如箱线图、旭日图、雷达图等。Vega 图表还可以轻松嵌入到其他应用程序中,例如 Workshop,其中可以添加 Quiver 仪表板。
使用转换表创建 Vega 或 Vega-lite 图表
Vega 图表可以在 Quiver 中从主图表工具栏创建,也可以作为转换表(Transform Tables)的后续操作创建。转换表是 Quiver 中 Vega 图表的主要输入,使用它们可以确保数据在前端以一致且标准化的格式加载,无论原始数据源如何。转换表也是数据预处理的有用工具,例如派生新列、合并、连接或分组。提醒一下,转换表目前可以从对象集、数据透视表、条形图和数组创建。
在 Vega 图表中使用全局标识符(例如 $A)引用转换表。要引用转换表中的特定列,请使用 $A.column_name 表示法。大多数 Vega 规范首先将转换表引用传递给数据部分的 values 键。在适用的情况下,也可以使用 $ 表示法将数组和标量值传递给 Vega 图表。
有许多预设的 Vega 模板规范可供选择,以预填充 JSON 规范。只需将引用的全局标识符替换为您所需转换表的标识符即可。
何时应使用 Vega 或 Vega-lite 图表?
使用 Vega 和 Vega-lite 图表来可视化本体中的数据,并在支持 Quiver 仪表板的 Palantir Foundry 应用程序中展示。
在 Quiver 中开始使用内置设计模板,例如气泡图、箱线图、瀑布图、旭日图以及其他多种类型的图表,或者自行创作。要以更简洁的方式创作常见可视化,请考虑使用 Vega-Lite 库。
请参阅 Quiver 集合中的 Vega 图表文档以了解更多信息。有关设计灵感和更高级的用例,请参阅 Vega ↗ 和 Vega-lite ↗ 自己的文档,以获取各种可视化设计。
Workshop:新的链接小部件
发布日期:2023-02-13
新的 Workshop 链接小部件(Links widget)允许构建者在小部件中显示对象集变量(Object Set Variable)的链接。然后,用户可以深入查看链接和链接对象,预览对象属性,并打开链接对象集以在对象资源管理器(Object Explorer)中进一步探索。
应用程序构建者可以选择输入对象集,并选择默认显示、展开和排序哪些链接。
[Beta] 引入用例:组织和构建
发布日期:2023-02-06
请注意,这是关于一个 beta 功能的公告,因此此应用程序或功能可能并非在所有 Foundry 注册环境中可用。
项目是否因用例中使用的对象类型和操作类型而变得臃肿?当输入和输出数据集分散在不同项目中时,是否难以找到?或者只是想清理和组织用例中的资源?用例(Use Case)应用程序提供了一个新的框架来组织和整合项目中的关键资源和对象类型。
用例应用程序解决了两个关键工作流:它通过提供在 Ontology 之上创建工作流的指导,引导新的应用程序构建者;并在构建者准备将用例投入生产时提供可见性和组织性。
可见性在两个方面得到改善——用例应用程序提供了资源的自上而下视图以及它们在项目中的关联方式,以及确保用例达到生产级质量的实用指导和最佳实践。用例也会显示在 Ontology 管理应用程序的依赖关系视图中,从而可以轻松查看使用任何给定对象类型的所有不同项目。
通过创建新用例或迁移现有项目开始使用。您可以在应用程序门户(Application Portal)中找到用例应用程序。
其他亮点
API
数据集端点 | Foundry 数据集的 API(包括分支、事务和文件)现已正式发布。此前,这些端点处于公开预览阶段。
搜索和聚合对象 | 新的"搜索对象"和"聚合对象"端点现已正式发布。此前,这些端点处于公开预览阶段。
分析 | Contour
启用内容侧面板 | 新增了一个侧面板,用于查看当前分析的内容。使用此视图可以筛选、组织、重新排序和导航到分析中的路径。侧面板支持在分析中轻松拖放重新排序路径。例如,您可以查看路径之间的关系,并探索哪些路径从分析中其他路径的结果开始。
路径描述 | 路径(Paths)现在可以添加自定义描述,以在分析上下文中描述其内容或用途。要添加描述,请选择路径顶部的"点击添加描述"字段。
将已保存图层添加到 Contour 地图板 | 为新的地图板(map board)添加了新的已保存图层类型。您现在可以从文件中选择已保存的地图图层添加到地图板。
将嵌入图像添加到 Contour 仪表板文本单元格 | 现在可以将图像嵌入到仪表板的文本单元格中。要添加图像,请导航到文本单元格,然后选择出现的工具栏中的图片图标。
分析 | Quiver
移除对象画布模板的创建 | 移除了创建新对象画布模板(Object Canvas Template)的选项,作为向仪表板(dashboards)过渡的一部分。选择新建画布现在始终创建一个自由形式画布。现有模板将继续存在并可编辑,并且仍然可以使用转换为对象画布模板将自由形式画布转换为对象画布模板,这将首先提示用户考虑创建仪表板。
应用构建 | Slate
从侧边栏复制小部件 | 您现在可以通过侧边栏中的新上下文菜单直接将小部件复制到剪贴板。
添加文档标题服务以更改 Slate 标签页标题 | 您现在可以通过在事件面板中设置 slate.setWindowTitle 操作来动态更改浏览器标签页标题。
应用构建 | Workshop
数据透视表:支持按聚合列默认排序 | 在数据透视表小部件(Pivot Table widget)中,构建者现在可以按分组列或聚合列配置默认排序条件。还支持多列默认排序。
XY 图表:支持可调整大小的散点图气泡 | 用户现在可以在 XY 图表(Chart XY)中动态或静态定义散点图气泡的大小。
XY 图表小部件:支持图表注释中的变量 | 注释系列现在可以静态定义,也可以由变量支持。在 XY 图表小部件中,例如,可以配置一个图表,使其具有代表变量阈值/限制的动态注释,该阈值/限制会随着选择不同对象而变化。
数据集成 | Pipeline Builder
添加新的聚合多列板 | 新增了一个名为"聚合多列"(Aggregate multiple columns)的转换板,允许定义聚合表达式,并根据条件语句将其应用于选定的列。
本体 | 对象资源管理器
改进对象视图编辑器启动性能 | 对象视图编辑器(Object View Editor)应用程序经历了一系列性能改进,大大缩短了启动时间并减少了加载的数据量。拥有更成熟本体的客户应会看到更显著的改进,加载时间可能从超过 10 秒减少到持续低于 1 秒。