Announcements(公告)
REMINDER: Sign up for the Foundry Newsletter to receive a summary of new products, features, and improvements across the platform directly to your inbox. For more information on how to subscribe, see the Foundry Newsletter and Product Feedback channels announcement.
Share your thoughts about these announcements in our Developer Community Forum ↗.
Direct OpenAI model family available for US georestricted enrollments
Date published: 2025-11-25
In addition to non-georestricted enrollments, US georestricted enrollments can now enable Direct OpenAI as a model family in AIP. This model family is separate from the Microsoft Azure model family, although the model offerings will often look the same. Turning on Direct OpenAI for an enrollment offers the following key benefits:
- Increased capacity: By enabling Direct OpenAI, your enrollments gain access to additional model capacity.
- Faster model access: New OpenAI models will become available in AIP more quickly through Direct OpenAI, minimizing delays for using new models.
How to enable
To enable these models, enrollment administrators must enable Direct OpenAI in Control Panel.
Usage restrictions
OpenAI models provided directly from OpenAI (not via Azure) including GPT-4o. Use of these models must be consistent with the OpenAI Usage Policies ↗ and the OpenAI Sharing & Publication Policy ↗.
Your feedback matters
We want to hear about your experiences using language models in the Palantir platform and welcome your feedback. Share your thoughts with Palantir Support channels or on our Developer Community ↗ using the language-model-service tag ↗.
Work with Snowflake tables directly in Code Workspaces
Date published: 2025-11-20
You can now import Snowflake tables as virtual tables into JupyterLab® code workspaces, enabling you to work with large-scale data stored externally to Foundry without moving it.
What's new
Code Workspaces now supports read and write operations on Snowflake tables, including Iceberg tables cataloged in Polaris. Iceberg tables are open-source table formats that enable reliable, scalable, and efficient management of large datasets, including tables stored externally in Snowflake.

A highlighted code snippet in the Data panel.
Why this matters
This capability allows you to run interactive Python notebooks directly against data cataloged in Snowflake, supporting data science, analytics, and machine learning workflows without requiring data replication into Foundry. By working with data where it lives, you can leverage Snowflake's storage and cataloging while using Foundry's development environment.
Learn more about virtual tables and Code Workspaces.
Jupyter®, JupyterLab®, and the Jupyter® logos are trademarks or registered trademarks of NumFOCUS.
All third-party trademarks including logos and icons referenced remain the property of their respective owners. No affiliation or endorsement is implied.
Advance your Foundry and AIP skills with new training courses on learn.palantir.com
Date published: 2025-11-20
Three new training courses are now available on learn.palantir.com ↗ to help you improve your skills in Foundry and AIP. These courses, focusing on building workflows and scoping use cases in Foundry with our AIP applications and features, are designed to help you feel more familiar with real-world solutions and industry-specific processes.
Foundry & AIP Aware course
The new Foundry & AIP Aware course ↗ ties together various courses on the Learn site to create an immersive and hands-on experience for users interested in the following:
- Building on Foundry & AIP
- Scoping use cases
- Positioning Foundry and AIP within an enterprise IT landscape
Expect to start with theory and the basics, and progress to building functional, real-world solutions by the end of each module. Upon completing this program, all participants will be eligible to sit for the (free) Foundry Aware certification exam ↗. Successfully passing this exam marks an important step before gaining further real-world experience or pursuing an apprenticeship.
This comprehensive course is intended to take approximately eight hours and is accessible to both technical and non-technical users.
Speedrun courses
The following two new speedrun courses are also available:
- Speedrun: Your First Agentic AIP Workflow ↗: Learn how to leverage AIP and the Ontology for an agentic workflow and AIP-human teaming.
- In this course, you will work with clinic trial recruitment data and solve the problem of identifying eligible patients for clinical trials. Your goal is to learn how to leverage Foundry's AI and operational tooling to streamline the trial recruitment process.
- By the end of this course you will have a functional application for operational users that leverages an automated AIP agent performing part of the clinical trial recruitment process, ultimately achieving AI and human teaming on this process.
-
This course is part of the AI Engineer track ↗.
-
Speedrun: Data Science Fundamentals ↗: Learn how to use Foundry and AIP for Data Science.
- In this course, you will delve into analyzing clinical study data to uncover insights into patient demographics and adverse events linked to drug consumption. This project not only involves performing data analysis but also creating a report that your colleagues can use for future data science initiatives.
- This course is part of the Data Scientist track ↗.
Introducing the AI forward deployed engineer
Date published: 2025-11-18
AI FDE - the AI forward deployed engineer - will be available in beta starting the week of November 17 for enrollments with AIP enabled. AI FDE allows you to operate Foundry with natural language, using conversations to unlock the power of the Palantir platform. AI FDE makes platform interactions more intuitive and accessible for all users, regardless of technical expertise, while maintaining complete control and visibility into tool use and data access.
The AI FDE prompt input field, with the option to add ontology resources as context.
Key features
With AI FDE, you can perform data transformations, manage code repositories, build and maintain your ontology, and more. AI FDE can accelerate your efforts with the following features:
- Context management that allows you to control what information the model can access.
- Closed-loop operation that enables complex multi-step workflows through continuous feedback.
- Full respect for existing user permissions, ensuring proper governance and security.
- Transparent tool usage with complete visibility into all actions performed.
- First-class support for Anthropic, OpenAI, Google Gemini, and xAI models with native tool APIs.
Getting started
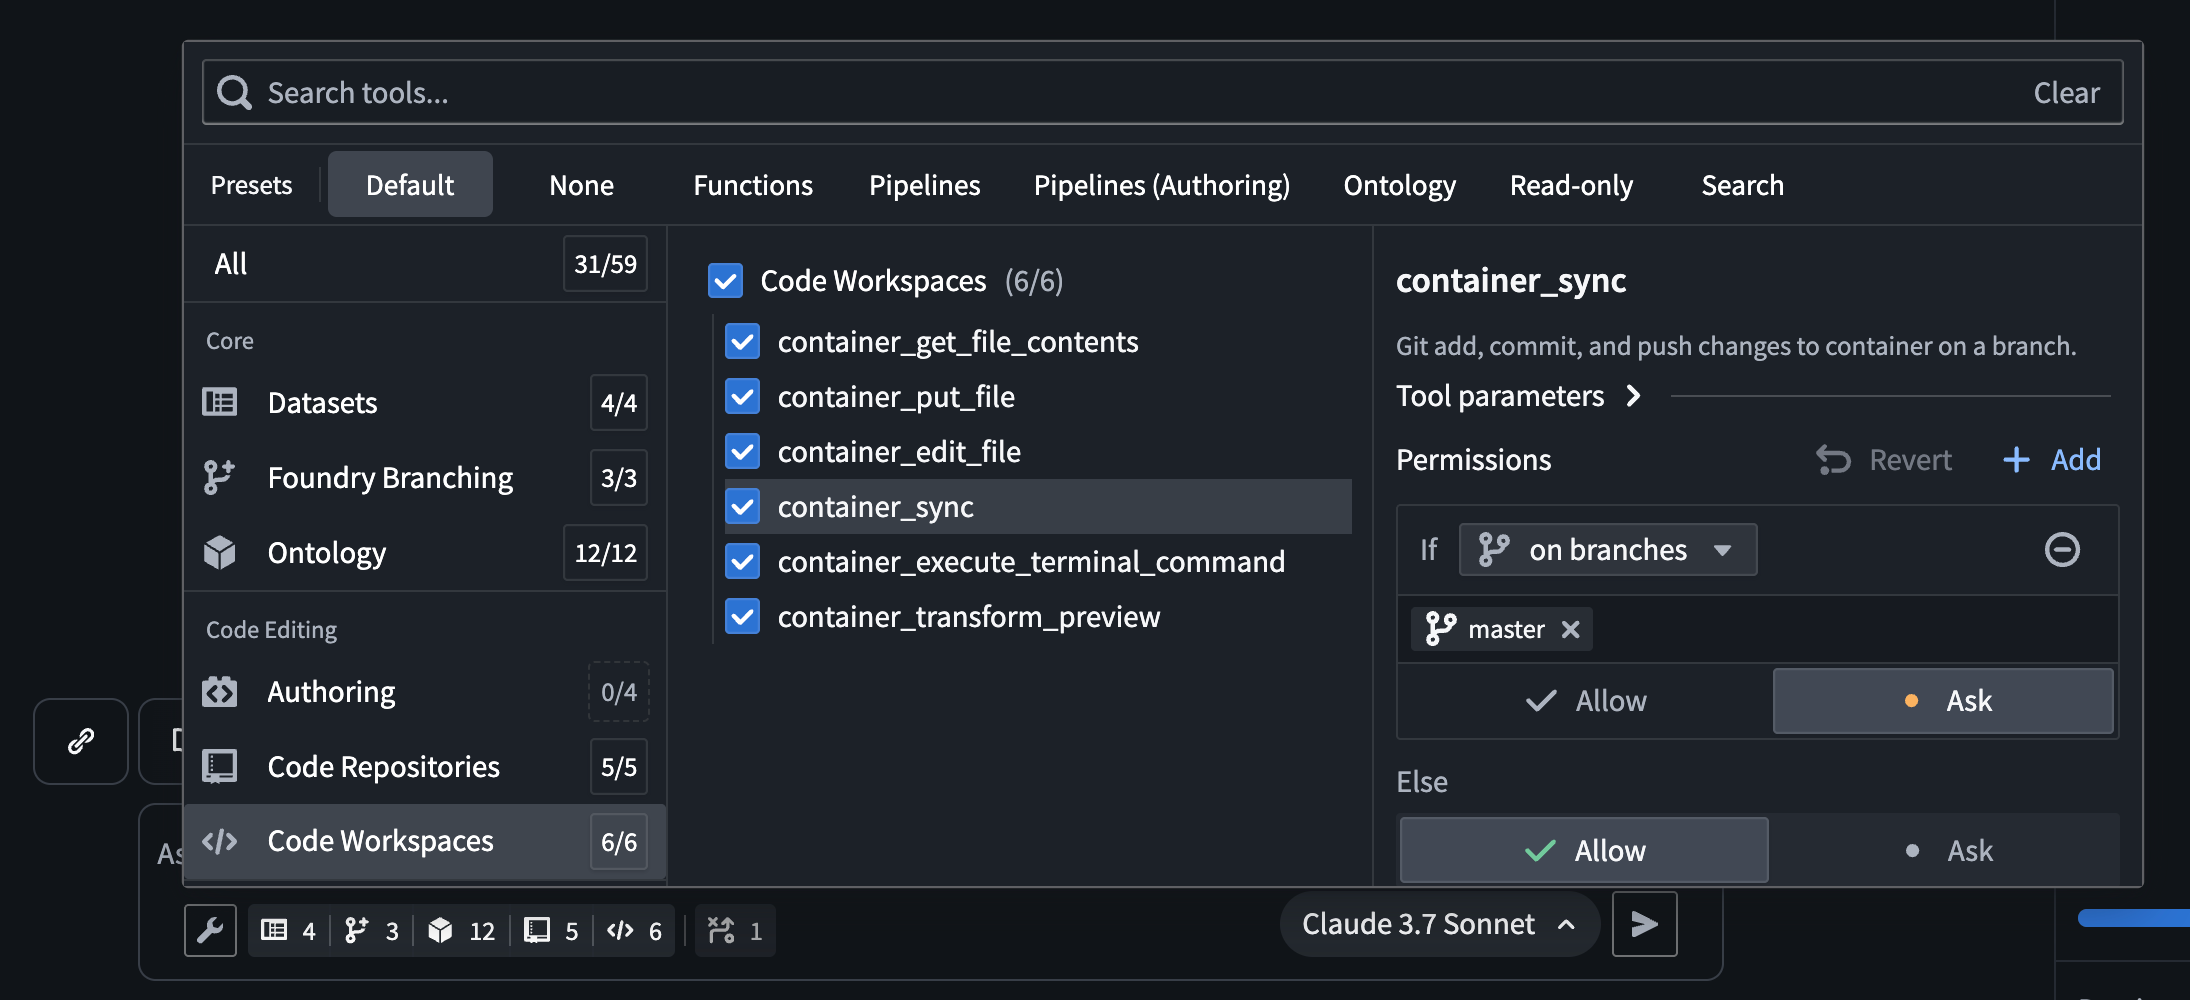
To get started with AI FDE, ensure that AIP is enabled on your enrollment. For the best experience, Foundry Branching should also be enabled to support ontology edits. Once enabled, you can begin interacting with AI FDE by providing natural language requests. You can expand the agent's context by sharing resources or documentation, and enable relevant tools depending on the given task.
The AI FDE tool selection menu, which allows users to select the tools AI FDE has access to.
After configuring context and tools, you can use AI FDE to help you perform the following actions in Foundry:
- Write transforms and build datasets for data integration.
- Create and modify object types, link types, action types, and interfaces for ontology development.
- Write, preview, and publish functions.
- Leverage branching for safe, reviewable changes across all workflows.
By enabling natural language commands for data integration, ontology development, and function creation, AI FDE can transform how you work with Foundry while maintaining security and providing full visibility into every action.
We want to hear from you
As we continue to develop AI FDE, we want to hear about your experiences and welcome your feedback. Share your thoughts with Palantir Support channels or our Developer Community ↗.
Note: AIP feature availability is subject to change and may differ between customers.
AIP Analyst: Intuitive chat-based ontology exploration
Date published: 2025-11-18
AIP Analyst is a new data analysis application launching in beta the week of November 17 for users with AIP enabled. AIP Analyst uses the data in your ontology to answer questions in a chat-based interface, offering an ontology-first experience that enables both technical and non-technical users to traverse and generate insights from their ontology data. With AIP Analyst, you can ask questions, visualize results, and understand every step of your analysis with complete transparency.
AIP Analyst has access to a growing list of tools, including:
- Searching and understanding your ontology.
- Filtering object sets with search-arounds and semantic search.
- Performing aggregations with group-by and metrics.
- Writing SQL queries against object sets or datasets.
- Creating visualizations with Vega charts.
AIP Analyst emphasizes transparency and control; you can review each step of an analysis, validate logic, make manual adjustments when needed, and view the analysis lineage in an interactive graph view.
Intelligent Analysis with full transparency
AIP Analyst shows its work. Every analysis creates an interactive dependency graph showing the flow from question to answer. Users can see exactly how the agent reasoned through their request, inspect intermediate results, and manually adjust steps.

AIP Analyst in the process of answering a question, with the graph tab expanded.
Flexible exploration
With the ability to fork a chat, users can branch explorations from a common starting point. AIP Analyst can either access every object type that the user has access to, or it can be locked down to specific ontologies and object type groups for more targeted exploration.

The AIP Analyst Settings menu, with ontology and object type group options.
High level of user control
Beyond text chat, AIP Analyst supports the following features:
- Manual mode (
Shift+tab) allows the user to guide the agent at every step of the analysis. - Notepad integration allows users to provide commonly used instructions and context as Notepad documents.
- Direct imports from object types, object sets, datasets, functions, and workshop modules for targeted analysis.
Options in the AIP Analyst input field.
AIP Analyst redefines ontology exploration by combining the power of conversational AI with robust user controls and transparent workflows. With its growing suite of tools and commitment to transparency, AIP Analyst is an essential tool for anyone seeking deeper insights from their ontology data.
Your feedback matters
We want to hear about your experience with AIP Analyst and welcome your feedback. Share your thoughts with Palantir Support channels or our Developer Community ↗.
Note: AIP feature availability is subject to change and may differ between customers.
Automatically diagnose failures and improve prompts with the AIP Evals results analyzer
Date published: 2025-11-18
AIP Evals now has a results analyzer that enables you to quickly understand why tests failed and how to fix them. Previously, when iterating on an AI function, moving from failing test cases in the results table to clear, actionable next steps was a lengthy manual process. The results analyzer addresses this by automatically clustering failures into root-cause categories and proposing targeted prompt changes where they help.
What is the analyzer?
The AIP Evals results analyzer is a built‑in AI copilot on the Results view that:
- Analyzes a single run’s failing test cases and produces an aggregate summary in the style of a root cause analysis (RCA).
- Categorizes and groups failures with names, descriptions, representative examples, and the full list of affected test cases.
- Suggests specific prompt edits when changes are likely to improve outcomes.

A view of the results analyzer in the AIP Evals application.
Leverage the results analyzer
The results analyzer has been used to discover significant AI failure modes and optimization opportunities, and can be used with AIP Logic functions. Support for agents published as functions and functions on objects will be included in a future release.
Some example use cases include the following:
- Faster diagnosis: Jump from raw failures to concise, structured root‑cause categories and a top‑line summary.
- Actionable improvements: For each category, get a single, concrete prompt modification and copy changes with one click.
- Context aware: The results analyzer includes your function definition, evaluator setup, and a lightweight debug trace of prompts and responses to ground its reasoning.
- Built for Evals workflows: Select any category’s test case tags to filter the table to exactly the affected cases and go deeper.
Getting started
To start using the AIP Evals results analyzer, refer to the documentation to view prerequisite setup steps. After setup, you can select a single evaluation suite run with failing test cases from either the AIP Logic sidebar or the AIP Evals application, then generate an analysis. From there, you can:
- Review the Overview and per‑category tabs. You can filter the table to find impacted cases.
- Review suggested prompt improvements. Copy changes and update your Logic prompts where appropriate.
- Rerun your evaluation or an Experiment to validate improvements.
Your feedback matters
As we continue to develop new AIP Evals features and improvements, we want to hear about your experiences and welcome your feedback. Share your thoughts with Palantir Support channels or our Developer Community ↗ using the aip-evals tag ↗.
GPT-4.1 now available on Azure OpenAI-enabled IL2, IL4, and IL5 enrollments
Date published: 2025-11-18
GPT-4.1 is now available from Azure OpenAI for IL2, IL4, IL5 enrollments.
Model overview
GPT-4.1 is an improvement over GPT-4o and alternative to Claude 3.7 Sonnet for certain use cases, and shows excellent performance in coding, instruction following, and long context conversations. Comparisons between GPT-4.1 and other models in the OpenAI family can be found in the OpenAI documentation ↗.
- Tool calling
- Structured outputs
- 1M token context window
- Knowledge cutoff of June 2024
Getting started
To use these models:
- Confirm your enrollment administrator has enabled relevant model family or families
- Review token costs and pricing
- See the complete list of all the models available in AIP
Your feedback matters
We want to hear about your experiences using language models in the Palantir platform and welcome your feedback. Share your thoughts with Palantir Support channels or on our Developer Community ↗ using the language-model-service tag ↗.
Network egress logs and metrics now available in Build logs and Control Panel
Date published: 2025-11-18
The Palantir platform now provides networking logs and new metrics to help you debug networking issues that were previously difficult to resolve. This feature is currently available in beta for enrollments running on Rubix, Palantir's Kubernetes-based infrastructure.
What's new in Build logs?
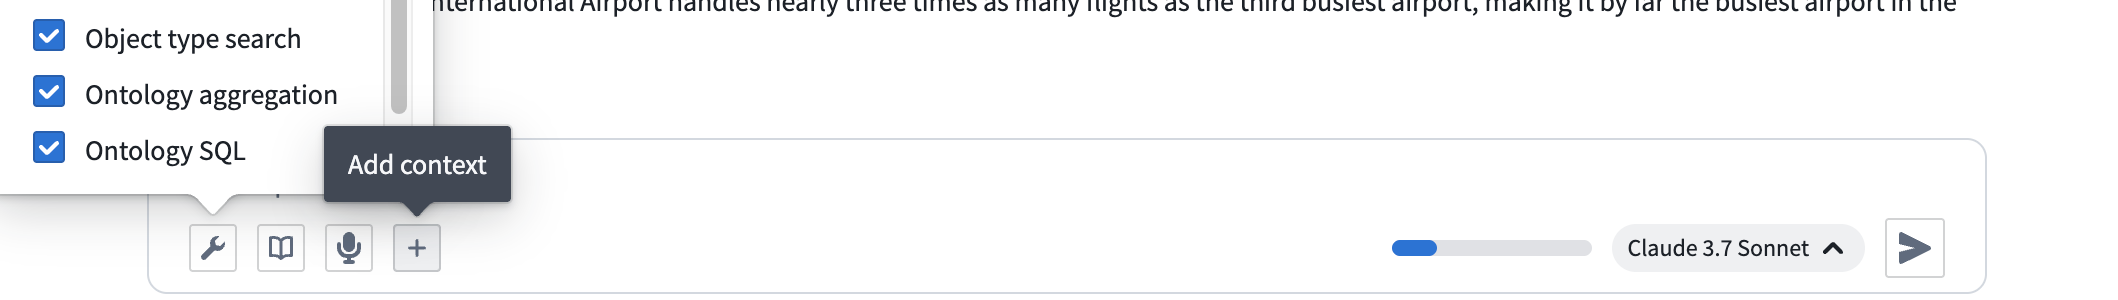
Build logs now encompasses network egress logs. Access network egress logs from a Build page by selecting Logs and then applying the suggested Network egress logs filter. To understand what these logs contain and how to interpret them, you can review the documentation.
Select the Network egress logs filter to review logs.
Network egress policies in Control Panel now aggregate those same logs per source, as well as the metrics of the usage of these policies. Start from Control Panel > Network egress, then select a policy and go to the Observability tab to access.
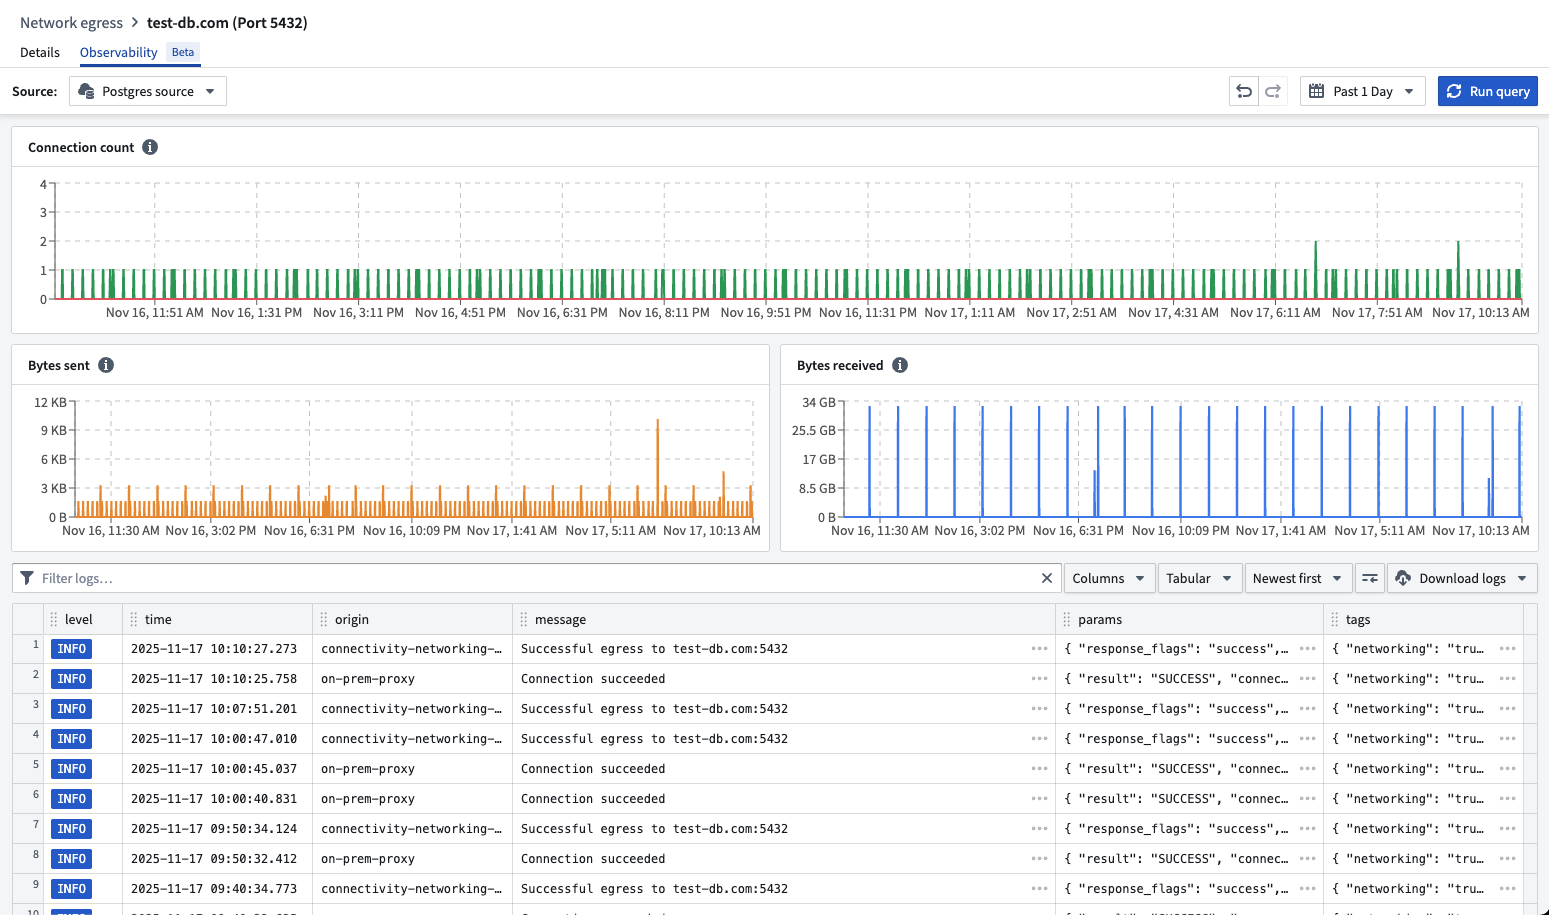
You can review egress logs and metrics for a network policy in Control Panel.
What's coming up next?
- Making DNS lookups discoverable to help identify required egress policies on a source
- Providing end-to-end observability of egress flows by logging all egress results from every intermediary step (Foundry proxies, agent proxies)
- Enabling monitoring to alert you when egress is failing
- Adding metrics like request and response sizes, request durations, and more
Your feedback matters
As we continue to add Data Connection features, we want to hear about your experiences and welcome your feedback. Share your thoughts with Palantir Support channels or our Developer Community ↗ or post using the our data-connection tag ↗.
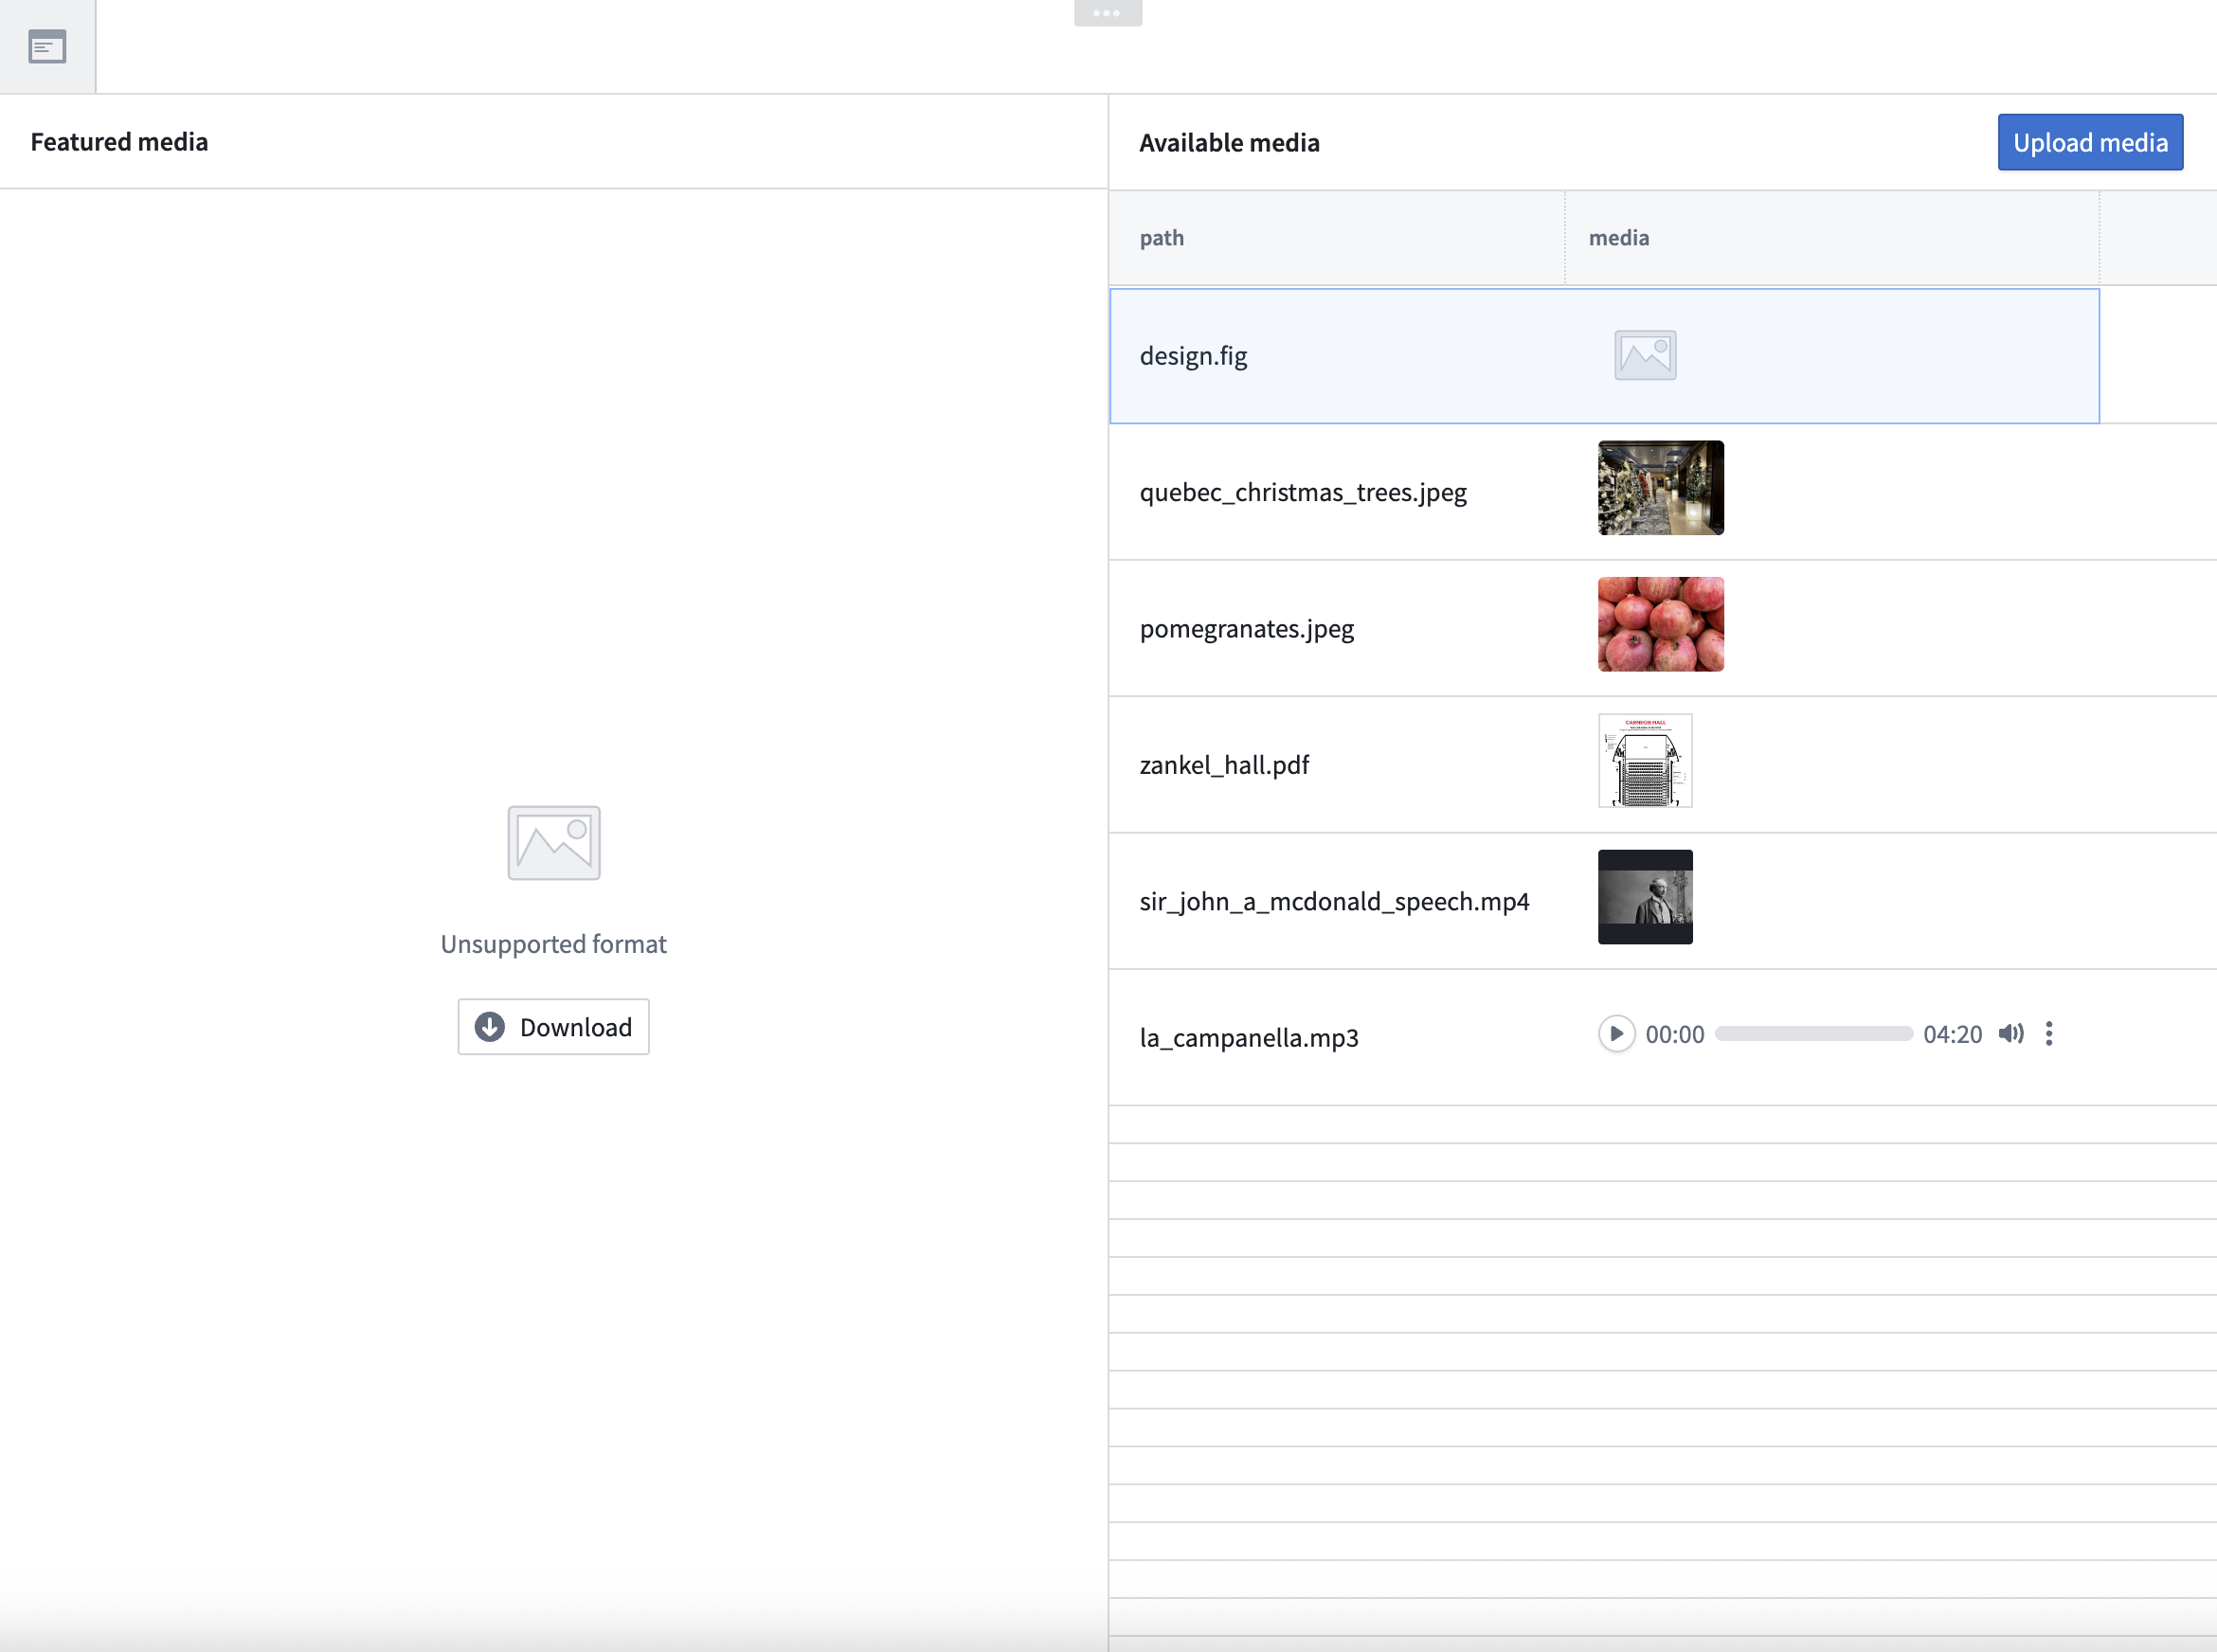
Upload multiple media types using multimodal media sets
Date published: 2025-11-18
Multimodal media sets are now available on all Foundry enrollments, allowing you to upload and store files of any format within a single media set. This capability simplifies workflows that require handling multiple media types together, such as processing mixed document types or combining different file formats in analysis pipelines.
What are multimodal media sets?
Multimodal media sets allow you to work with multiple types of unstructured data in a single media set. They are ideal for working with:
- Sets of files that span across multiple media set schema types
- File formats that are not otherwise supported by existing media set schemas
Key capabilities
- Upload and preview: Upload files to media sets and view interactive previews of media items using supported schema types. Media items that are not supported for preview will render a download option for off-platform previewing.

A preview of a media item not supported for preview.
- Workshop integration: Multimodal media sets are fully integrated with Workshop, allowing you to preview multimodal media directly in your workflow.
A preview of multimodal media in Workshop.
- Python transforms in Code Workspaces: Perform advanced transformations in Code Workspaces using the
transforms-mediapackage.
What's next on the development roadmap?
In upcoming releases, we plan to enhance multimodal media sets with further Pipeline Builder integrations.
Your feedback matters
We want to hear about your experience with multimodal media sets and welcome your feedback. Share your thoughts with Palantir Support channels, or on our Developer Community ↗ using the media-sets tag ↗.
DuckDB Python Bindings for Transforms
Date published: 2025-11-18
Transforms has added Foundry-native Python bindings for DuckDB ↗, a modern, high-performance single-node SQL execution engine.
This integration allows users to write highly performant SQL pipelines within the Python ecosystem, with features such as incremental processing and partitioned outputs. For many use cases, DuckDB can offer significant advantages over other single-node runtimes, including faster execution and improved memory efficiency. DuckDB’s familiar SQL interface makes it an excellent choice for Foundry users with existing SQL experience.
DuckDB is particularly well-suited for medium-to-large scale data processing tasks that require low latency and efficient resource usage. Unlike many other single-node compute engines, DuckDB supports resource configuration to control memory usage and parallelism, which allows fine-grained optimization for different workloads. This is especially important for memory-constrained contexts, where DuckDB can self-limit its memory consumption to avoid out-of-memory errors.
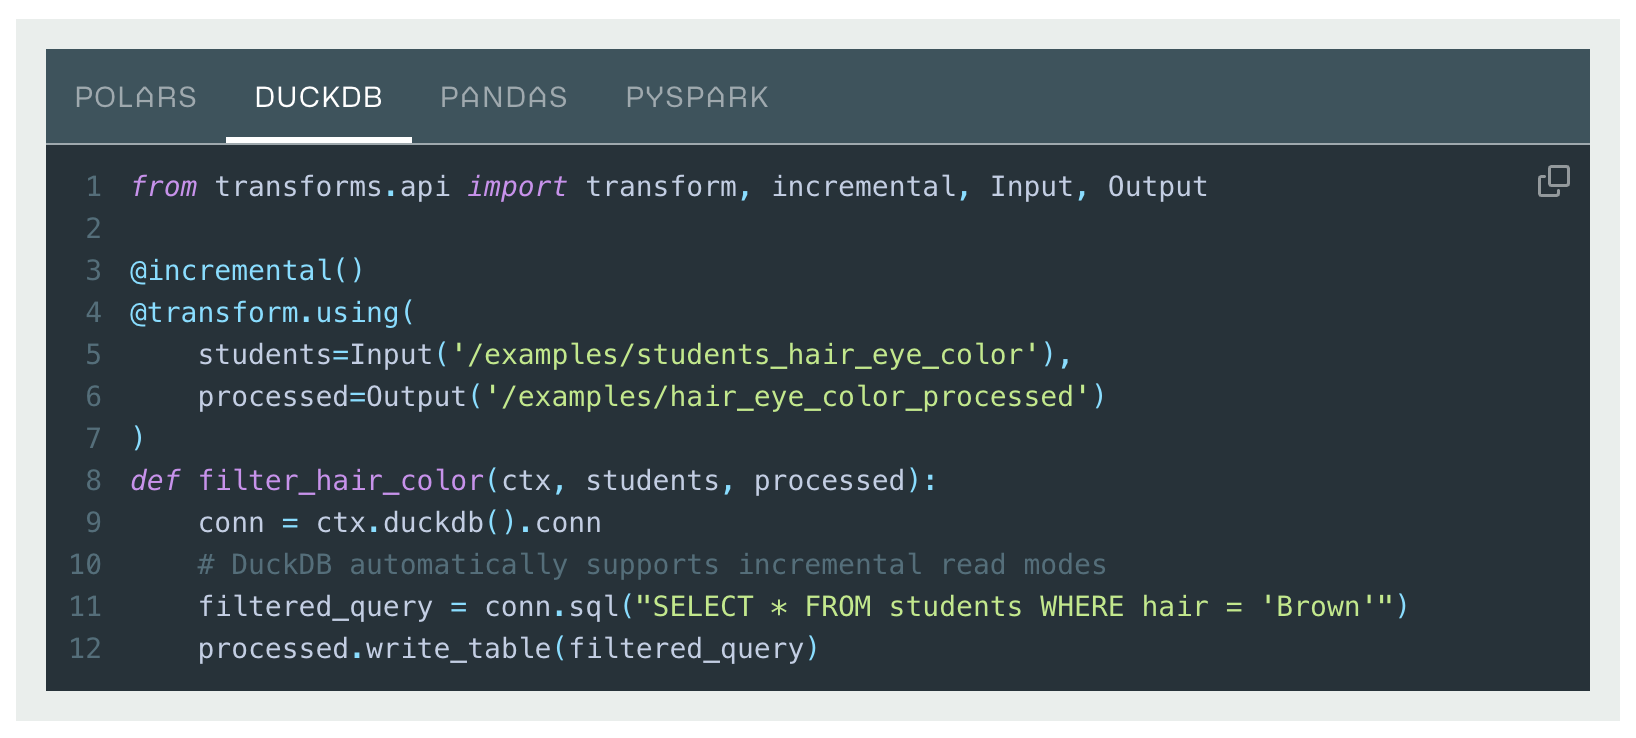
Transforms DuckDB code example.
To learn more, see the DuckDB API documentation and an overview of Foundry’s Python compute engine options.
Track and analyze Foundry logs in real time with streaming datasets
Date published: 2025-11-18
Organization administrators can now export Foundry logs directly into streaming datasets, allowing you to track application logs, function execution logs, and more all in one place as they occur. Once your logs are flowing into a dataset, you can then analyze them using Foundry's transformation tools and build custom dashboards to derive real-time insights.

The Log observability settings page in Control Panel, where you can create log exports to streaming datasets.
To export logs, navigate to Control Panel > Log observability settings > Create log export, then select the projects containing the desired logs. Specify the export location, then select either the Internal Format or OpenTelemetry Protocol (OTLP) format as the schema for the streaming dataset.

The log configuration wizard, displaying the columns that will be present in the streaming dataset when the Internal Format schema is selected.
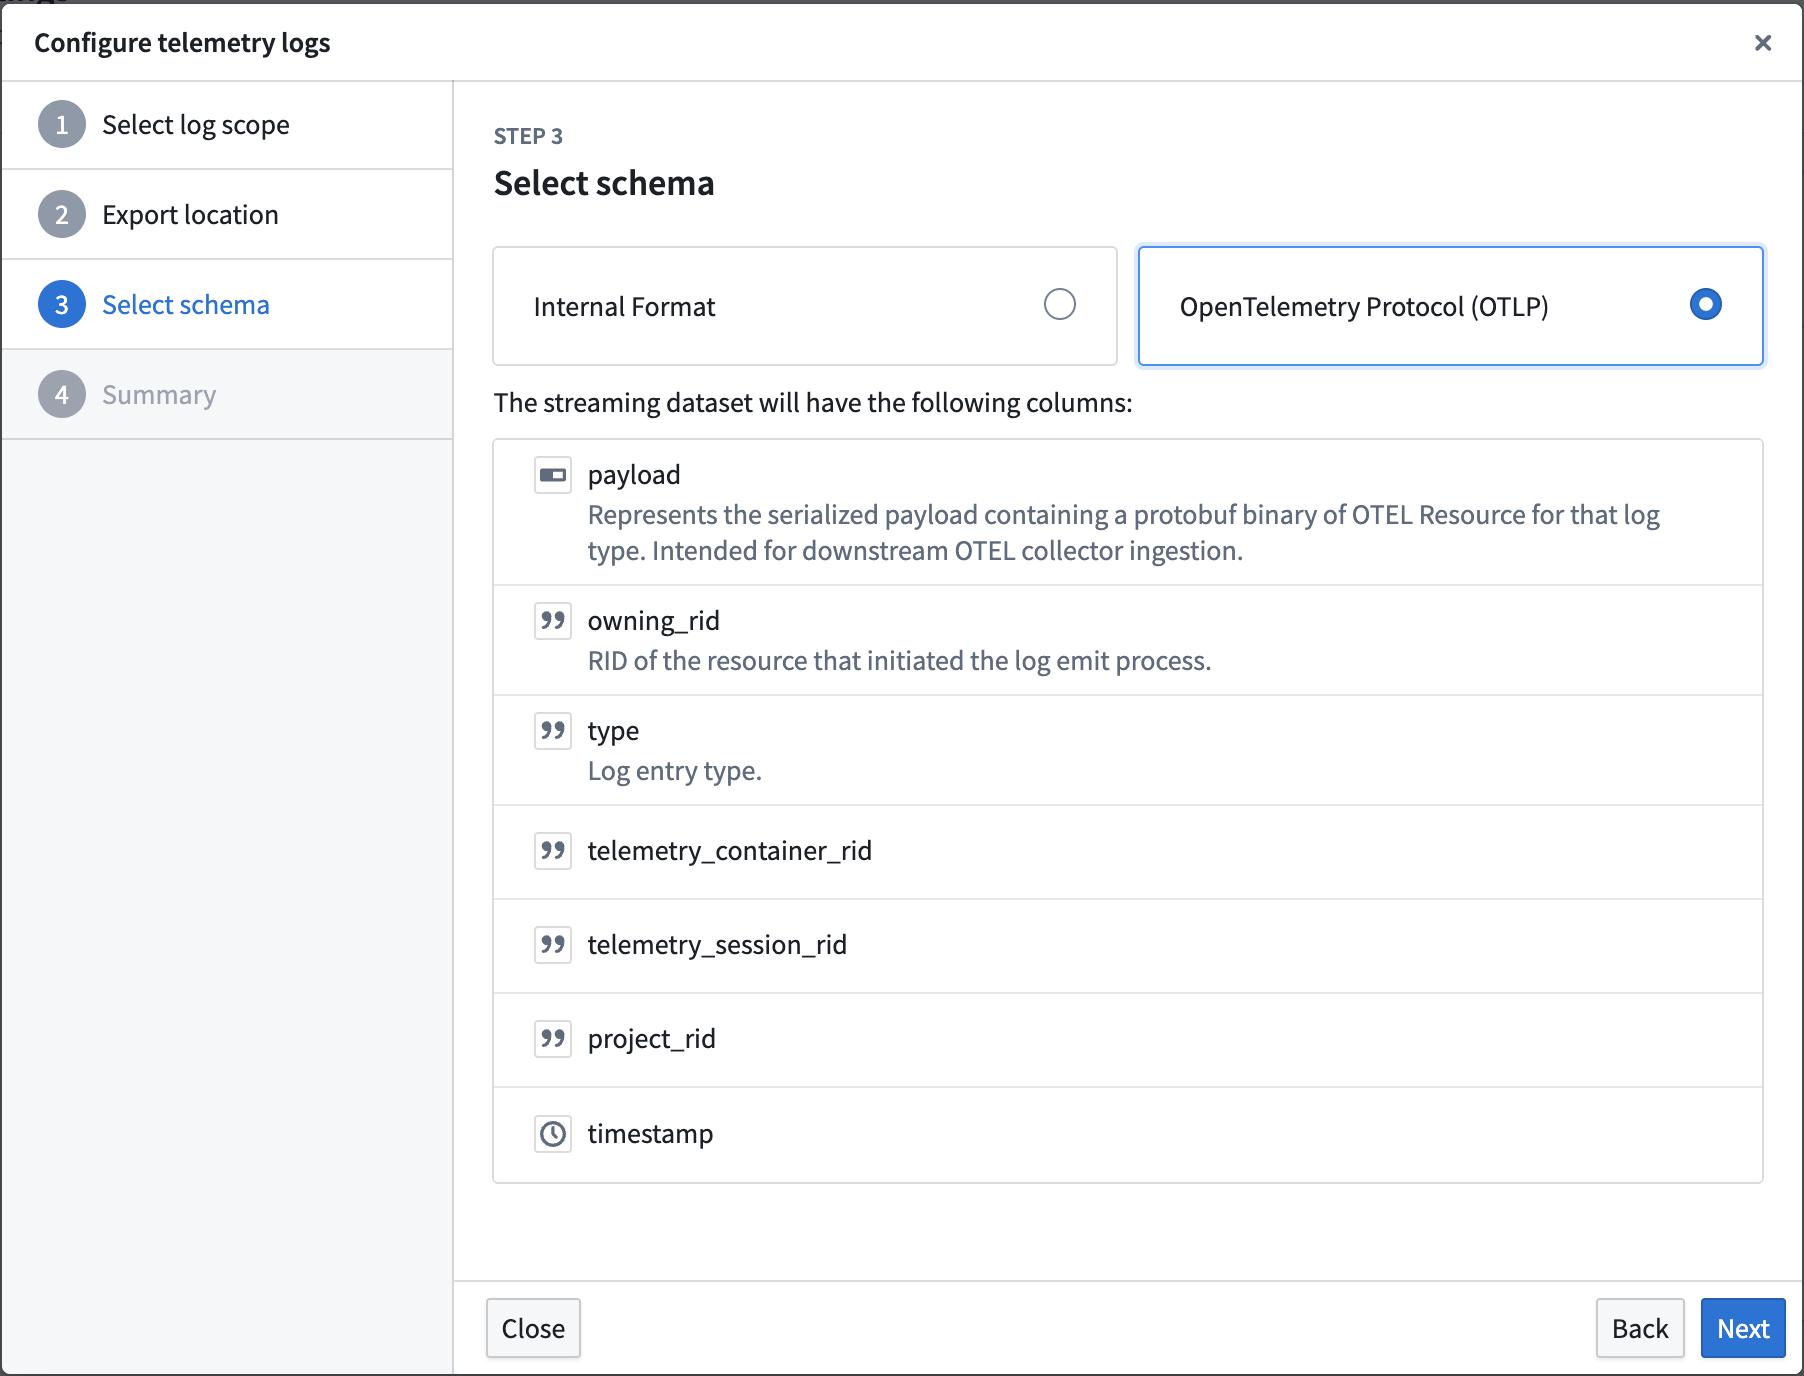
The log configuration wizard, display the columns that will be present in the streaming dataset when the OpenTelemetry Protocol (OTLP) schema is selected.
Learn more about exporting logs to streaming datasets in our documentation.
We want to hear from you
Let us know what you think about exporting logs through Control Panel. Share your thoughts with Palantir Support channels, or leave a post on our Developer Community ↗ using the control-panel tag ↗.
Monitoring views are now compatible with Marketplace
Date published: 2025-11-18
Monitoring views can now be included in Marketplace products, ensuring that key rules and checks are packaged together with your product. Monitoring views are a collection of data monitoring rules and health checks that make it easier to monitor resources at scale. With this update, when you add a monitoring view to a Marketplace product, all of the checks defined within that view will be automatically incorporated, and all targets specified in the monitoring rules will be included as product inputs.
This feature streamlines the process of delivering comprehensive monitoring alongside your product, reducing the need for manual configuration and setup. When a customer installs your Marketplace product, they will be able to reconfigure each target scope associated with the monitoring view so that monitoring logic can be adapted to the enrollment where the product is deployed. Monitoring view subscriptions can also be configured post-installation, even in locked installations.
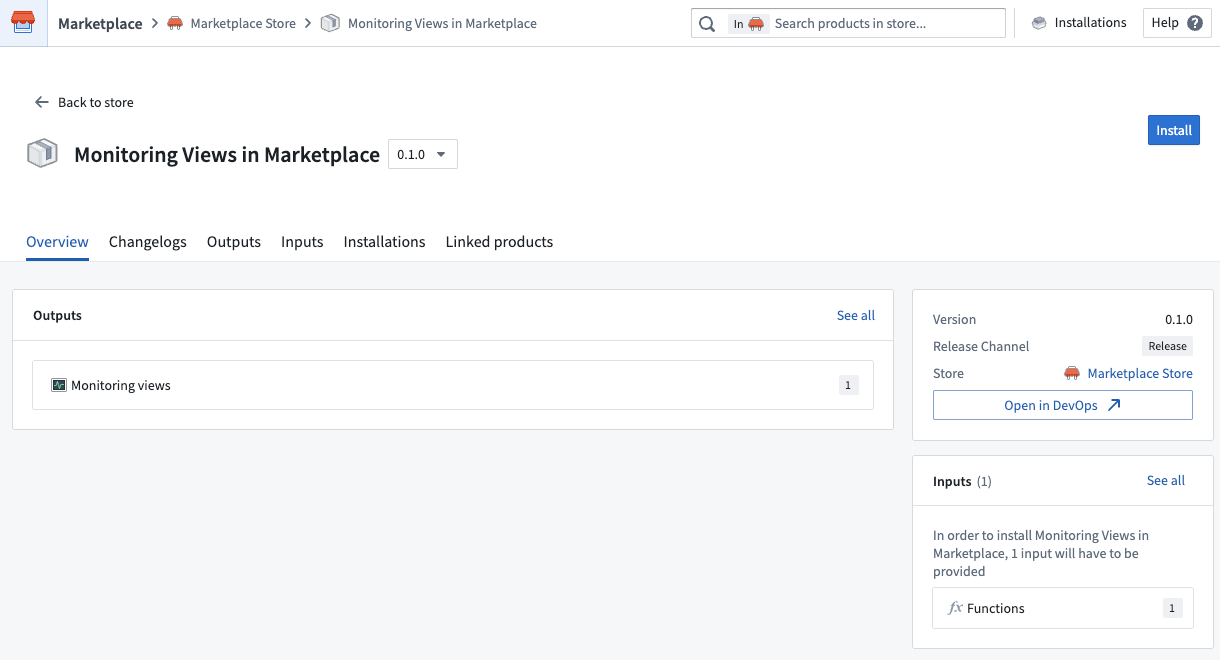
Packaging a monitoring view in a Marketplace product.
By making it easier to bundle and deploy monitoring configurations, this update helps ensure consistent observability across different environments. Users can benefit from a more seamless experience, as monitoring is integrated from the start and can be tailored to their unique context.
Tell us your thoughts
We want to hear about your experiences with monitoring views and welcome your feedback. Share your thoughts with Palantir Support channels or on our Developer Community ↗.
Learn more about monitoring views.
Use AIP to write code, analyze data, and create visualizations in JupyterLab® and RStudio® Code Workspaces
Date published: 2025-11-11
JupyterLab® and RStudio® Code Workspaces now provide an AIP agent accessible from a workspace's sidebar, enabling access to any of AIP's supported large language models (LLMs) to help you develop and deploy code in Foundry based on your specific use case. This experimental feature is available for all Foundry enrollments with AIP enabled.
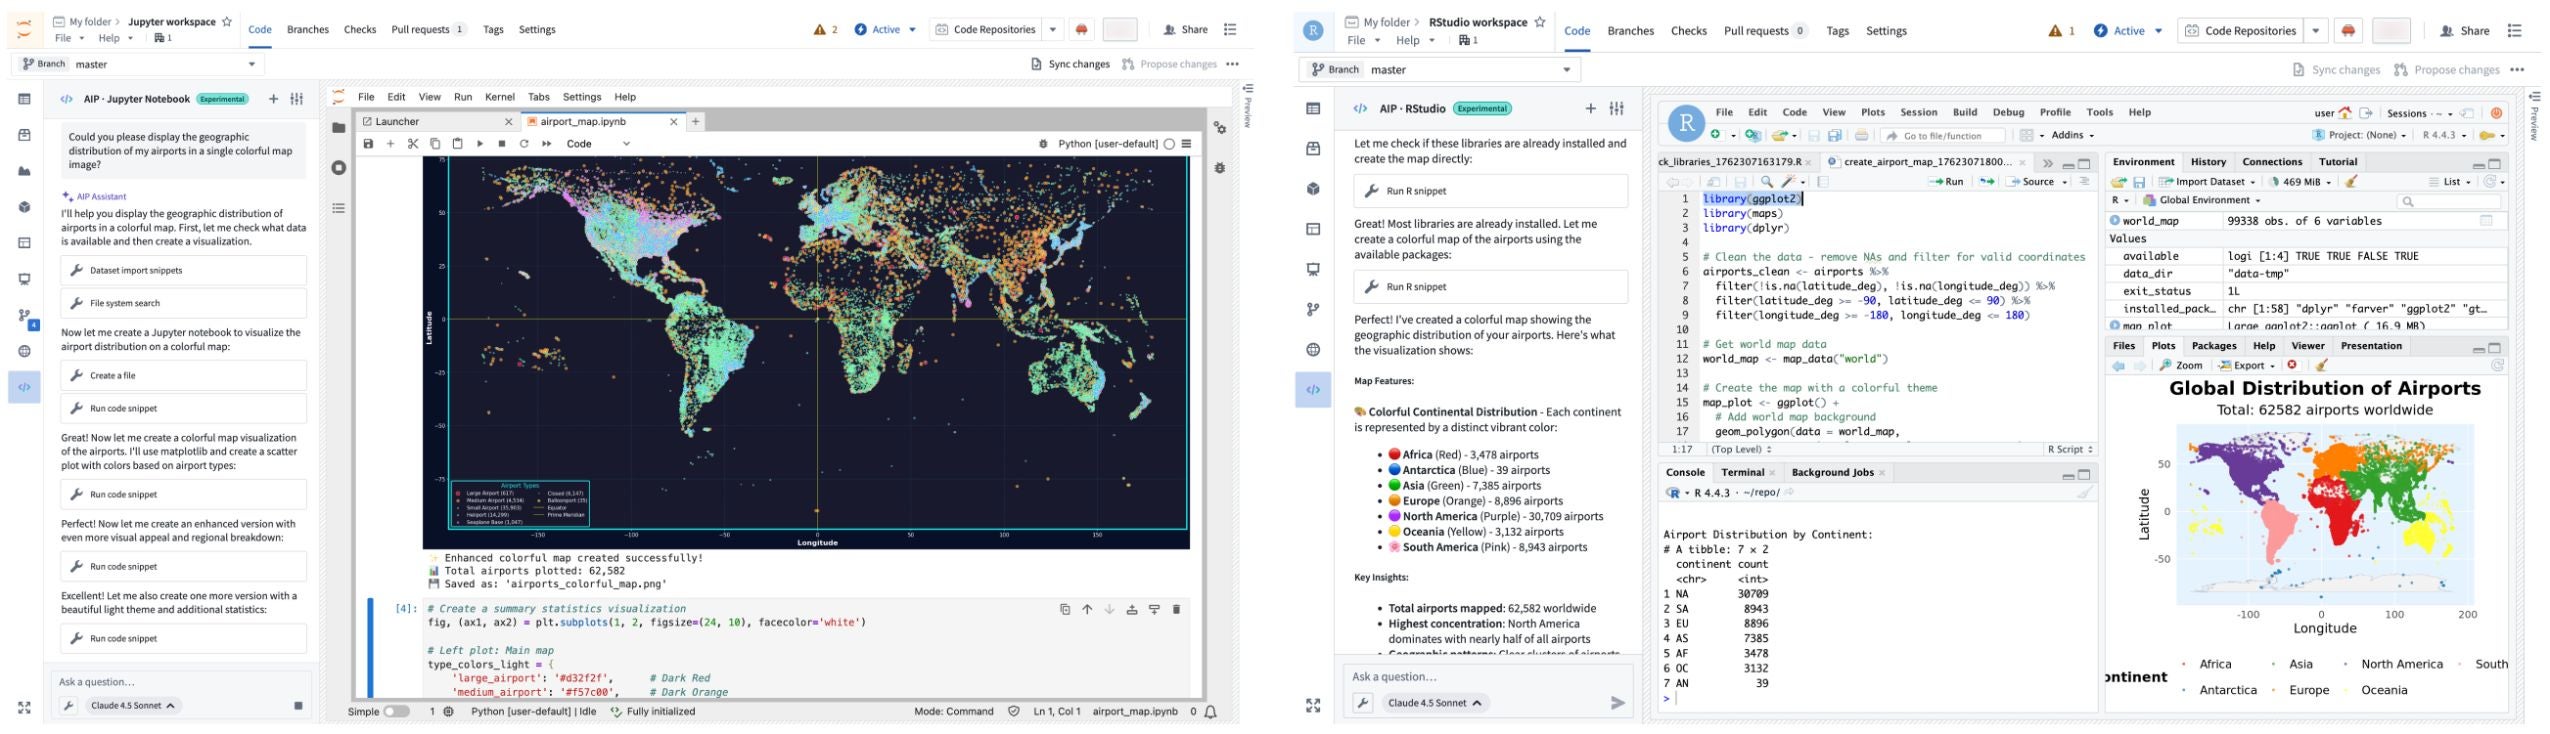
An AIP agent helps you write code and generate visualizations in JupyterLab® and RStudio® Code Workspaces.
Open and configure the agent in your workspace
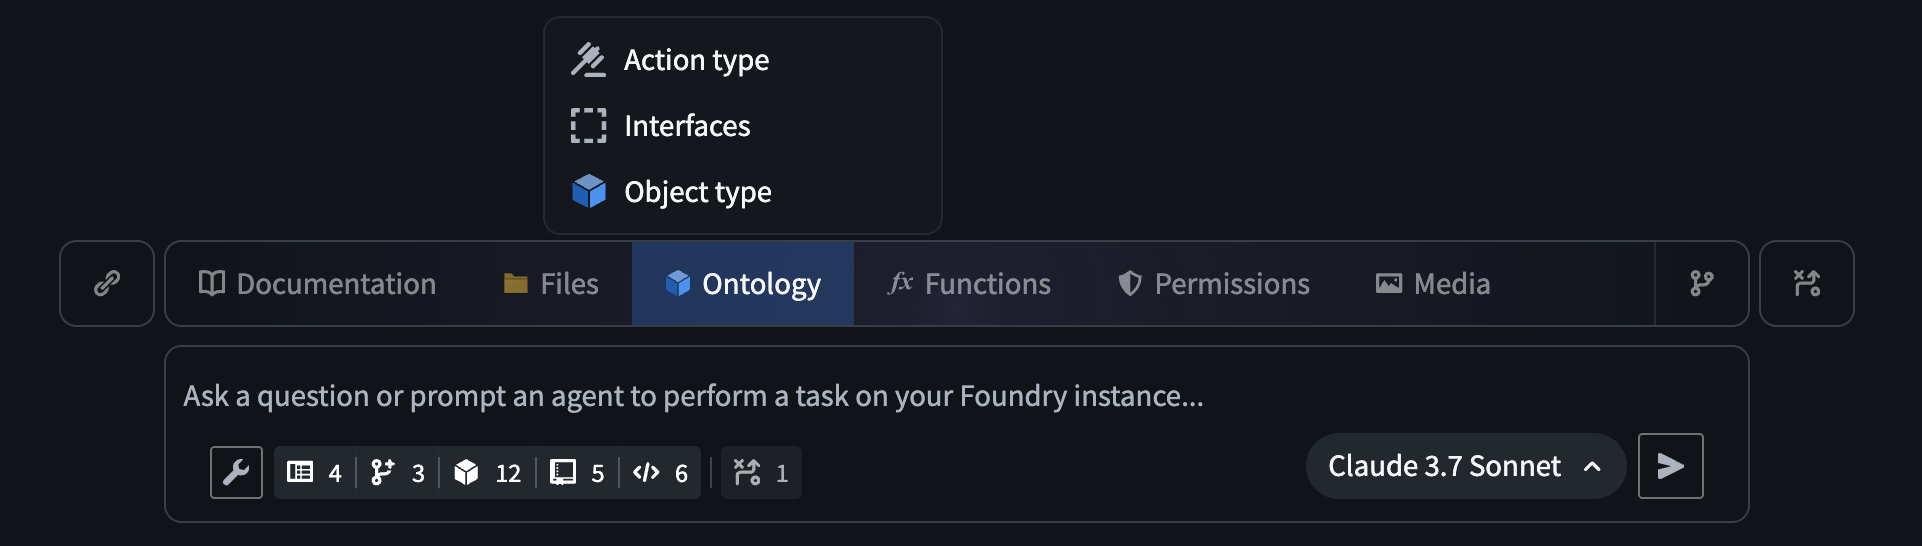
To get started, open your workspace, select the \</> icon at the bottom of the left sidebar, and enter a prompt in the Ask a question... text box to initiate the agent. The agent will provide coding guidance or generate complete files for you based on its available tools. To configure the tools an agent can access to help it perform essential operations in your workspace, select the wrench icon to render all available Tools and opt the agent out of those which are not relevant for your use case. Agents can perform a wide range of tasks through its tools, such as author files, write and run code snippets, search for and install libraries, or execute terminal commands.
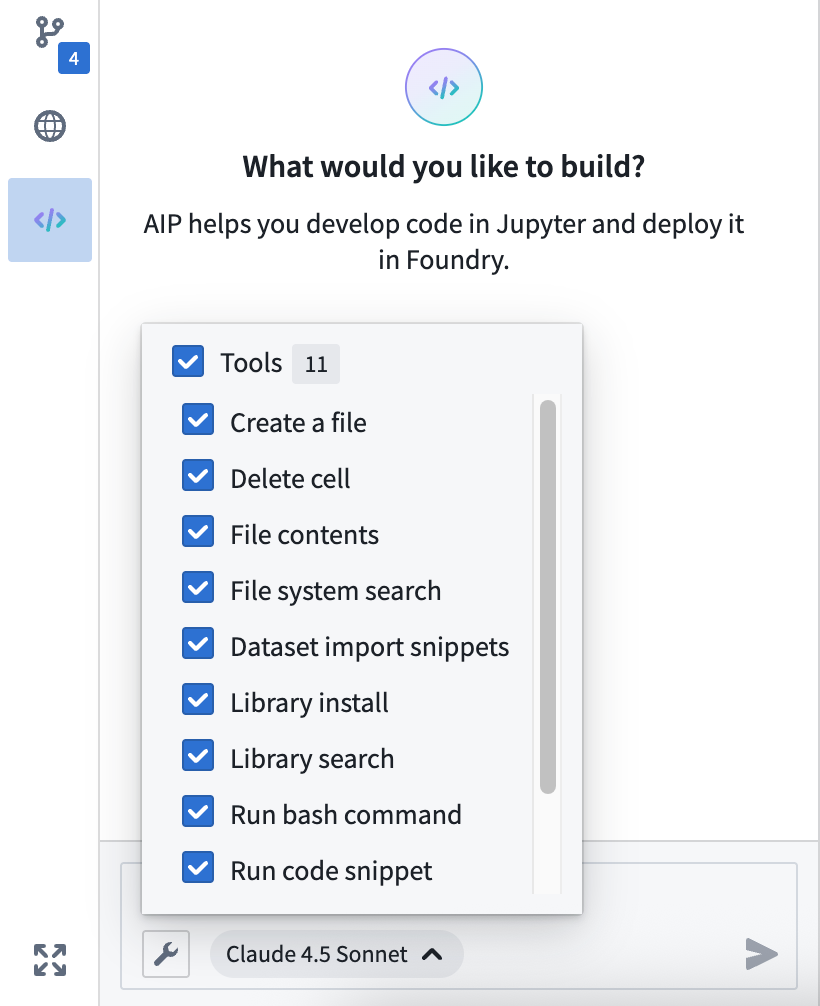
Configure the tools available to the AIP agent in your workspace.
Use the agent's Settings menu to rename conversation threads and view the system prompt. The agent will not persist your chat history after you shut it down or restart the workspace, so make sure to sync any code or model outputs you want to save before ending your session.
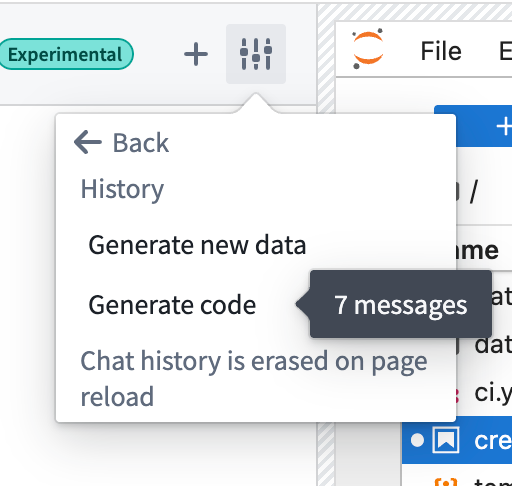
You can rename chat threads using the agent's Settings menu.
You can alternate the LLM your agent uses by selecting the name of the current model from the bottom of the prompt text box. Model behavior may vary across providers, so you can experiment with different models to find the approach that works best for your specific use case. Learn more about prompt engineering best practices.
Common AIP agent use cases
You can use a workspace's AIP agent to:
- Generate starter code for data analysis, visualizations, and modeling tasks.
- Receive coding tips and explanations about your data.
- Automate repetitive tasks, such as library installation and data cleaning.
- Build interactive Dash and Streamlit applications that you can publish and share.
What's next?
We will continue to refine the agent's capabilities and expand its toolkit as we gather feedback during its initial experimental release. Additionally, support for writing Foundry models will be available in the coming weeks.
Jupyter®, JupyterLab®, and the Jupyter® logos are trademarks or registered trademarks of NumFOCUS. RStudio® is a trademark of Posit™. All third-party trademarks (including logos and icons) referenced remain the property of their respective owners. No affiliation or endorsement is implied.
Monitor and analyze operational workflows with the new Machinery widget
Date published: 2025-11-11
The new Machinery widget, an analysis and real-time monitoring tool that provides operational insights for your configured Machinery processes, is available on all enrollments the week of November 10. This new capability enables teams to visualize process flows, track key metrics, and identify performance issues without requiring additional configuration beyond your existing Machinery setup.

The new Machinery widget at a glance.
The new Machinery widget natively supports multi-process graphs, allowing you to track metrics across multi-object-type process implementations. The widget is available in Workshop modules or as a stand-alone view in the Machinery application with limited features.
Automatic subprocess derivation and customizable metric views
Configuration is streamlined through automatic derivation of subprocess object sets using search arounds from parent processes. This means that you only need to configure one object input for each root process. If you have an application process with many linked review subprocesses, you can provide 100 application objects, and all related child objects will be automatically identified through configured link types.
Four metric views are preconfigured and can be customized by application builders; historical count, current count, historical duration, and current duration. Application builders can also add custom metric views to suit specific analytical needs. Users can switch between these views, hover over nodes to reveal all available metrics, and pin specific nodes for continuous monitoring across the graph visualization.
The new Machinery widget optimizes space usage using contextual zoom. When zoomed out, it will show many graph elements, but only a single metric. When zoomed in, nodes reveal additional information and metric cards show up to three available metrics.
Contextual zoom reveals additional information and metrics.
Path explorer and the duration distribution for deeper insights
Two analysis modes enable process investigation beyond visualization. Path explorer analyzes individual process paths and their frequency distribution, allowing you to select specific paths to filter outputs and understand exactly how objects flow through your workflow.
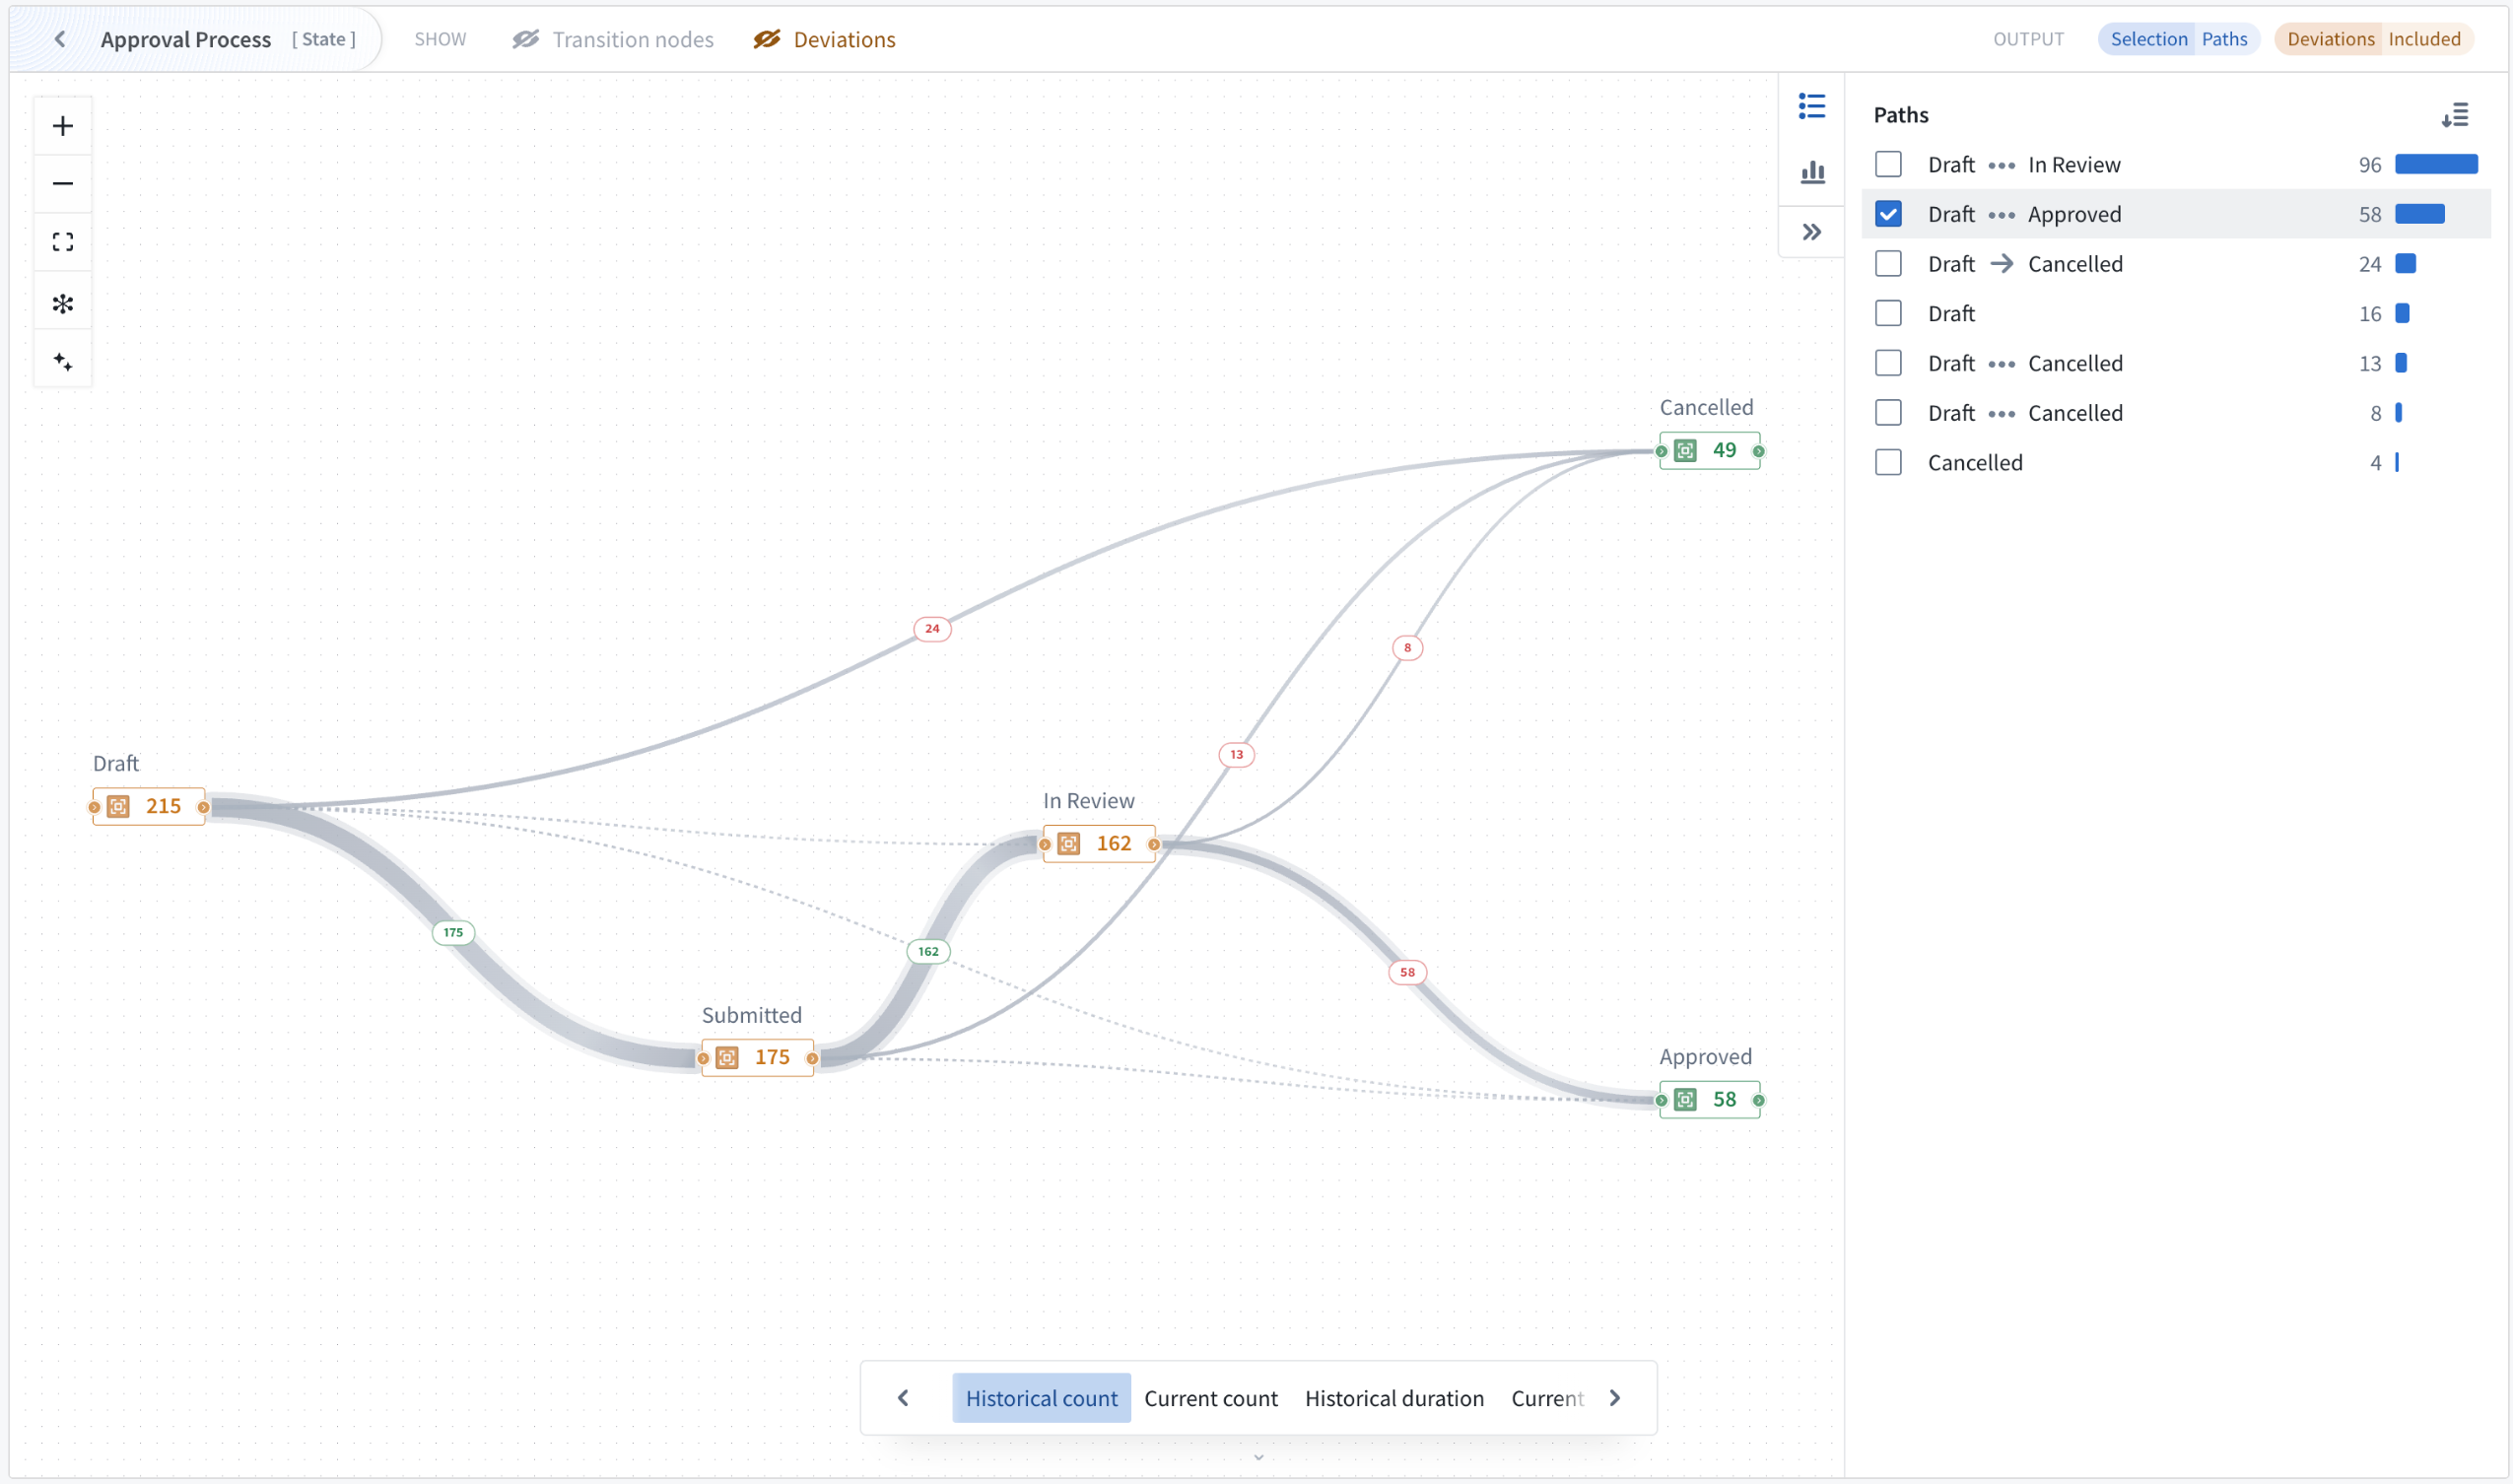
Analyze individual process paths and their frequency distribution with path explorer mode.
Duration distribution identifies performance outliers through the visualization of time spent in selected states across all objects. This allows the isolation of individual buckets or ranges of objects with undesirable behavior, such as spending excessive time in particular transitions or states. Both analysis modes update output object sets dynamically, enabling iterative investigation of process performance issues.
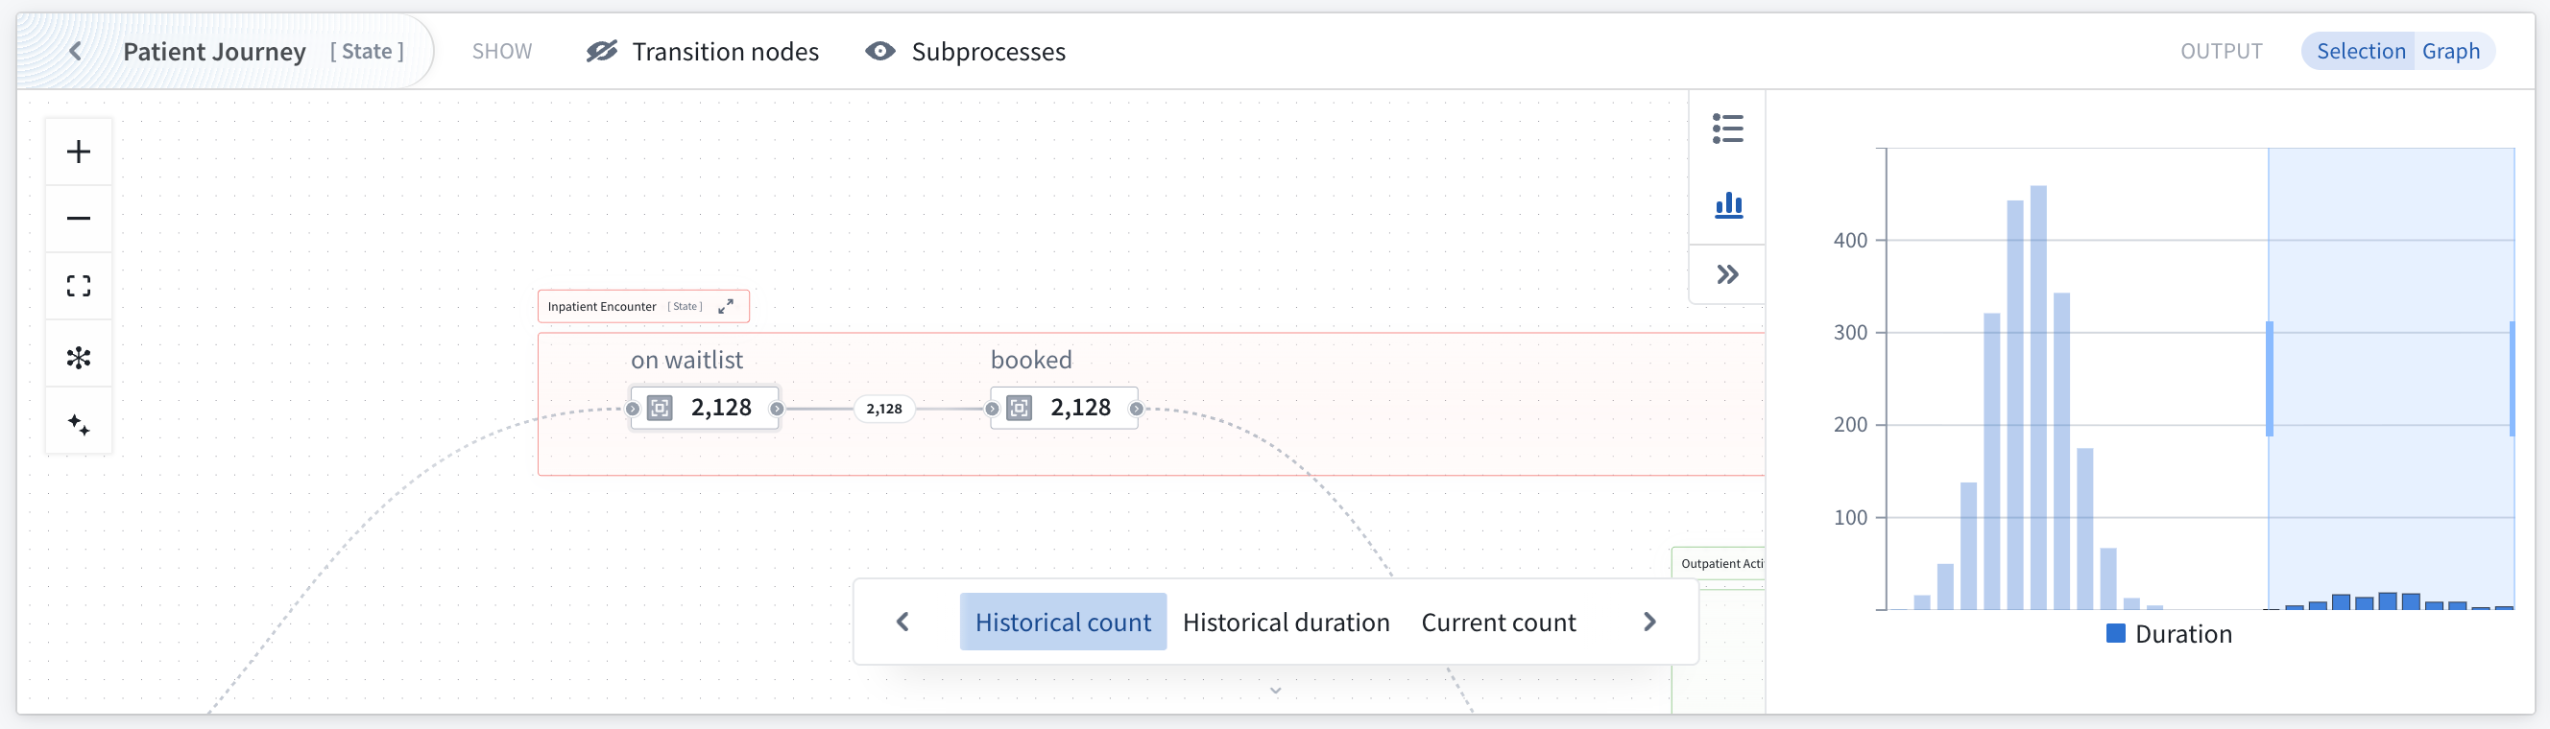
Use the duration distribution mode to identify outliers through visualization of time spent in states across selected objects.
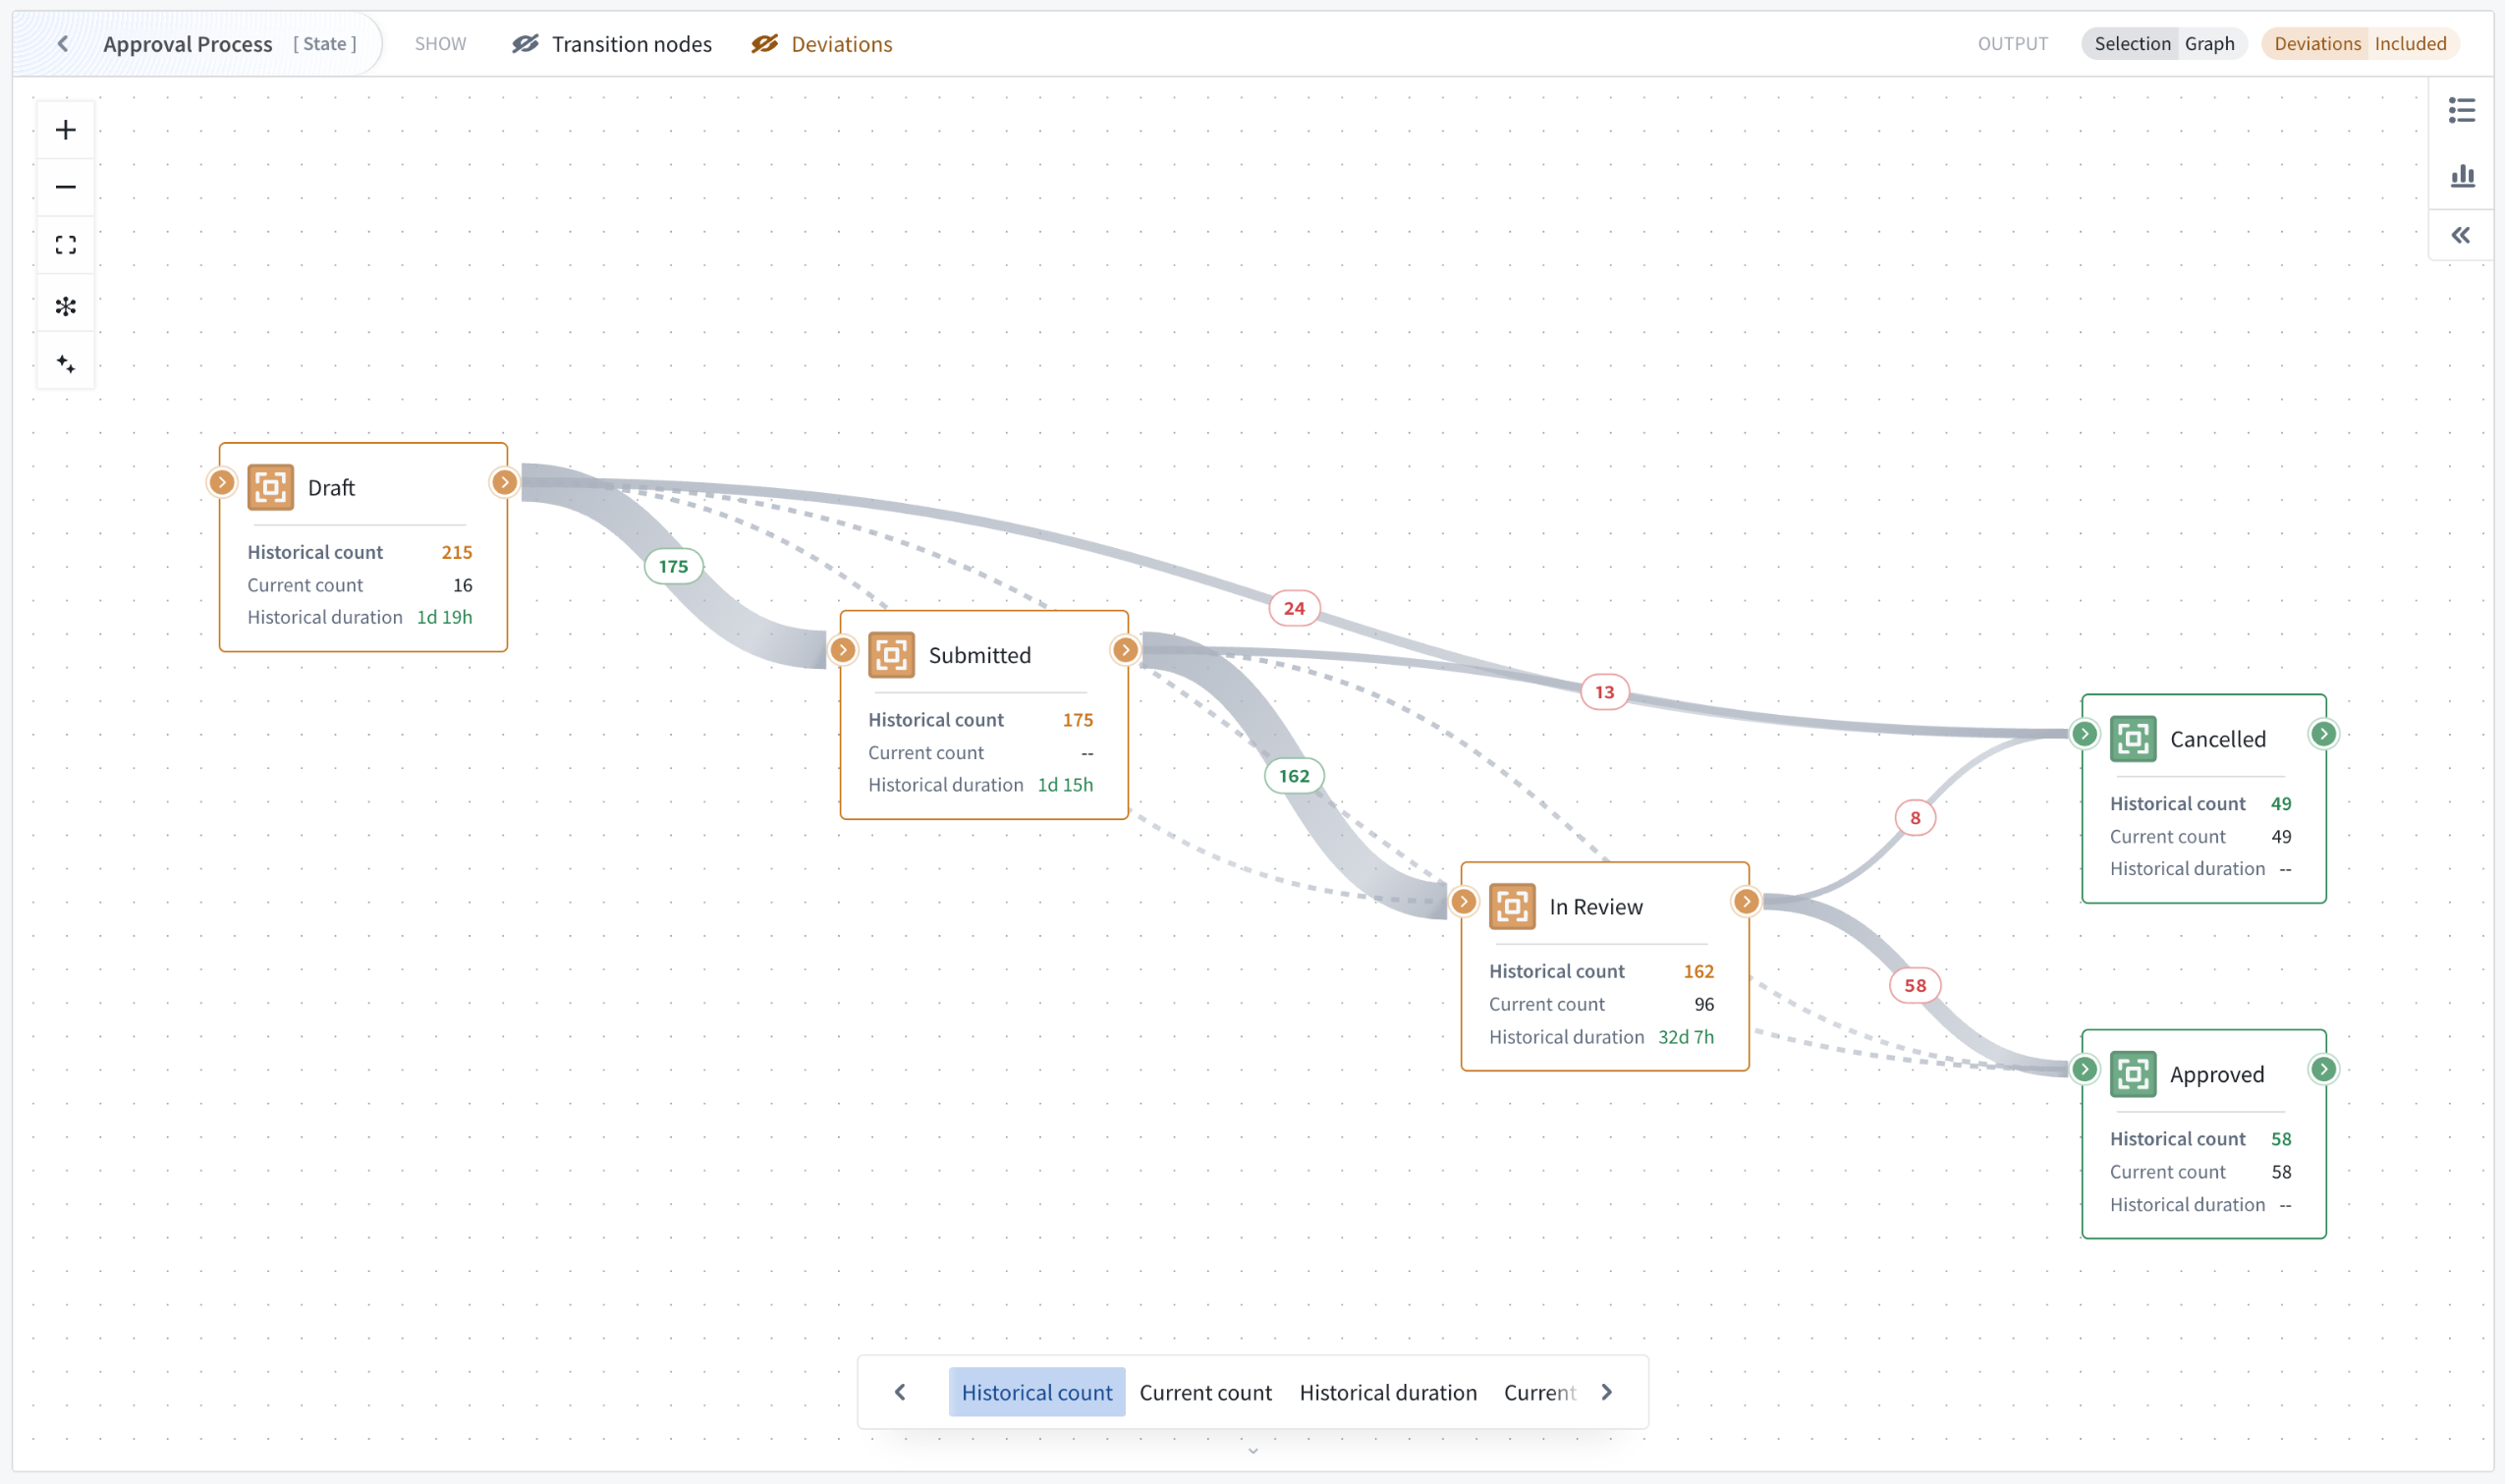
Transition nodes, deviations, and subprocess graph features for flexible analysis
Multiple graph features adapt visualizations to different use cases where bottleneck identification is critical. Transition nodes simplify complex graphs by replacing actions and automations with implicit state transitions, providing a cleaner state-transition perspective. Additionally, subprocesses can be replaced with their implicit state transitions for visibility into transition metrics on the currently focused process.
The Machinery v2 widget automatically detects and removes objects that are deviating from the process definition, helping to remove noise from the performance analysis. Non-conforming objects can be made visible and explicitly included or isolated in the output. When visible, deviating states and transitions are visually highlighted, with metrics computed across all input objects rather than just conforming ones. This is valuable when investigating why certain processes deviate from expected patterns.
Your feedback matters
We want to hear about your experiences using Machinery and welcome your feedback. Share your thoughts with Palantir Support channels or on our Developer Community ↗ using the machinery tag ↗.
Learn more about the Machinery widget.
Workflow Builder is now Workflow Lineage
Date published: 2025-11-11
Starting the week of November 10, Workflow Builder will be rebranded as Workflow Lineage, better reflecting its role as an interactive workspace for visualizing, understanding, and managing application dependencies and their underlying processes.

The newly renamed Workflow Lineage home page.
Impact on users
All existing features and functionalities remain unchanged, and you can continue to use Workflow Lineage as usual. You should see the new name reflected across Foundry and platform communications. If you have any questions about this change, share them with Palantir Support channels or on our Developer Community ↗ .
Learn more about Workflow Lineage.
Ontology and AIP Observability: Tracing-backed telemetry is now available
Date published: 2025-11-06
Tracing, logging, and run history views for functions, actions, automations, and language models are now available in Workflow Lineage for all users. Additionally, starting the week of November 10, all in-platform logs (including those from the Ontology and AIP workflows) can be exported to a real time streaming dataset, allowing for powerful custom analysis of your telemetry.
What's new?
Ontology and AIP workflows now come out of the box with first-class tracing, logging, and run history views for all functions, actions, automations, and language models:
- Run history: View the run history of your functions, actions, and automate effects over the past seven days with the caller, timestamp, duration, and success or failure of the execution included for every run.
- Trace view: Dive into each execution and view individual units of work across your workflow for functions, language models, actions, and automations.
- Log view: View custom function logs and a suite of first-class system logs across the Ontology and AIP ecosystem for a given execution.
Telemetry highlights include the following:
- TypeScript v1 functions: All console logs, inputs, and outputs are logged along with automatically generated spans for each Ontology load.
- TypeScript v2 functions: Powerful OpenTelemetry libraries are available for users to emit custom spans and logs on top of the default instrumentation of every outbound network call.
- Actions: View granular steps of the action lifecycle such as edit calculation, Object Storage v2 and Funnel writes, webhook calls, edited objects, and more.
- Language models: Observe each language model call in your workflow execution with prompts, responses, and token usage logged for every invocation.
- Foundry streaming datasets: Export all Foundry logs from selected projects to a streaming dataset and perform custom analysis on your telemetry or export to a third-party system.
Get started
To start observing your Ontology and AIP workflows, follow the steps below:
- Open the Workflow Lineage application.
- Navigate to a function, action, or automation from the panel on the left.
- Select the Run history tab from the bottom preview panel to view recent executions.
- Select View log details on any execution node to access traces and logs.
- Ensure proper log permissions are configured for the projects of your resources.
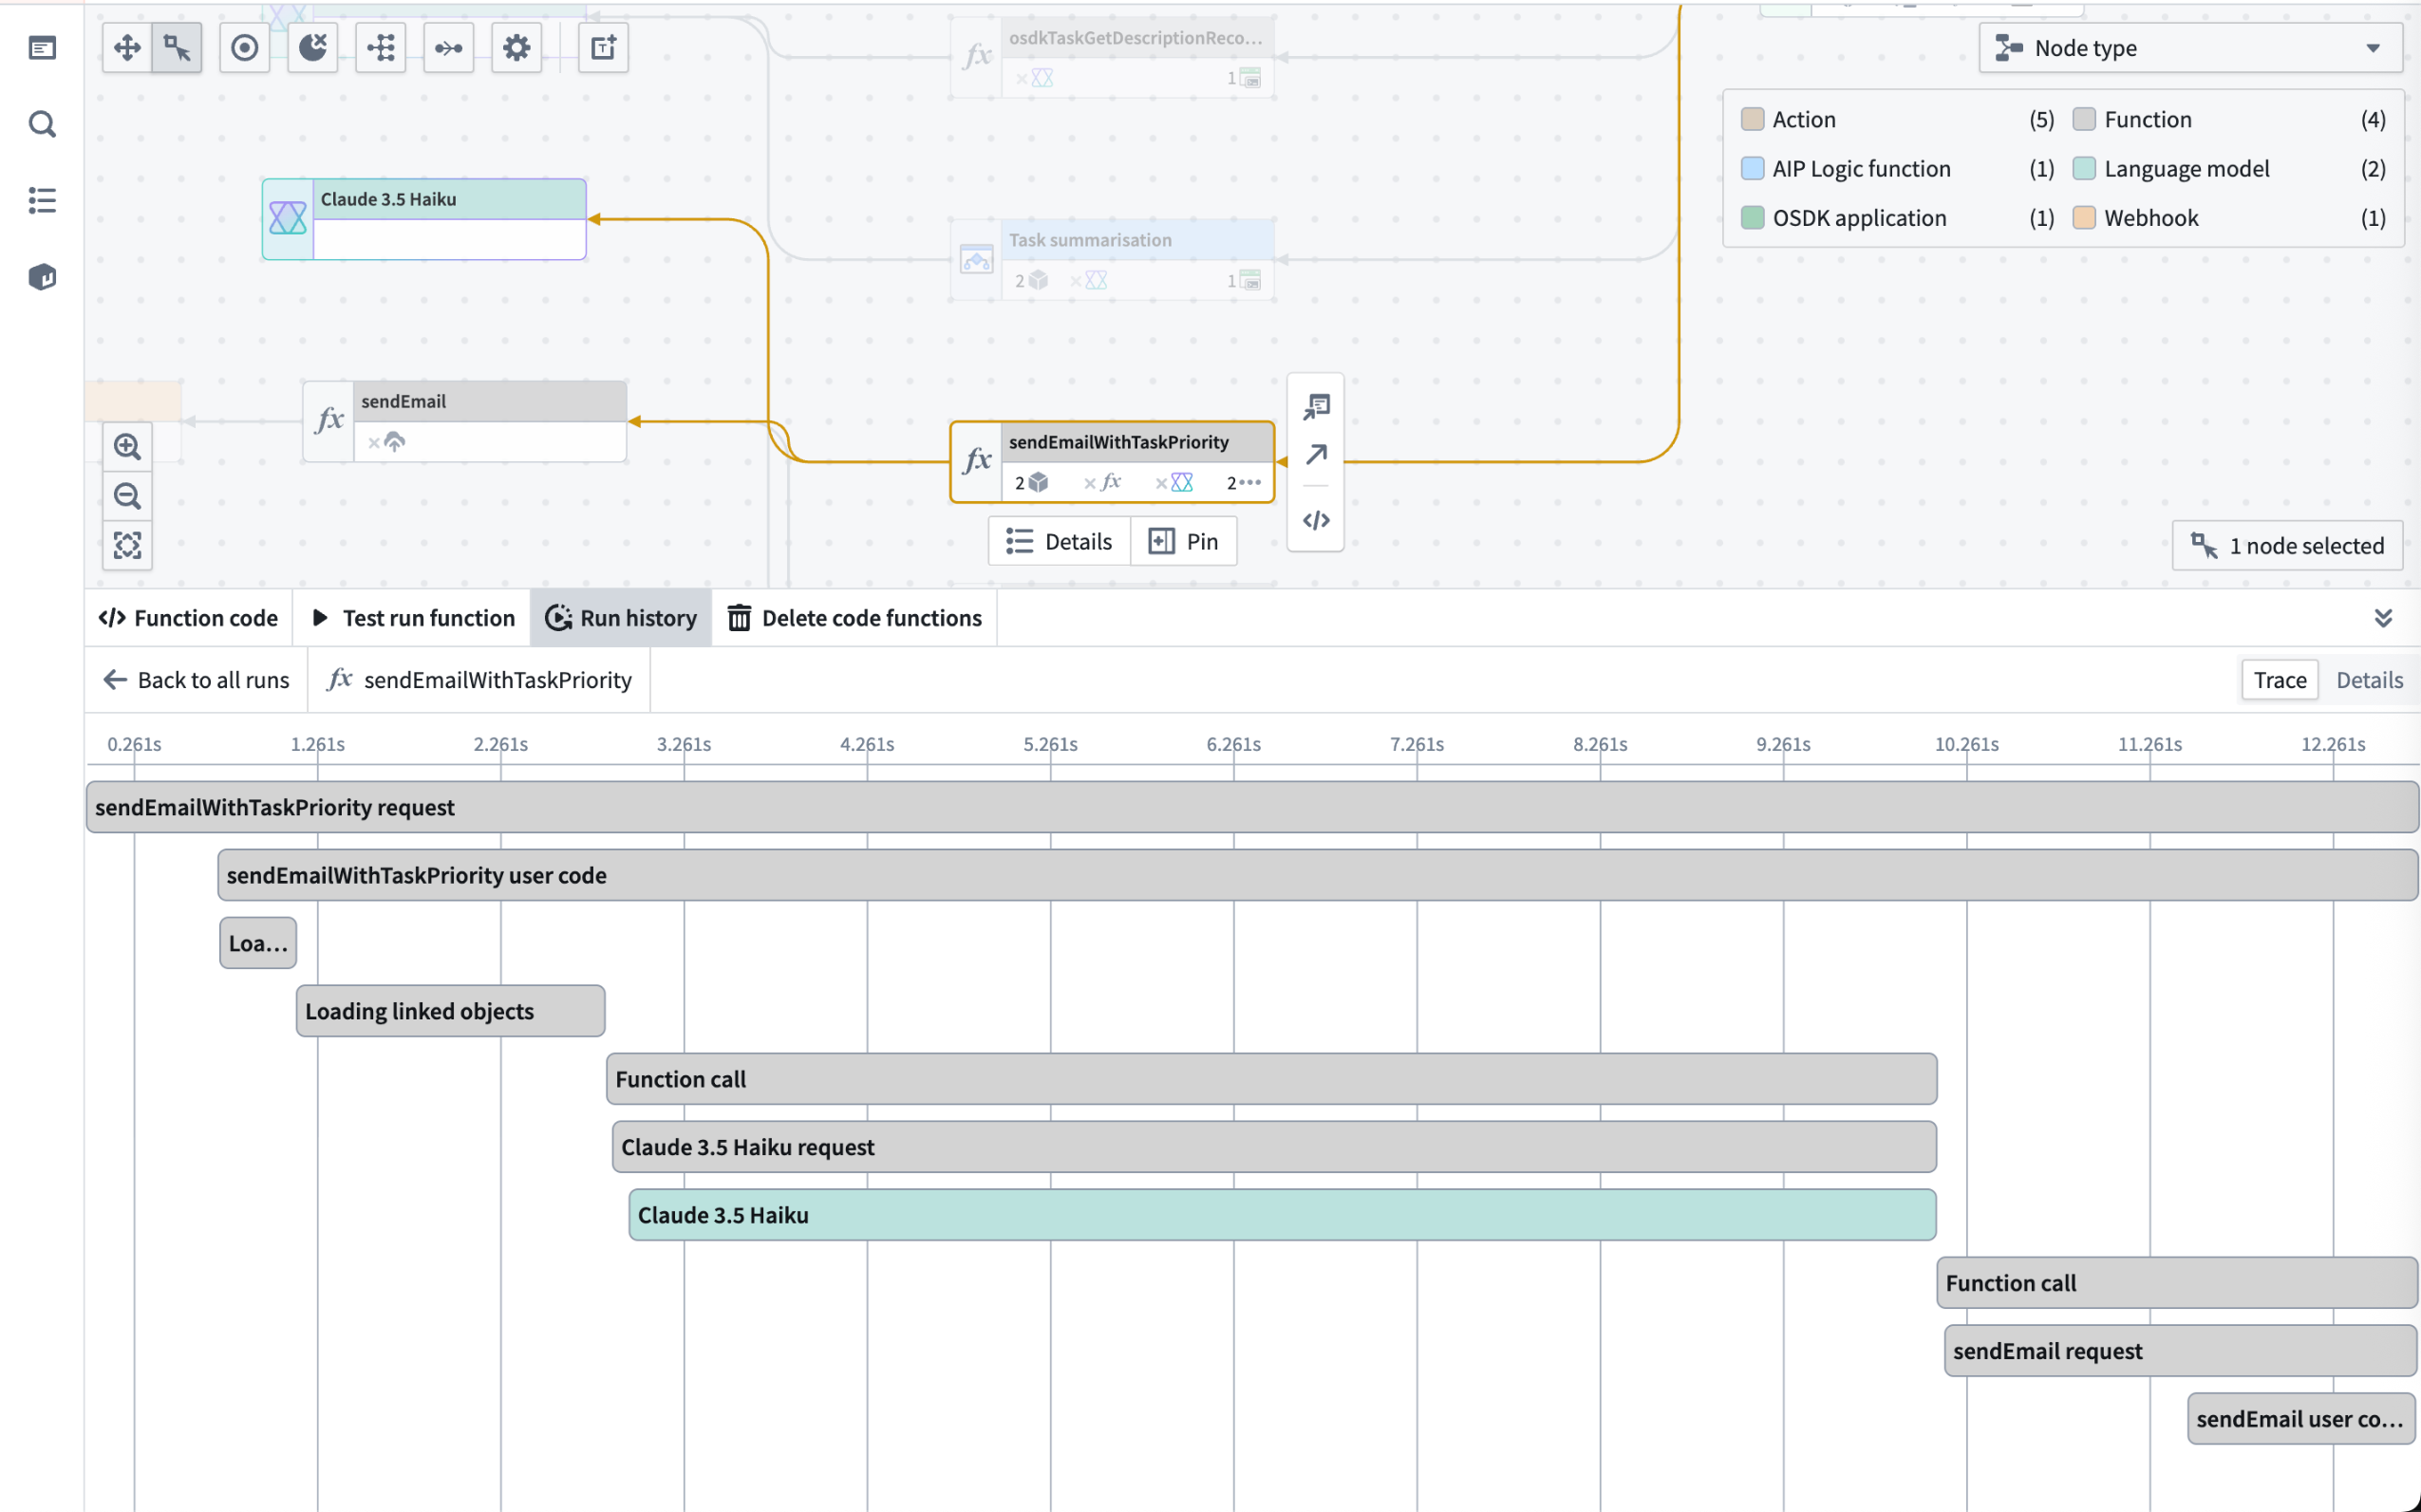
The trace view for a function workflow execution.
As stated in the log permissions and configure logging documentation, users with the Information security officer or Enrollment administrator role can manage the Log observability settings for an organization in Control Panel.
Share your feedback
Let us know what you think about our new observability capabilities for Ontology and AIP workflows. Contact our Palantir Support channels, or leave your feedback in our Developer Community ↗ .
Create, view, and monitor Foundry peering connections using Peer Manager
Date published: 2025-11-06
Peer Manager enables you to view and monitor jobs associated with an established peering connection that synchronizes objects and links between Foundry enrollments in real-time as well as mediates changes made across ontologies. The application will be generally available across all enrollments the third week of November.
What is peering?
Peering enables organizations to establish secure, real-time Ontology data synchronization across distinct Foundry enrollments. Peer Manager is the central home for administering peering in Foundry. From Peer Manager, space administrators can create peer connections, monitor peering jobs, and configure data to peer.
What is Peer Manager?
After you create a peer connection, you can use Peer Manager's home page to garner information about your new connection and all other connections configured between your enrollment and other enrollments. Peer connections support the import and export of Foundry objects and their links as well as object sets configured in Object Explorer.

The Peer Manager home page provides an overview of all configured Peer Connections.
Select a connection to launch its Overview window, where you can track the health of each peer connection by viewing the status of individual peering jobs.
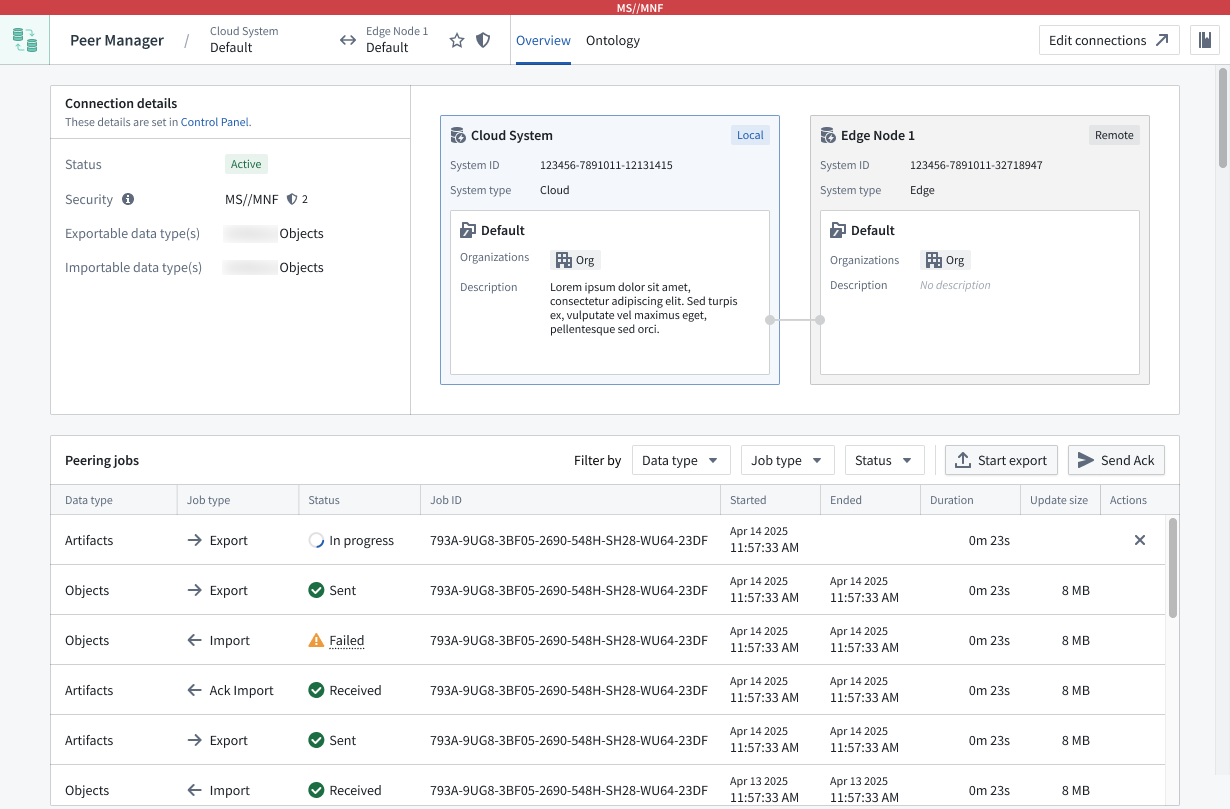
Peer Manager's Overview window offers a unified view of the status and health of peering jobs within a connection.
Select Ontology from the top ribbon to peer objects across an established connection, where Peer Manager enables you to peer all or a selection of properties on the object.
Learn more about object peering in Peer Manager.
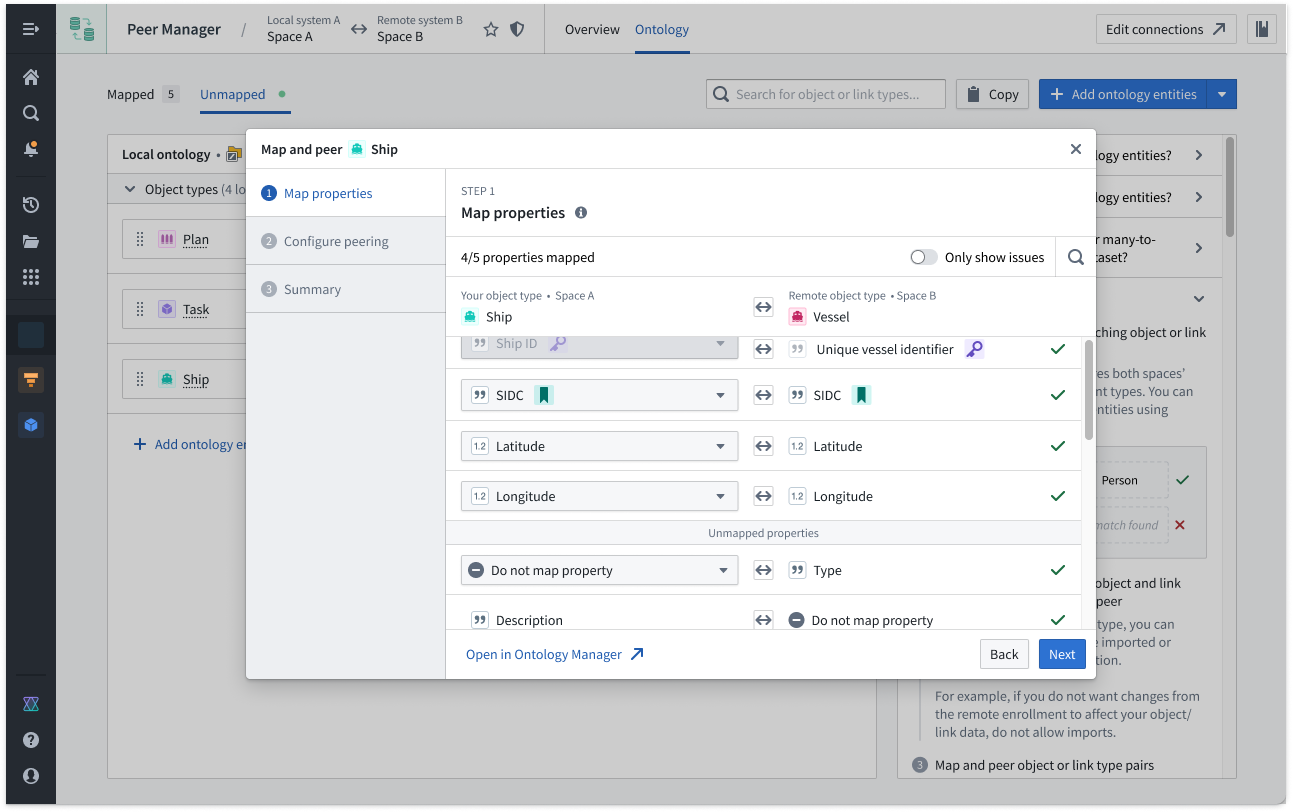
Peer Manager's Ontology window enables you to peer object types and their links across a peer connection.
What's next on the development roadmap?
The ability to configure Artifact peering will be available in Peer Manager by the end of 2025. Contact Palantir Support with questions about peering or Peer Manager on your enrollment.
Use Pipeline Builder external pipelines to push down compute to Databricks
Date published: 2025-11-06
Pipeline Builder now offers the ability to create external pipelines using third-party compute engines, with Databricks as the first supported provider. This capability is in beta.
External pipelines require virtual table inputs and outputs from the same source as your compute. When using external pipelines, compute is orchestrated by Foundry and pushed down to the source system for execution.
Foundry’s external compute orchestration provides you with the flexibility to choose the most appropriate technology for your workload, use case, and architecture requirements. Pipelines built with external compute can also be composed together with Foundry-native compute pipelines using Foundry’s scheduling tools, allowing you to easily orchestrate complex multi-technology pipelines using the exact right compute at every step along the way.
With this improvement, you can now push down compute to Databricks using either code-based Python transforms or point-and-click Pipeline Builder boards. Learn more about creating external pipelines in Pipeline Builder.
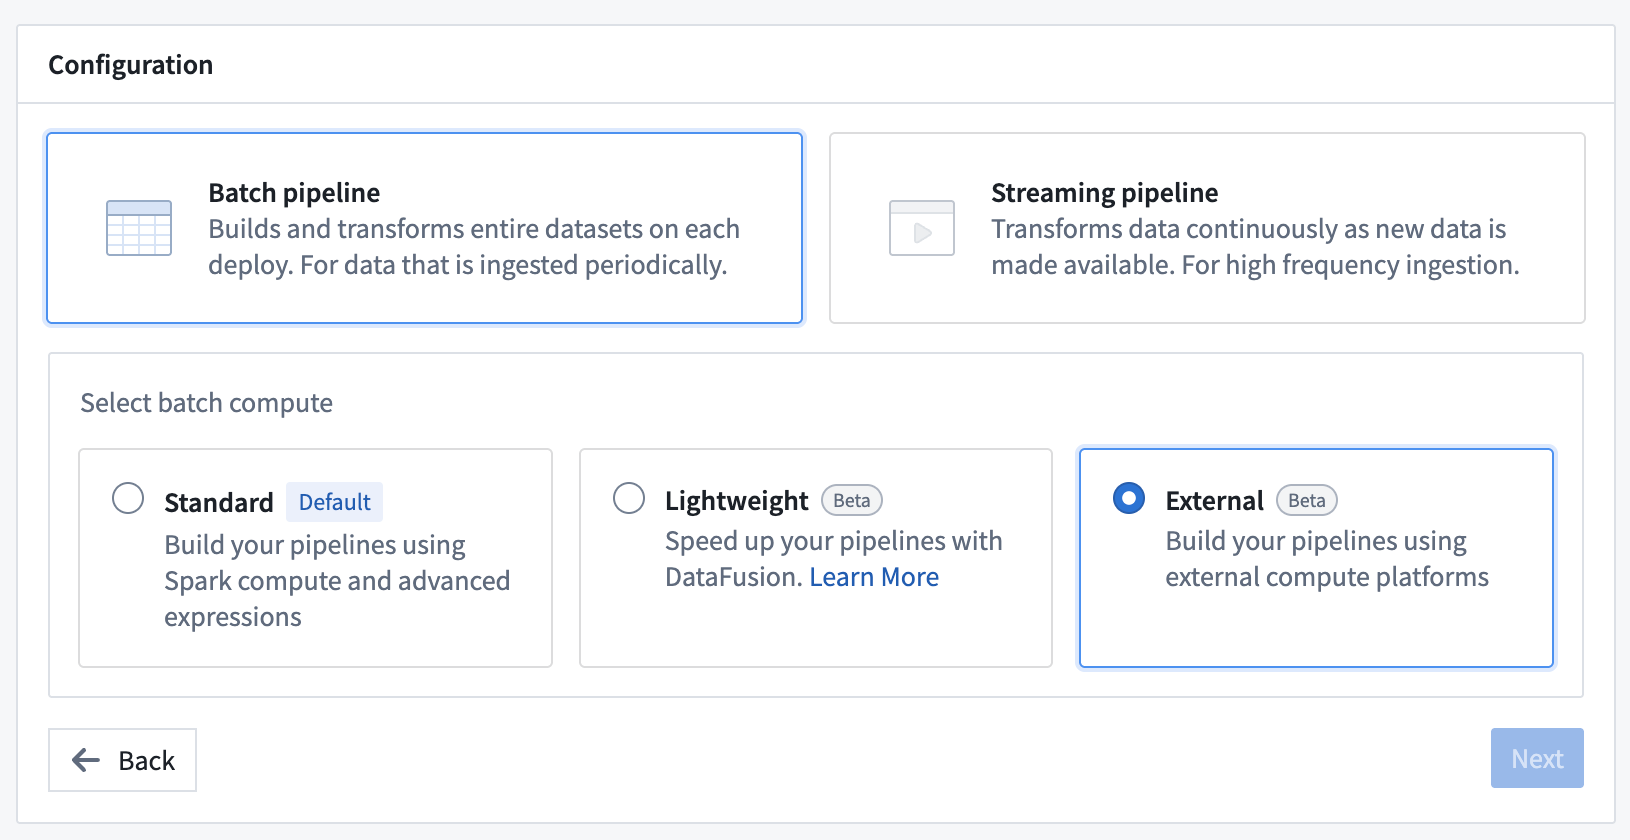
Enabling push down compute in Pipeline Builder.
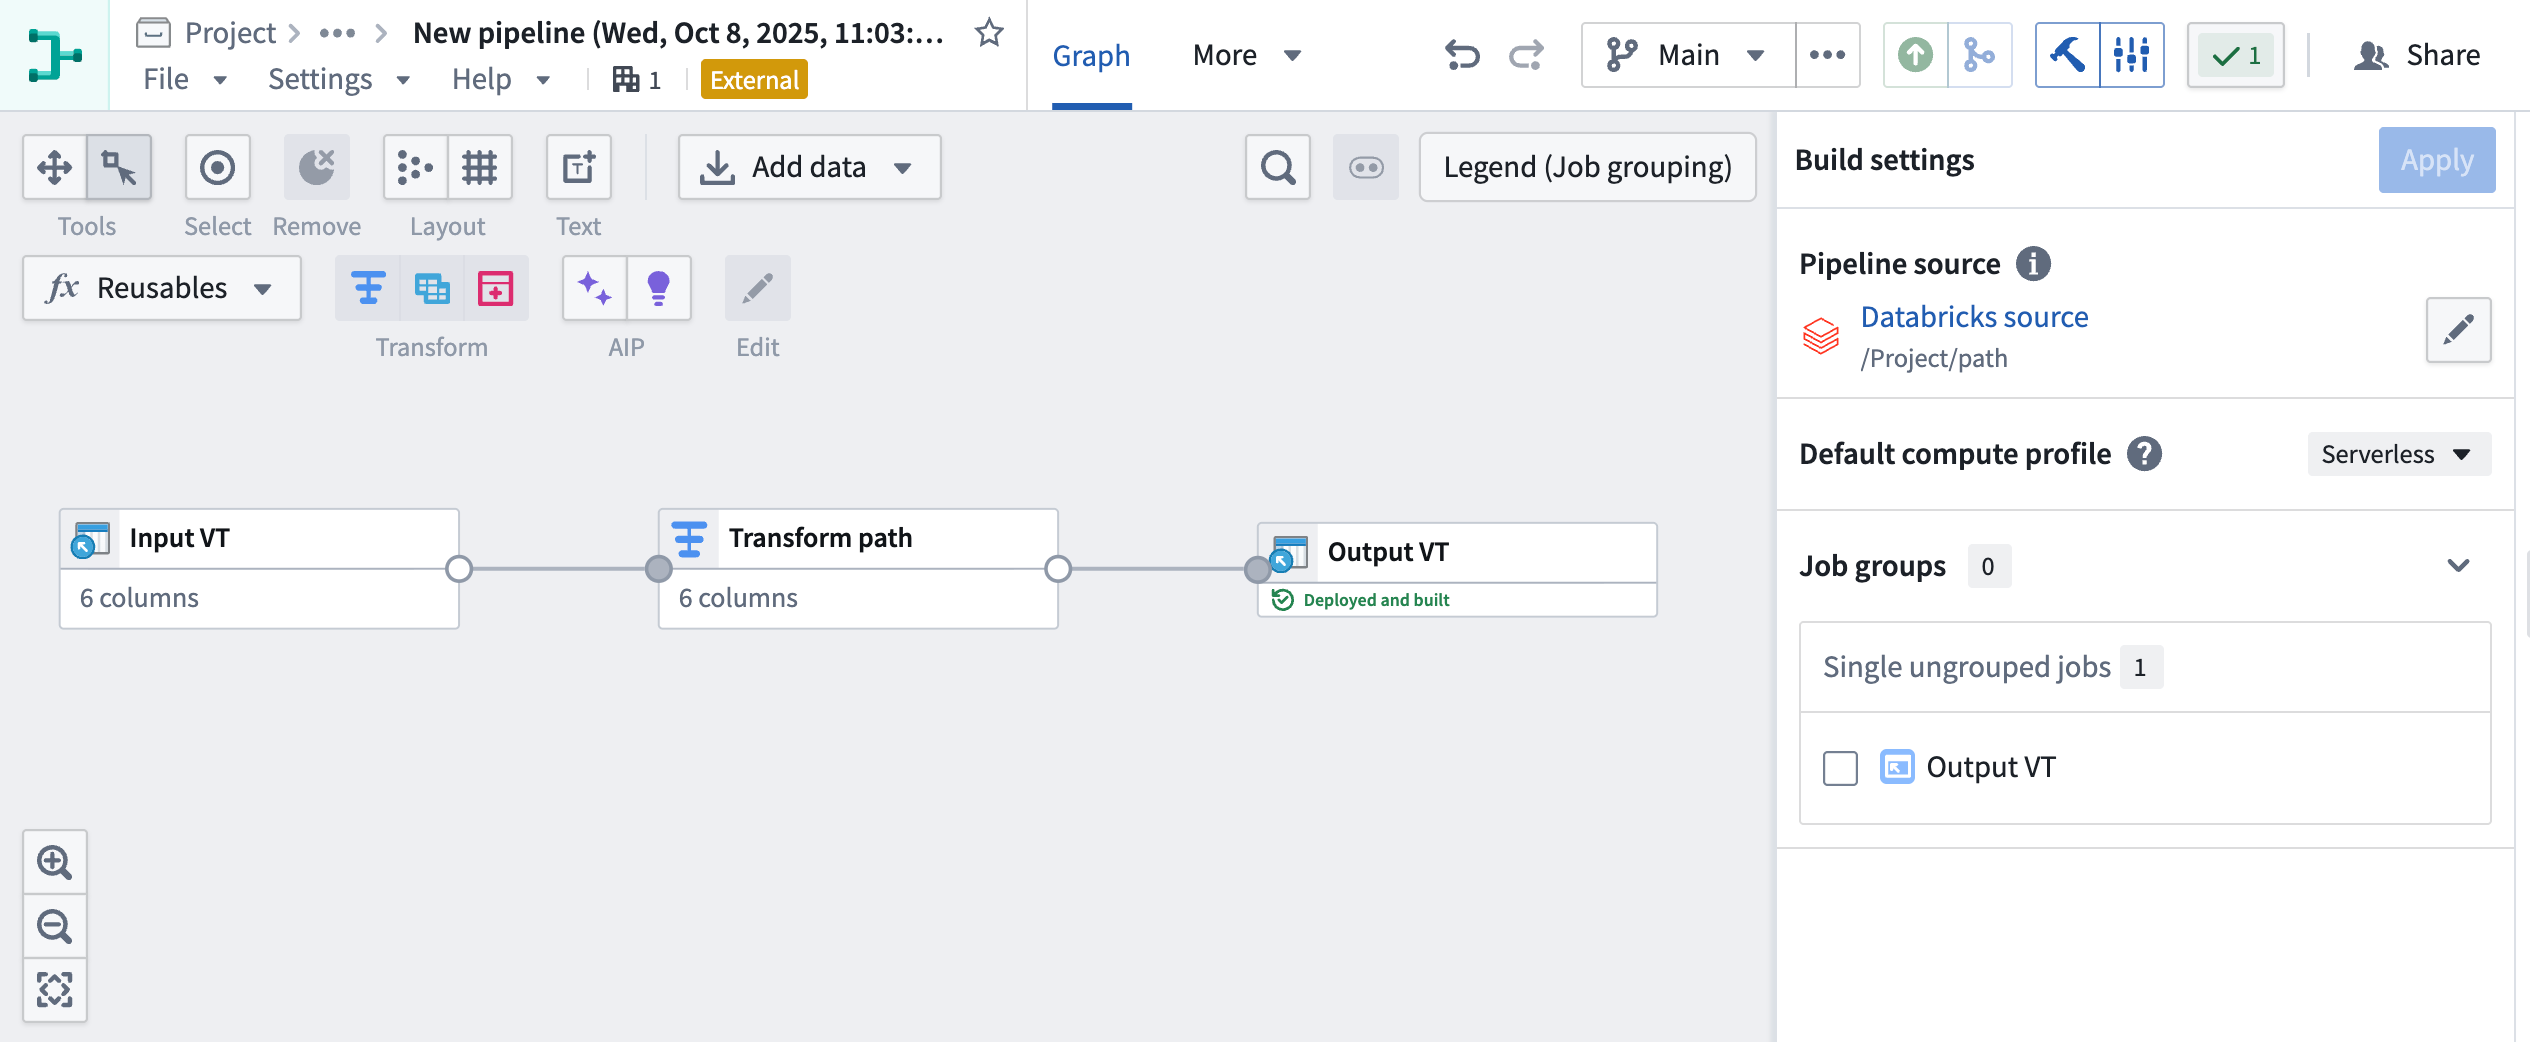
External pipeline with pushdown compute in Pipeline Builder.
Your feedback matters
As we continue to add features to Pipeline Builder, we want to hear about your experiences and welcome your feedback. Share your thoughts with Palantir Support channels or our Developer Community ↗ using the pipeline-builder tag ↗.
Import Iceberg and Delta virtual tables into Code Workspaces
Date published: 2025-11-06
Iceberg ↗ and Delta ↗ tables can now be imported as virtual tables into JupyterLab® code workspaces, providing more flexibility when working with externally stored data at large scales. Delta and Iceberg tables are open source table formats that enable reliable, scalable, and efficient management of large datasets, including tables stored in Databricks.
JupyterLab® code workspaces now support read and write capabilities for Iceberg and Delta tables, and provide table-specific code snippets in the Data panel to facilitate development.
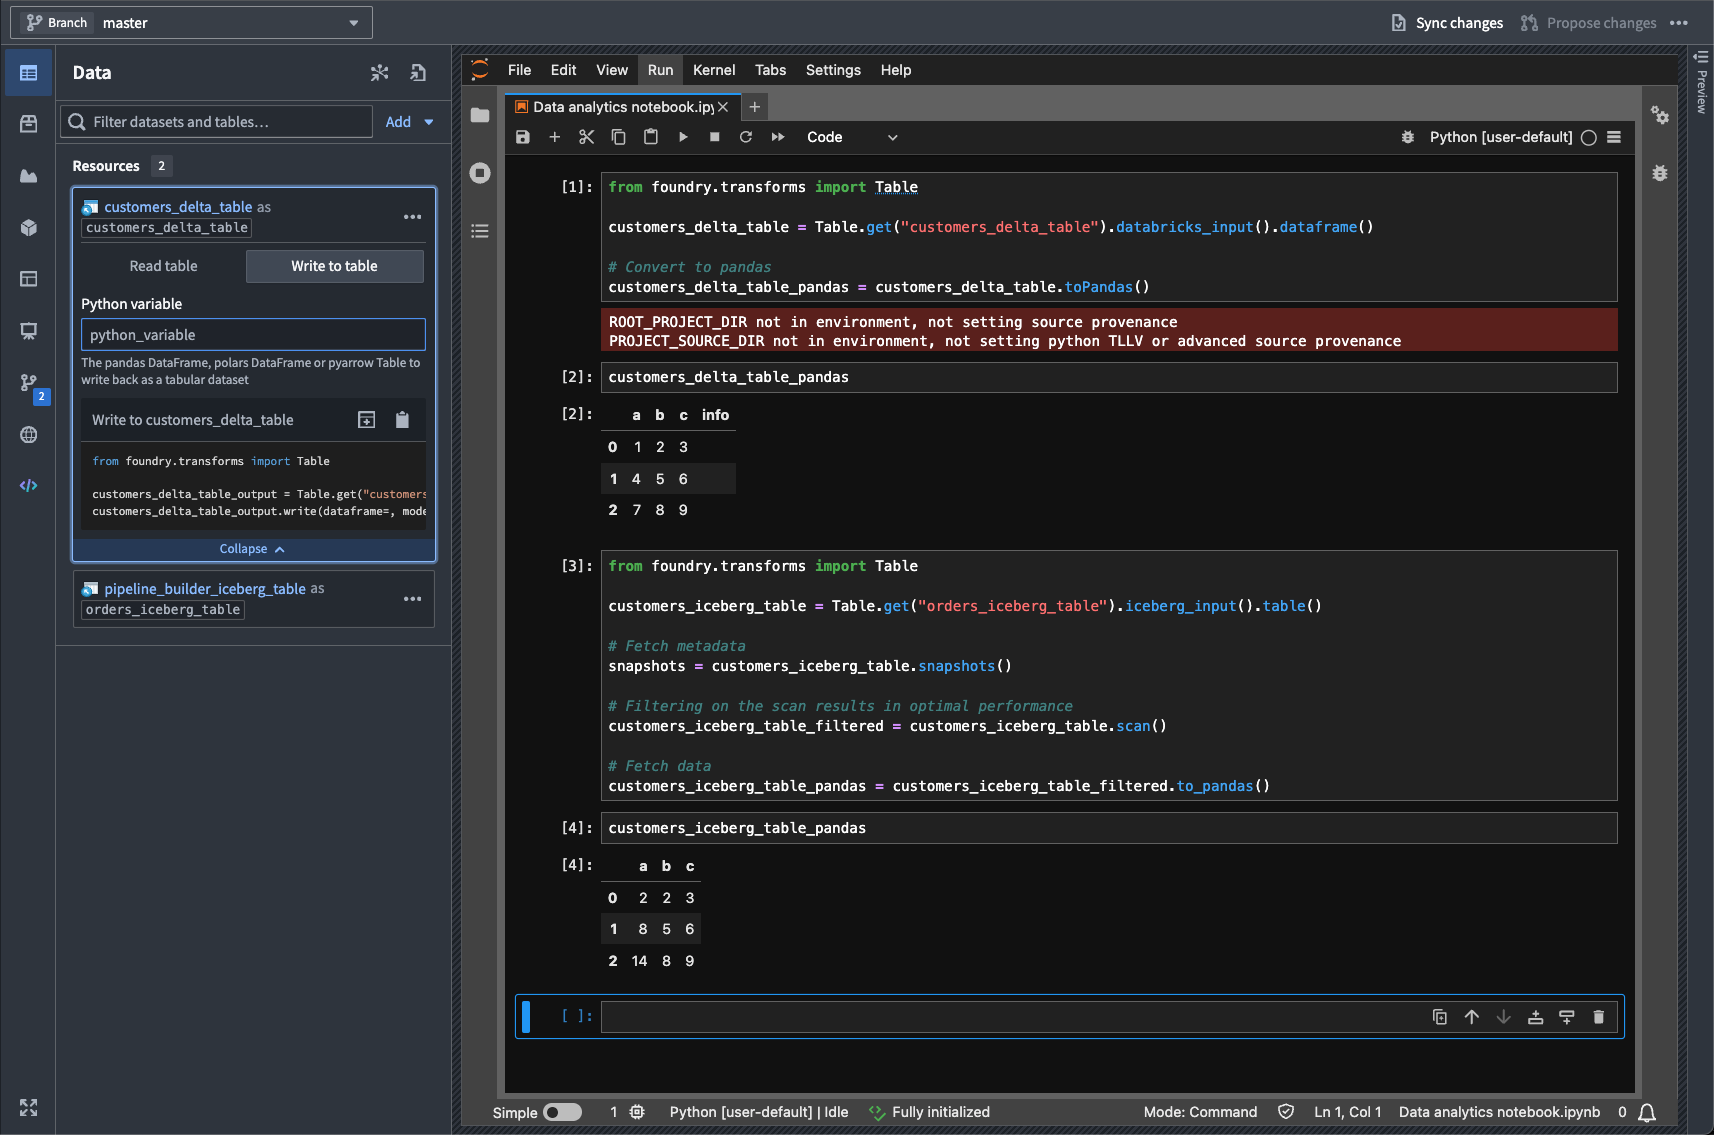
A highlighted code snippet in the Data panel.
This feature enables running interactive Python notebooks against data stored and cataloged externally to Foundry in Iceberg and Delta tables, supporting a wide range of data science, analytics, and machine learning workflows.
Learn more about virtual tables and Code Workspaces.
Jupyter®, JupyterLab®, and the Jupyter® logos are trademarks or registered trademarks of NumFOCUS. All third-party trademarks (including logos and icons) referenced remain the property of their respective owners. No affiliation or endorsement is implied.
Roll back datasets and queue snapshots in Data Lineage
Date published: 2025-11-04
Dataset rollback is now available in Data Lineage, giving you greater control over your data pipelines. Whether you encounter an outage, errors in your pipeline logic, or unexpected upstream data, dataset rollback provides a fast, reliable way to revert your datasets to a stable state. In addition, you can now queue snapshots, allowing datasets to snapshot automatically on their next build.
Dataset rollbacks provide several key benefits:
- Quickly revert to an earlier version of your dataset.
- Preserve incremental build workflows.
- Recover from data issues or outages.
Roll back a dataset
To get started with dataset rollback, open your dataset in Data Lineage and select a previous successful transaction in the History tab. You can roll back your dataset to that transaction by selecting Roll back to transaction.

The Roll back to transaction option, listed in a selected transaction's Overview tab.
Snapshot on next build
To queue a snapshot on your dataset's next build, open a dataset in Data Lineage and select Force snapshot In the History tab in the bottom panel.
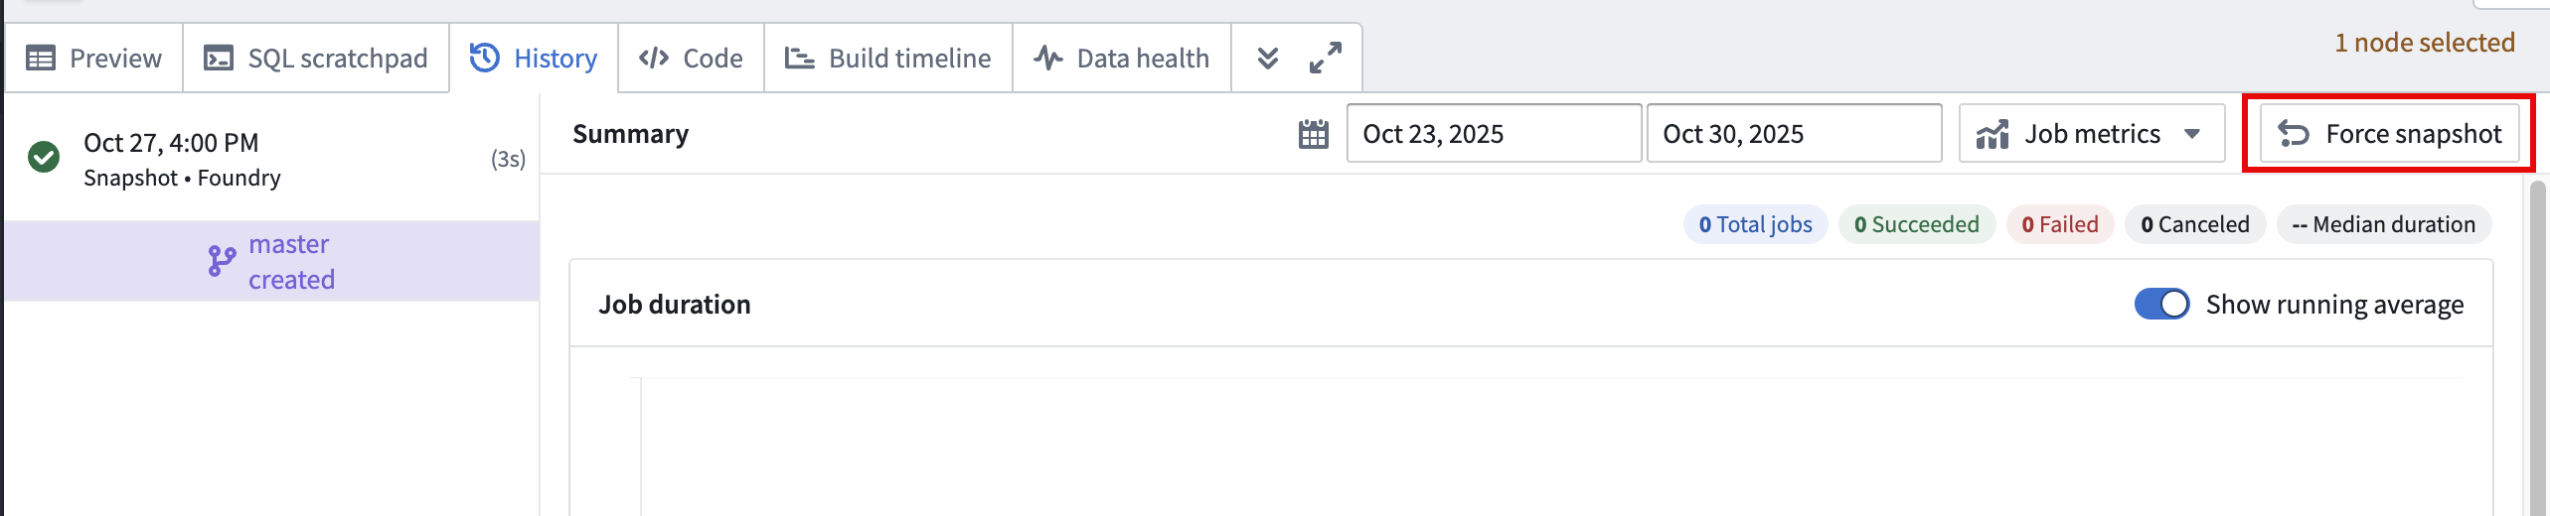
The Force snapshot option in the History tab.
Note that you will need to acknowledge that this action cannot be undone before proceeding.
Important considerations
- Only users with the
Editorrole can perform rollbacks to ensure secure operations. - Rollbacks are only supported on transactional datasets, and you can only roll back to successful transactions.
- It is not possible to roll back to a transaction that was deleted based on a retention policy. However, you can roll back to a transaction that was deleted by a dataset rollback in Data Lineage.
- If your dataset backs an object type in object storage v2, you will need to reindex after rolling back.
Dataset rollback allows you to build, experiment, and iterate on your pipelines with confidence; the ability to revert to a stable state is available whenever you need it.
Your feedback matters
We want to hear about your experience and welcome your feedback as we develop more features in Data Lineage. Share your thoughts with Palantir Support channels or on our Developer Community ↗ using the data-lineage tag ↗.
Learn more about dataset rollback.
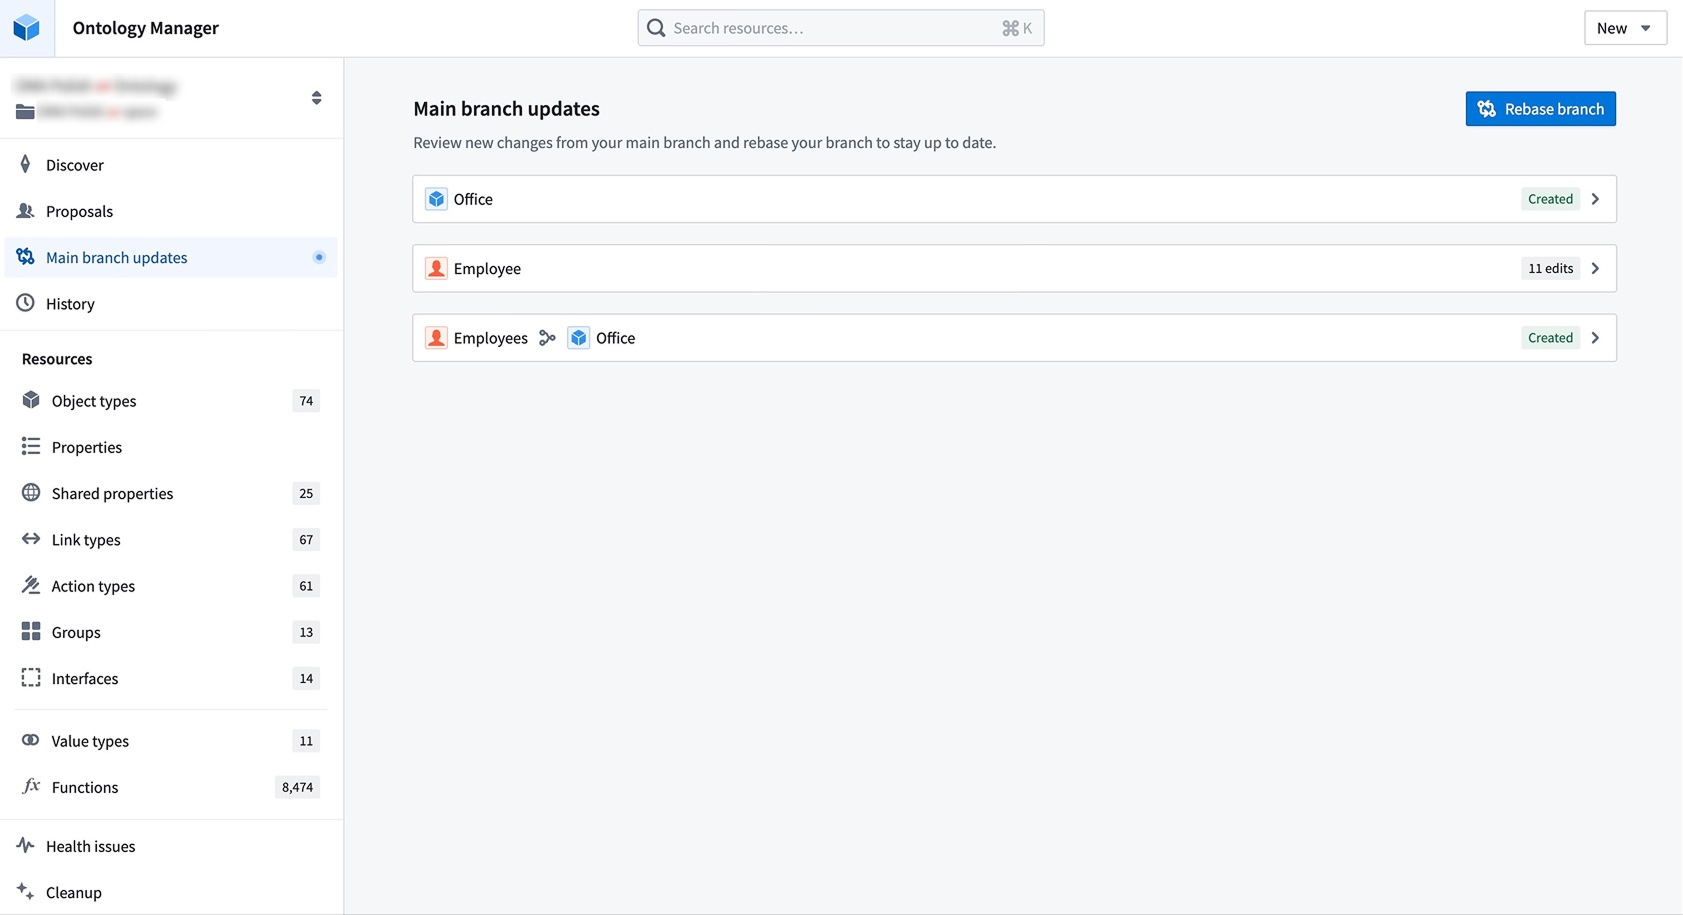
Flexible rebasing and conflict resolution in Ontology Manager
Date published: 2025-11-04
Ontology Manager now offers an improved rebasing and conflict resolution experience that gives you greater flexibility and control when managing branch changes. You can now rebase at any point without creating a proposal, view changes from both Main and your branch simultaneously, and resolve merge conflicts using multiple approaches—either through the Conflicts tab in the Save dialog or directly in the Ontology Manager interface for conflict resolution. This enhanced workflow prevents situations where unresolvable errors block your progress. This feature is available the week of November 3 across all enrollments.
Visit the documentation on testing changes in the ontology.
What is rebasing?
While you introduce changes on your branch, Main can also update with new changes made by others. Rebasing incorporates the latest changes from Main into your current branch to keep it up to date.
Resolve merge conflicts by choosing between changes from Main or your current branch directly in Ontology Manager.
During a rebase, Ontology Manager enters a new state where you can view and access changes from both Main and your branch. You may resolve merge conflicts by choosing between changes from Main or your current branch from the Conflicts tab in the save dialog. Alternatively, you can resolve conflicts by editing the ontology resource directly. This flexibility prevents situations where users become stuck due to unresolvable errors after conflict resolution.
Known limitations
Complex cases of schema migrations or datasource replacements are not yet handled by this rebasing experience. Refer to the known limitations section of the documentation for an alternative solution. We are actively working to resolve these limitations.
We want to hear from you
As we continue to develop new features for Foundry Branching, we want to hear about your experiences and welcome your feedback. Share your thoughts with Palantir Support channels or our Developer Community ↗ and use the foundry-branching ↗ tag.
Package widget sets automatically with Marketplace products
Date published: 2025-11-04
Widget sets created in Custom Widgets can now be included as content in Marketplace products.
When you add a Workshop module that uses a widget set to a Marketplace product, the widget set is automatically packaged. Widget sets can also be manually packaged independently, allowing you to build Workshop modules on top of them.
If a widget set had Ontology API access enabled in the source environment, it will be installed with access disabled by default. After installation, you must manually enable Ontology API access on the widget set if needed.
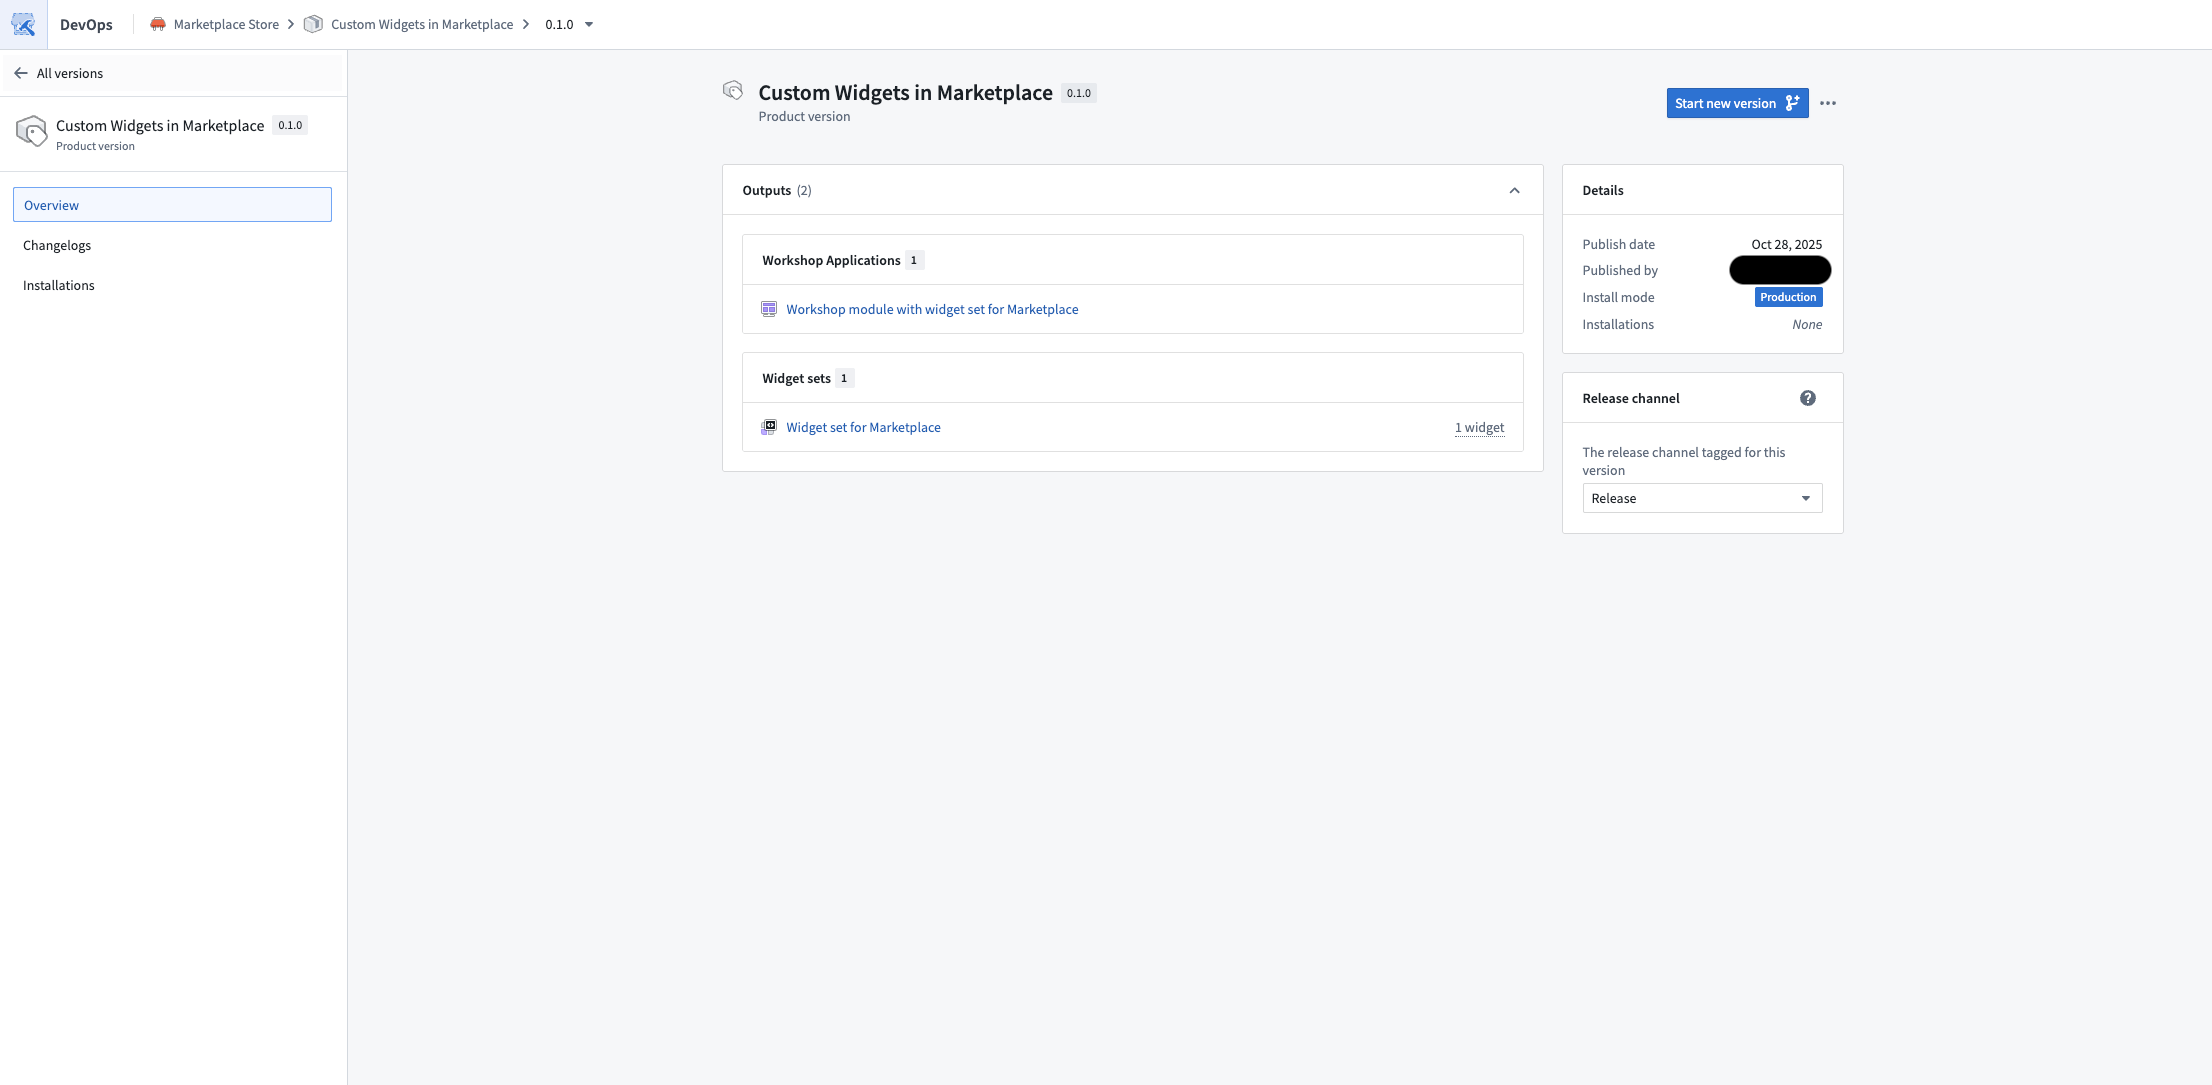
Published Marketplace product containing a Workshop module that uses a widget set.
We want to hear from you
As we continue to develop new features for custom widgets, we want to hear about your experiences and welcome your feedback. Share your thoughts with Palantir Support channels or our Developer Community ↗ and use the custom-widgets ↗ tag.
中文翻译
公告
提醒: 订阅 Foundry 新闻通讯(Newsletter),即可直接在收件箱中接收关于新产品、功能及平台改进的摘要。有关订阅方式的更多信息,请参阅 Foundry 新闻通讯与产品反馈渠道公告。
欢迎在我们的开发者社区论坛 ↗分享您对这些公告的看法。
面向美国地理限制注册用户推出 Direct OpenAI 模型系列
发布日期:2025-11-25
除无地理限制注册用户外,美国地理限制注册用户现也可在 AIP 中启用 Direct OpenAI 作为模型系列。该模型系列与 Microsoft Azure 模型系列相互独立,尽管提供的模型通常看起来相同。为注册用户启用 Direct OpenAI 可带来以下关键优势:
- 更高的容量: 启用 Direct OpenAI 后,您的注册用户将获得额外的模型容量。
- 更快的模型访问: 通过 Direct OpenAI,新的 OpenAI 模型将更快地在 AIP 中可用,从而减少使用新模型的延迟。
如何启用
要启用这些模型,注册管理员必须在控制面板(Control Panel)中启用 Direct OpenAI。
使用限制
直接由 OpenAI(而非通过 Azure)提供的 OpenAI 模型,包括 GPT-4o。这些模型的使用必须符合 OpenAI 使用政策 ↗ 和 OpenAI 共享与发布政策 ↗。
您的反馈至关重要
我们期待了解您在 Palantir 平台使用语言模型的体验,并欢迎您的反馈。请通过 Palantir 支持渠道或我们的开发者社区 ↗(使用 language-model-service 标签 ↗)分享您的想法。
在代码工作区(Code Workspaces)中直接操作 Snowflake 表
发布日期:2025-11-20
您现在可以将 Snowflake 表作为虚拟表(virtual tables)导入 JupyterLab® 代码工作区,从而无需移动数据即可处理存储在 Foundry 外部的大规模数据。
新增功能
代码工作区(Code Workspaces)现在支持对 Snowflake 表进行读写操作,包括在 Polaris 中编目的 Iceberg 表。Iceberg 表是开源表格式,能够可靠、可扩展且高效地管理大型数据集,包括存储在 Snowflake 中的外部表。
数据面板中高亮显示的代码片段。
为何重要
此功能允许您直接针对 Snowflake 中编目的数据运行交互式 Python 笔记本,支持数据科学、分析和机器学习工作流,而无需将数据复制到 Foundry。通过就地处理数据,您可以利用 Snowflake 的存储和编目功能,同时使用 Foundry 的开发环境。
了解更多关于虚拟表(virtual tables)和代码工作区(Code Workspaces)的信息。
Jupyter®、JupyterLab® 及 Jupyter® 标识是 NumFOCUS 的商标或注册商标。
所有引用的第三方商标(包括标识和图标)均归其各自所有者所有。不暗示任何关联或认可。
通过 learn.palantir.com 上的新培训课程提升您的 Foundry 和 AIP 技能
发布日期:2025-11-20
learn.palantir.com ↗ 现提供三门新培训课程,帮助您提升 Foundry 和 AIP 技能。这些课程专注于使用我们的 AIP 应用程序和功能在 Foundry 中构建工作流和界定用例范围,旨在帮助您更熟悉实际解决方案和行业特定流程。
Foundry & AIP Aware 课程
全新的 Foundry & AIP Aware 课程 ↗ 将 Learn 网站上的各种课程整合在一起,为有兴趣进行以下操作的用户提供沉浸式实践体验:
- 在 Foundry 和 AIP 上进行构建
- 界定用例范围
- 在企业 IT 环境中定位 Foundry 和 AIP
预计将从理论和基础知识开始,逐步发展到在每个模块结束时构建功能性的实际解决方案。完成此课程后,所有参与者将有资格参加(免费的)Foundry Aware 认证考试 ↗。成功通过此考试是在获得更多实际经验或寻求学徒机会之前的重要一步。
这门综合性课程预计耗时约八小时,技术和非技术用户均可学习。
速通课程(Speedrun courses)
以下两门新的速通课程也已上线:
- 速通:您的第一个 Agentic AIP 工作流 ↗:学习如何利用 AIP 和本体论(Ontology)实现代理工作流及 AIP-人类协作。
- 在本课程中,您将使用临床试验招募数据,解决识别符合条件患者参与临床试验的问题。您的目标是学习如何利用 Foundry 的 AI 和运营工具来简化试验招募流程。
- 课程结束时,您将拥有一个面向运营用户的功能性应用程序,该程序利用自动化 AIP 代理执行临床试验招募流程的一部分,最终实现该流程的 AI 与人类协作。
-
本课程是 AI 工程师学习路径 ↗ 的一部分。
-
速通:数据科学基础 ↗:学习如何使用 Foundry 和 AIP 进行数据科学。
- 在本课程中,您将深入分析临床研究数据,以揭示患者人口统计信息以及与药物消费相关的不良事件。该项目不仅涉及执行数据分析,还包括创建一份报告,供您的同事用于未来的数据科学计划。
- 本课程是数据科学家学习路径 ↗ 的一部分。
推出 AI 前向部署工程师(AI forward deployed engineer)
发布日期:2025-11-18
AI FDE(AI 前向部署工程师)将于 11 月 17 日那周面向已启用 AIP 的注册用户提供测试版(beta)。AI FDE 允许您使用自然语言操作 Foundry,通过对话解锁 Palantir 平台的力量。AI FDE 使平台交互对所有用户(无论技术专长如何)更加直观和易用,同时保持对工具使用和数据访问的完全控制和可见性。
AI FDE 提示输入字段,可选择添加本体资源作为上下文。
主要功能
借助 AI FDE,您可以执行数据转换、管理代码仓库、构建和维护本体等。AI FDE 可通过以下功能加速您的工作:
- 上下文管理,允许您控制模型可以访问哪些信息。
- 闭环操作,通过持续反馈实现复杂的多步骤工作流。
- 完全尊重现有用户权限,确保适当的治理和安全性。
- 透明的工具使用,对所有执行的操作具有完全可见性。
- 对 Anthropic、OpenAI、Google Gemini 和 xAI 模型的一流支持,并配备原生工具 API。
开始使用
要开始使用 AI FDE,请确保您的注册用户已启用 AIP。为获得最佳体验,还应启用 Foundry 分支(Branching)以支持本体编辑。启用后,您可以通过提供自然语言请求开始与 AI FDE 交互。您可以通过共享资源或文档来扩展代理的上下文,并根据给定任务启用相关工具。
AI FDE 工具选择菜单,允许用户选择 AI FDE 可以访问的工具。
配置上下文和工具后,您可以使用 AI FDE 在 Foundry 中执行以下操作:
- 编写转换(transforms)并构建数据集以进行数据集成。
- 创建和修改对象类型(object types)、链接类型(link types)、操作类型(action types)和接口(interfaces)以进行本体开发。
- 编写、预览和发布函数(functions)。
- 利用分支在所有工作流中实现安全、可审查的更改。
通过为数据集成、本体开发和函数创建启用自然语言命令,AI FDE 可以改变您使用 Foundry 的方式,同时保持安全性并提供对每个操作的完全可见性。
我们期待您的反馈
在我们继续开发 AI FDE 的过程中,我们期待了解您的体验并欢迎您的反馈。请通过 Palantir 支持渠道或我们的开发者社区 ↗分享您的想法。
注意:AIP 功能的可用性可能会发生变化,并且可能因客户而异。
AIP Analyst:直观的基于聊天的本体探索
发布日期:2025-11-18
AIP Analyst 是一款新的数据分析应用程序,将于 11 月 17 日那周面向已启用 AIP 的用户推出测试版(beta)。AIP Analyst 使用本体中的数据,通过基于聊天的界面回答问题,提供以本体为先的体验,使技术和非技术用户都能遍历本体数据并生成洞察。借助 AIP Analyst,您可以提出问题、可视化结果,并以完全透明的方式理解分析的每一步。
AIP Analyst 可访问不断增长的工具列表,包括:
- 搜索和理解您的本体。
- 使用搜索环绕(saerch-arounds)和语义搜索(semantic search)过滤对象集(object sets)。
- 使用分组(group-by)和指标(metrics)执行聚合。
- 针对对象集或数据集编写 SQL 查询。
- 使用 Vega 图表创建可视化。
AIP Analyst 强调透明度和控制;您可以审查分析的每一步,验证逻辑,在需要时进行手动调整,并在交互式图形视图中查看分析谱系(lineage)。
完全透明的智能分析
AIP Analyst 会展示其工作过程。每次分析都会创建一个交互式依赖关系图,显示从问题到答案的流程。用户可以准确看到代理如何推理他们的请求,检查中间结果,并手动调整步骤。
AIP Analyst 正在回答问题,图表选项卡已展开。
灵活的探索
通过分叉(fork)聊天的功能,用户可以从共同的起点分支探索。AIP Analyst 可以访问用户有权访问的每个对象类型,也可以锁定到特定的本体和对象类型组以进行更有针对性的探索。
AIP Analyst 设置(Settings) 菜单,包含本体和对象类型组选项。
高水平的用户控制
除了文本聊天,AIP Analyst 还支持以下功能:
- 手动模式(Manual mode)(
Shift+tab)允许用户在分析的每一步指导代理。 - 记事本集成(Notepad integration) 允许用户将常用指令和上下文作为记事本文档提供。
- 直接导入(Direct imports) 来自对象类型、对象集、数据集、函数和 Workshop 模块,用于针对性分析。
AIP Analyst 输入字段中的选项。
AIP Analyst 通过结合对话式 AI 的强大功能、强大的用户控制和透明的工作流,重新定义了本体探索。凭借其不断增长的工具套件和对透明度的承诺,AIP Analyst 是任何希望从其本体数据中获得更深入洞察的人必不可少的工具。
您的反馈至关重要
我们期待了解您使用 AIP Analyst 的体验并欢迎您的反馈。请通过 Palantir 支持渠道或我们的开发者社区 ↗分享您的想法。
注意:AIP 功能的可用性可能会发生变化,并且可能因客户而异。
使用 AIP Evals 结果分析器自动诊断失败并改进提示词
发布日期:2025-11-18
AIP Evals 现在配备了一个结果分析器(results analyzer),使您能够快速了解测试失败的原因以及如何修复它们。以前,在迭代 AI 函数时,从结果表中的失败测试用例转向清晰、可操作的后续步骤是一个冗长的手动过程。结果分析器通过自动将失败聚类到根本原因类别中,并在有帮助的地方提出有针对性的提示词更改来解决这个问题。
什么是分析器?
AIP Evals 结果分析器是结果视图(Results view)上的一个内置 AI 副驾驶(copilot),它能够:
- 分析单次运行的失败测试用例,并生成类似根本原因分析(RCA)风格的汇总摘要。
- 对失败进行分类和分组,包括名称、描述、代表性示例以及所有受影响的测试用例列表。
- 在更改可能改善结果时,建议具体的提示词编辑。
AIP Evals 应用程序中结果分析器的视图。
利用结果分析器
结果分析器已被用于发现重大的 AI 故障模式和优化机会,并且可以与 AIP Logic 函数一起使用。对作为函数发布的代理(agents published as functions)和对象上的函数(functions on objects)的支持将在未来版本中包含。
一些示例用例包括:
- 更快的诊断:从原始失败直接跳转到简洁、结构化的根本原因类别和顶层摘要。
- 可操作的改进:对于每个类别,获取单一、具体的提示词修改,并一键复制更改。
- 上下文感知:结果分析器包含您的函数定义、评估器设置以及提示词和响应的轻量级调试跟踪,以支持其推理。
- 专为 Evals 工作流构建:选择任何类别的测试用例标签以将表格过滤到恰好受影响的案例,并进行更深入的分析。
开始使用
要开始使用 AIP Evals 结果分析器,请参阅文档以查看先决条件设置步骤。设置完成后,您可以从 AIP Logic 侧边栏或 AIP Evals 应用程序中选择一个包含失败测试用例的单个评估套件运行,然后生成分析。之后,您可以:
- 查看概览(Overview)和每个类别选项卡。您可以过滤表格以查找受影响的案例。
- 审查建议的提示词改进。复制更改并在适当时更新您的 Logic 提示词。
- 重新运行您的评估或实验(Experiment)以验证改进。
您的反馈至关重要
在我们继续开发新的 AIP Evals 功能和改进时,我们期待了解您的体验并欢迎您的反馈。请通过 Palantir 支持渠道或我们的开发者社区 ↗(使用 aip-evals 标签 ↗)分享您的想法。
GPT-4.1 现已在启用 Azure OpenAI 的 IL2、IL4 和 IL5 注册用户中可用
发布日期:2025-11-18
GPT-4.1 现已在 IL2、IL4、IL5 注册用户中通过 Azure OpenAI 提供。
模型概述
GPT-4.1 是 GPT-4o 的改进版本,在某些用例中是 Claude 3.7 Sonnet 的替代方案,并在编码、指令遵循和长上下文对话方面表现出色。GPT-4.1 与 OpenAI 系列中其他模型的比较可在 OpenAI 文档 ↗ 中找到。
- 工具调用(Tool calling)
- 结构化输出(Structured outputs)
- 1M 令牌上下文窗口
- 知识截止日期为 2024 年 6 月
开始使用
要使用这些模型:
- 确认您的注册管理员已启用相关模型系列
- 查看令牌成本和定价
- 查看 AIP 中所有可用模型的完整列表
您的反馈至关重要
我们期待了解您在 Palantir 平台使用语言模型的体验并欢迎您的反馈。请通过 Palantir 支持渠道或我们的开发者社区 ↗(使用 language-model-service 标签 ↗)分享您的想法。
网络出站日志和指标现已在构建日志(Build logs)和控制面板(Control Panel)中提供
发布日期:2025-11-18
Palantir 平台现在提供网络日志和新的指标,以帮助您调试以前难以解决的网络问题。此功能目前处于测试版(beta)阶段,适用于在 Palantir 基于 Kubernetes 的基础设施 Rubix 上运行的注册用户。
构建日志(Build logs)中的新功能?
构建日志现在包含网络出站日志。从构建页面访问网络出站日志,方法是选择日志(Logs),然后应用建议的网络出站日志(Network egress logs)过滤器。要了解这些日志包含的内容以及如何解释它们,您可以查阅文档。
选择网络出站日志过滤器以查看日志。
控制面板中的网络出站策略现在按源聚合这些相同的日志,以及这些策略使用情况的指标。从控制面板(Control Panel) > 网络出站(Network egress) 开始,然后选择一个策略并转到可观测性(Observability) 选项卡进行访问。
您可以在控制面板中查看网络策略的出站日志和指标。
下一步计划是什么?
- 使 DNS 查找可发现,以帮助识别源上所需的出站策略
- 通过记录来自每个中间步骤(Foundry 代理、代理代理)的所有出站结果,提供出站流的端到端可观测性
- 启用监控,以便在出站失败时向您发出警报
- 添加指标,如请求和响应大小、请求持续时间等
您的反馈至关重要
在我们继续添加数据连接(Data Connection)功能时,我们期待了解您的体验并欢迎您的反馈。请通过 Palantir 支持渠道或我们的开发者社区 ↗分享您的想法,或使用我们的 data-connection 标签 ↗ 发帖。
使用多模态媒体集(Multimodal media sets)上传多种媒体类型
发布日期:2025-11-18
多模态媒体集现已在所有 Foundry 注册用户中可用,允许您将任何格式的文件上传并存储到单个媒体集中。此功能简化了需要同时处理多种媒体类型的工作流,例如处理混合文档类型或在分析管道中组合不同文件格式。
什么是多模态媒体集?
多模态媒体集允许您在单个媒体集中处理多种类型的非结构化数据。它们非常适合处理:
- 跨越多种媒体集模式类型的文件集
- 现有媒体集模式不支持的文件格式
关键能力
- 上传和预览: 将文件上传到媒体集,并使用支持的模式类型查看媒体项目的交互式预览。不支持预览的媒体项目将呈现一个下载选项,以便在平台外预览。
不支持预览的媒体项目预览。
- Workshop 集成: 多模态媒体集已与 Workshop 完全集成,允许您直接在工作流中预览多模态媒体。
Workshop 中多模态媒体的预览。
- 代码工作区中的 Python 转换: 使用
transforms-media包在代码工作区中执行高级转换。
开发路线图上的下一步是什么?
在即将发布的版本中,我们计划通过进一步的 Pipeline Builder 集成来增强多模态媒体集。
您的反馈至关重要
我们期待了解您使用多模态媒体集的体验并欢迎您的反馈。请通过 Palantir 支持渠道或我们的开发者社区 ↗(使用 media-sets 标签 ↗)分享您的想法。
用于转换的 DuckDB Python 绑定
发布日期:2025-11-18
Transforms 已为 DuckDB ↗ 添加了 Foundry 原生 Python 绑定,DuckDB 是一个现代、高性能的单节点 SQL 执行引擎。
此集成允许用户在 Python 生态系统中编写高性能的 SQL 管道,并具有增量处理和分区输出等功能。对于许多用例,DuckDB 可以提供优于其他单节点运行时的显著优势,包括更快的执行速度和更高的内存效率。DuckDB 熟悉的 SQL 界面使其成为具有现有 SQL 经验的 Foundry 用户的绝佳选择。
DuckDB 特别适合需要低延迟和高效资源使用的中到大规模数据处理任务。与许多其他单节点计算引擎不同,DuckDB 支持资源配置以控制内存使用和并行性,从而允许针对不同工作负载进行细粒度优化。这对于内存受限的上下文尤其重要,在这些上下文中,DuckDB 可以自我限制其内存消耗以避免内存不足错误。
Transforms DuckDB 代码示例。
要了解更多信息,请参阅 DuckDB API 文档和 Foundry Python 计算引擎选项的概述。
使用流式数据集实时跟踪和分析 Foundry 日志
发布日期:2025-11-18
组织管理员现在可以将 Foundry 日志直接导出到流式数据集(streaming datasets),从而允许您在一个地方实时跟踪应用程序日志、函数执行日志等。一旦您的日志流入数据集,您就可以使用 Foundry 的转换工具对其进行分析,并构建自定义仪表板以获取实时洞察。
控制面板中的日志可观测性设置(Log observability settings) 页面,您可以在其中创建日志导出到流式数据集。
要导出日志,请导航到控制面板(Control Panel) > 日志可观测性设置(Log observability settings) > 创建日志导出(Create log export),然后选择包含所需日志的项目。指定导出位置,然后选择内部格式(Internal Format) 或开放遥测协议(OpenTelemetry Protocol, OTLP) 格式作为流式数据集的模式。
日志配置向导,显示在选择内部格式(Internal Format) 模式时流式数据集中将存在的列。
日志配置向导,显示在选择开放遥测协议(OpenTelemetry Protocol, OTLP)模式时流式数据集中将存在的列。
在我们的文档中了解更多关于将日志导出到流式数据集的信息。
我们期待您的反馈
请告诉我们您对通过控制面板导出日志的看法。请通过 Palantir 支持渠道分享您的想法,或使用 control-panel 标签 ↗ 在我们的开发者社区 ↗ 上发帖。
监控视图(Monitoring views)现已与 Marketplace 兼容
发布日期:2025-11-18
监控视图现在可以包含在 Marketplace 产品中,确保关键规则和检查与您的产品打包在一起。监控视图是数据监控规则和健康检查的集合,使得大规模监控资源更加容易。通过此更新,当您将监控视图添加到 Marketplace 产品时,该视图中定义的所有检查将自动合并,并且监控规则中指定的所有目标将作为产品输入包含在内。
此功能简化了将全面监控与产品一起交付的流程,减少了手动配置和设置的需求。当客户安装您的 Marketplace 产品时,他们将能够重新配置与监控视图关联的每个目标范围,以便监控逻辑可以适应部署产品的注册用户。即使在锁定安装中,监控视图订阅也可以在安装后配置。
在 Marketplace 产品中打包监控视图。
通过使捆绑和部署监控配置更加容易,此更新有助于确保跨不同环境的一致可观测性。用户可以受益于更无缝的体验,因为监控从一开始就集成,并且可以根据其独特环境进行定制。
告诉我们您的想法
我们期待了解您使用监控视图的体验并欢迎您的反馈。请通过 Palantir 支持渠道或我们的开发者社区 ↗分享您的想法。
在 JupyterLab® 和 RStudio® 代码工作区中使用 AIP 编写代码、分析数据和创建可视化
发布日期:2025-11-11
JupyterLab® 和 RStudio® 代码工作区现在提供了一个可从工作区侧边栏访问的 AIP 代理,允许访问任何 AIP 支持的大语言模型(LLMs),以帮助您根据特定用例在 Foundry 中开发和部署代码。此实验性(experimental)功能适用于所有已启用 AIP 的 Foundry 注册用户。
AIP 代理帮助您在 JupyterLab® 和 RStudio® 代码工作区中编写代码和生成可视化。
在工作区中打开并配置代理
要开始使用,请打开您的工作区,选择左侧边栏底部的 \</> 图标,然后在提问... 文本框中输入提示以启动代理。代理将根据其可用工具为您提供编码指导或生成完整文件。要配置代理可以访问的工具以帮助其在您的工作区中执行基本操作,请选择扳手图标以呈现所有可用的工具(Tools),并选择退出与您的用例无关的工具。代理可以通过其工具执行广泛的任务,例如编写文件、编写和运行代码片段、搜索和安装库或执行终端命令。
配置工作区中 AIP 代理可用的工具。
使用代理的设置(Settings) 菜单重命名对话线程并查看系统提示。代理在您关闭或重新启动工作区后不会保留您的聊天历史记录,因此请确保在结束会话之前同步您想要保存的任何代码或模型输出。
您可以使用代理的设置(Settings) 菜单重命名聊天线程。
您可以通过从提示文本框底部选择当前模型的名称来切换代理使用的 LLM。不同提供商之间的模型行为可能有所不同,因此您可以尝试不同的模型,以找到最适合您特定用例的方法。了解更多关于提示工程最佳实践的信息。
常见的 AIP 代理用例
您可以使用工作区的 AIP 代理来:
- 为数据分析、可视化和建模任务生成起始代码。
- 接收有关数据的编码技巧和解释。
- 自动化重复性任务,例如库安装和数据清理。
- 构建交互式 Dash 和 Streamlit 应用程序,您可以发布和共享。
下一步是什么?
我们将在其初始实验性发布期间收集反馈,并继续完善代理的功能并扩展其工具包。此外,对编写 Foundry 模型的支持将在未来几周内提供。
Jupyter®、JupyterLab® 及 Jupyter® 标识是 NumFOCUS 的商标或注册商标。RStudio® 是 Posit™ 的商标。所有引用的第三方商标(包括标识和图标)均归其各自所有者所有。不暗示任何关联或认可。
使用新的 Machinery 小部件监控和分析运营工作流
发布日期:2025-11-11
新的 Machinery 小部件是一个分析和实时监控工具,可为您配置的 Machinery 流程提供运营洞察,将于 11 月 10 日那周在所有注册用户中可用。此新功能使团队能够可视化流程流、跟踪关键指标并识别性能问题,而无需在现有 Machinery 设置之外进行额外配置。
新的 Machinery 小部件概览。
新的 Machinery 小部件原生支持多流程图,允许您跨多对象类型流程实现跟踪指标。该小部件可在 Workshop 模块中使用,也可作为 Machinery 应用程序中的独立视图使用(功能有限)。
自动子流程推导和可定制的指标视图
通过使用从父流程的搜索环绕自动推导子流程对象集,简化了配置。这意味着您只需要为每个根流程配置一个对象输入。如果您有一个应用程序流程,其中包含许多链接的审查子流程,您可以提供 100 个应用程序对象,所有相关的子对象将通过配置的链接类型自动识别。
四个指标视图已预先配置,并且可以由应用程序构建者自定义;历史计数、当前计数、历史持续时间和当前持续时间。应用程序构建者还可以添加自定义指标视图以满足特定的分析需求。用户可以在这些视图之间切换,将鼠标悬停在节点上以显示所有可用指标,并固定特定节点以在图形可视化中进行持续监控。
新的 Machinery 小部件使用上下文缩放优化空间使用。缩小时,它将显示许多图形元素,但只显示一个指标。放大时,节点会显示更多信息,指标卡会显示最多三个可用指标。
上下文缩放显示更多信息和指标。
路径探索器和持续时间分布以获得更深入的洞察
两种分析模式支持超越可视化的流程调查。路径探索器(Path explorer)分析单个流程路径及其频率分布,允许您选择特定路径来过滤输出并准确了解对象如何流经您的工作流。
使用路径探索器模式分析单个流程路径及其频率分布。
持续时间分布(Duration distribution)通过可视化所有对象在选定状态下花费的时间来识别性能异常值。这允许隔离具有不良行为的单个桶或对象范围,例如在特定转换或状态中花费过多时间。两种分析模式都会动态更新输出对象集,从而能够迭代调查流程性能问题。
![使用持续时间分布模式,通过可视化选定对象在各状态下花费的时间来识别异常值。](/docs/resources/foundry/announcements/release-notes/2025-11-11-163658-machinery-widget-duration-dist