Announcements(公告)
REMINDER: Sign up for the Foundry Newsletter to receive a summary of new products, features, and improvements across the platform directly to your inbox. For more information on how to subscribe, see the Foundry Newsletter and Product Feedback channels announcement.
Share your thoughts about these announcements in our Developer Community Forum ↗.
AIP Analyst is generally available
Date published: 2026-03-31
AIP Analyst will be generally available the week of April 13, 2026 for users with AIP enabled. AIP Analyst is a conversational AI interface for exploring your ontology that enables both technical and non-technical users to explore and generate insights from ontology data. With AIP Analyst, you can ask questions, visualize results, and understand every step of your analysis with complete transparency.
Key features
AIP Analyst can use a wide range of tools to traverse and investigate your ontology data:
- Searching and understanding your ontology.
- Filtering object sets with search-arounds and semantic search.
- Performing group-by aggregations for segmentation, analysis, and reporting.
- Writing SQL queries against object sets and datasets.
- Creating visualizations with Vega charts and Maps.
- Executing Foundry actions and functions directly within conversations.
- Analyzing manually added files such as images, PDFs, and spreadsheets.
AIP Analyst was designed to provide users with transparency and control. You can review each step of an analysis, validate logic, make manual adjustments when needed, and view the analysis lineage in an interactive graph view.
Example use case
For example, an operations manager can ask AIP Analyst "what equipment in my facility requires attention?" - to answer this question, AIP Analyst will automatically traverse the ontology, following relationships across relevant objects (such as inspection logs and maintenance records) to generate a prioritized summary of items needing action.
In the process of exploring ontology data, AIP Analyst can also reveal and surface data quality issues, such as outdated records. This helps teams identify gaps without needing to wait for perfectly clean data before starting. From there, AIP Analyst can help formulate a plan to improve the ontology, which AI FDE can then execute.
Intelligent analysis with full transparency
AIP Analyst "shows its work" when responding to your questions in order to provide you with full transparency.
- Every analysis creates an interactive dependency graph showing the flow from question to answer.
- Users can see exactly how the agent reasoned through their request, inspect intermediate results, and manually adjust steps.
- Final summary messages include inline citations linked to the specific tool results that informed each part of the response, and these cited summaries appear directly in the analysis graph.
- Code blocks within summaries can also be copied independently.
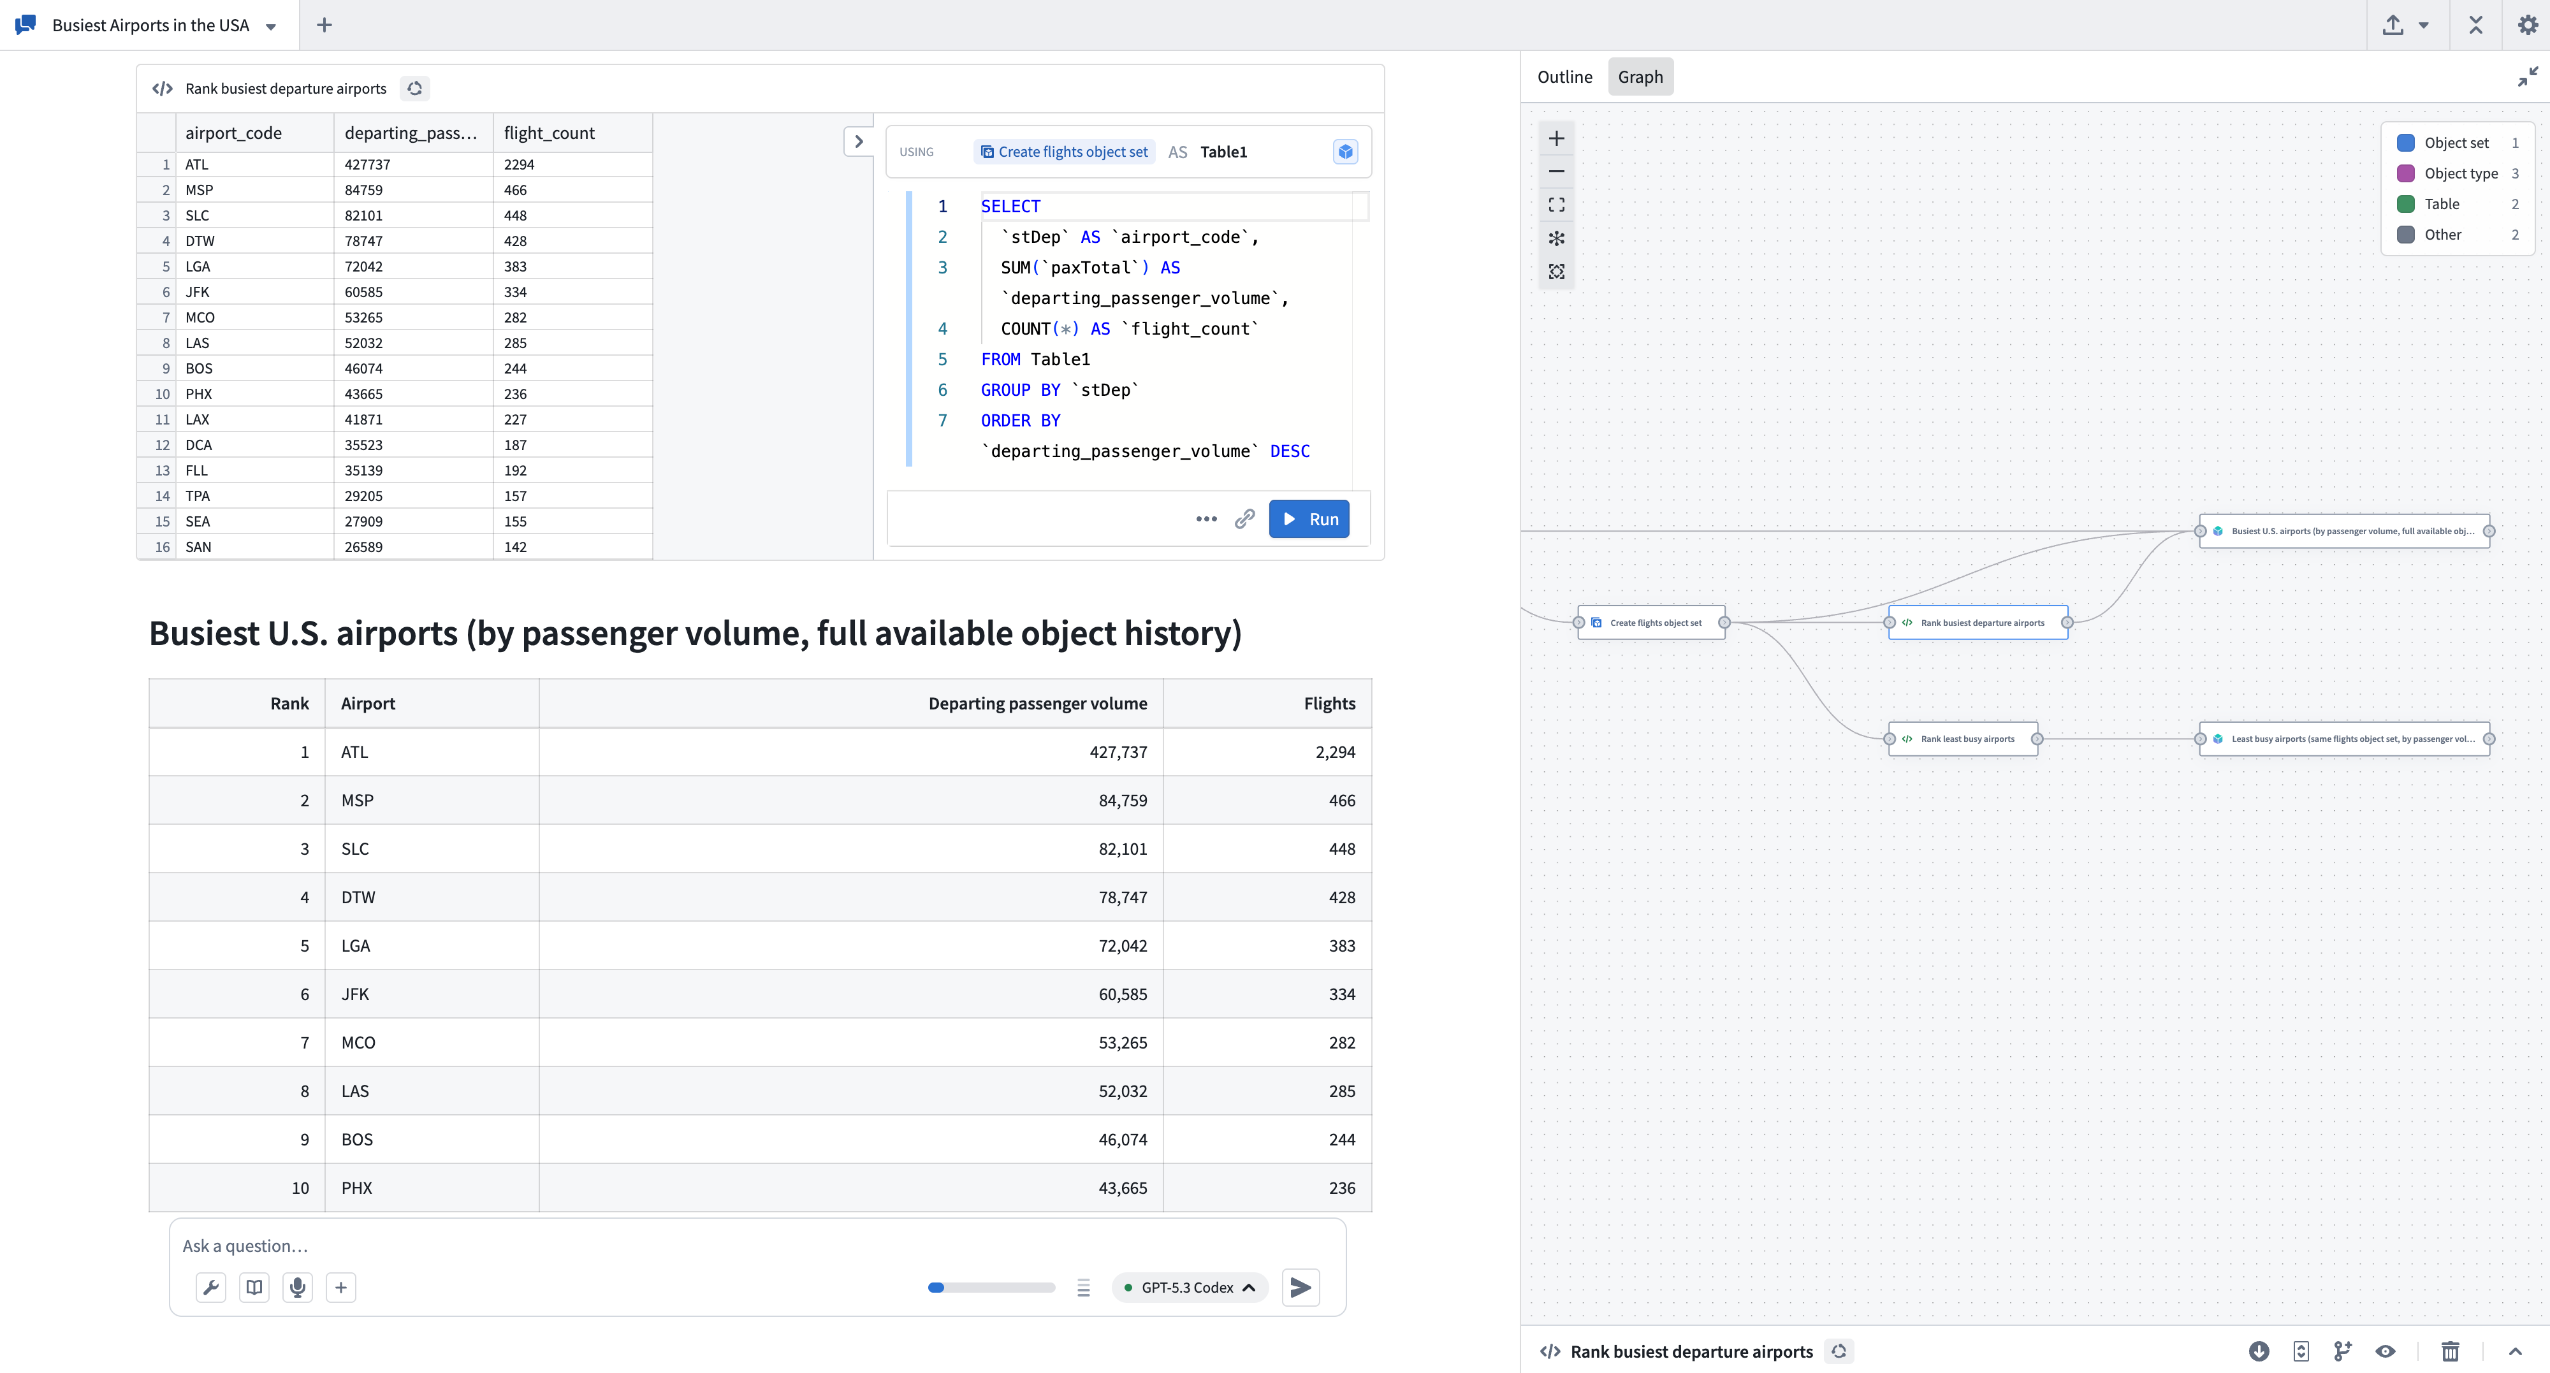
The example above shows AIP Analyst exploring data about airports to understand which airports are busiest.
Workshop integration
AIP Analyst can be embedded as a Workshop widget to provide AI-powered analysis capabilities directly in Workshop modules. The Workshop widget supports triggering actions on message send for logging and tracking user interactions, persists conversation state when users switch tabs or close sections, and offers extensive configuration options to control data access, tool availability, and user interface customization.
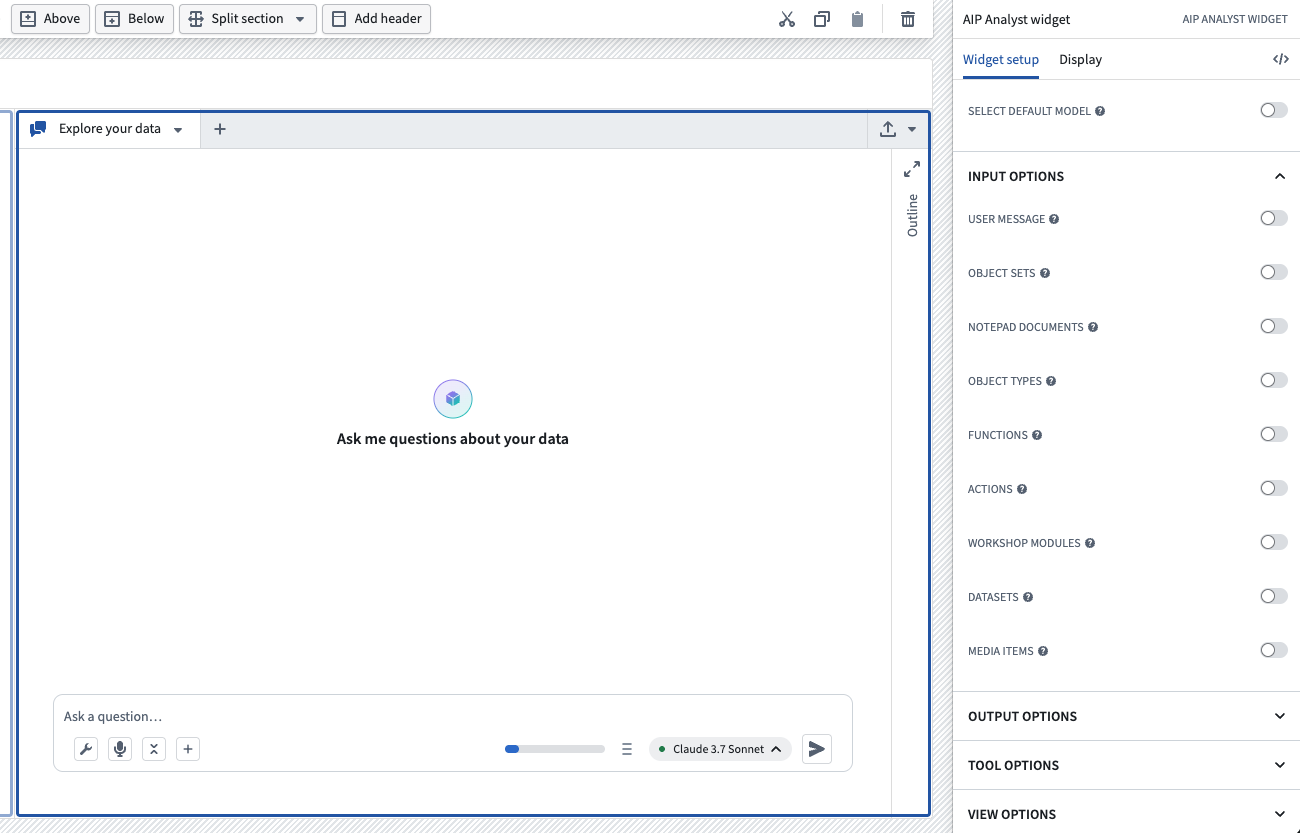
Interface for setting up the AIP Analyst Workshop widget.
Requirements
To use AIP Analyst, ensure that AIP is enabled on your enrollment. Once enabled, you can access AIP Analyst at /workspace/aip-analyst to begin asking questions about your ontology.
Learn more about AIP Analyst in our documentation.
Your feedback matters
We want to hear about your experience with AIP Analyst and welcome your feedback. Share your thoughts with Palantir Support channels or using the #aip-analyst tag in our Developer Community ↗.
Comment on nodes in proposal in Pipeline Builder
Date published: 2026-03-31
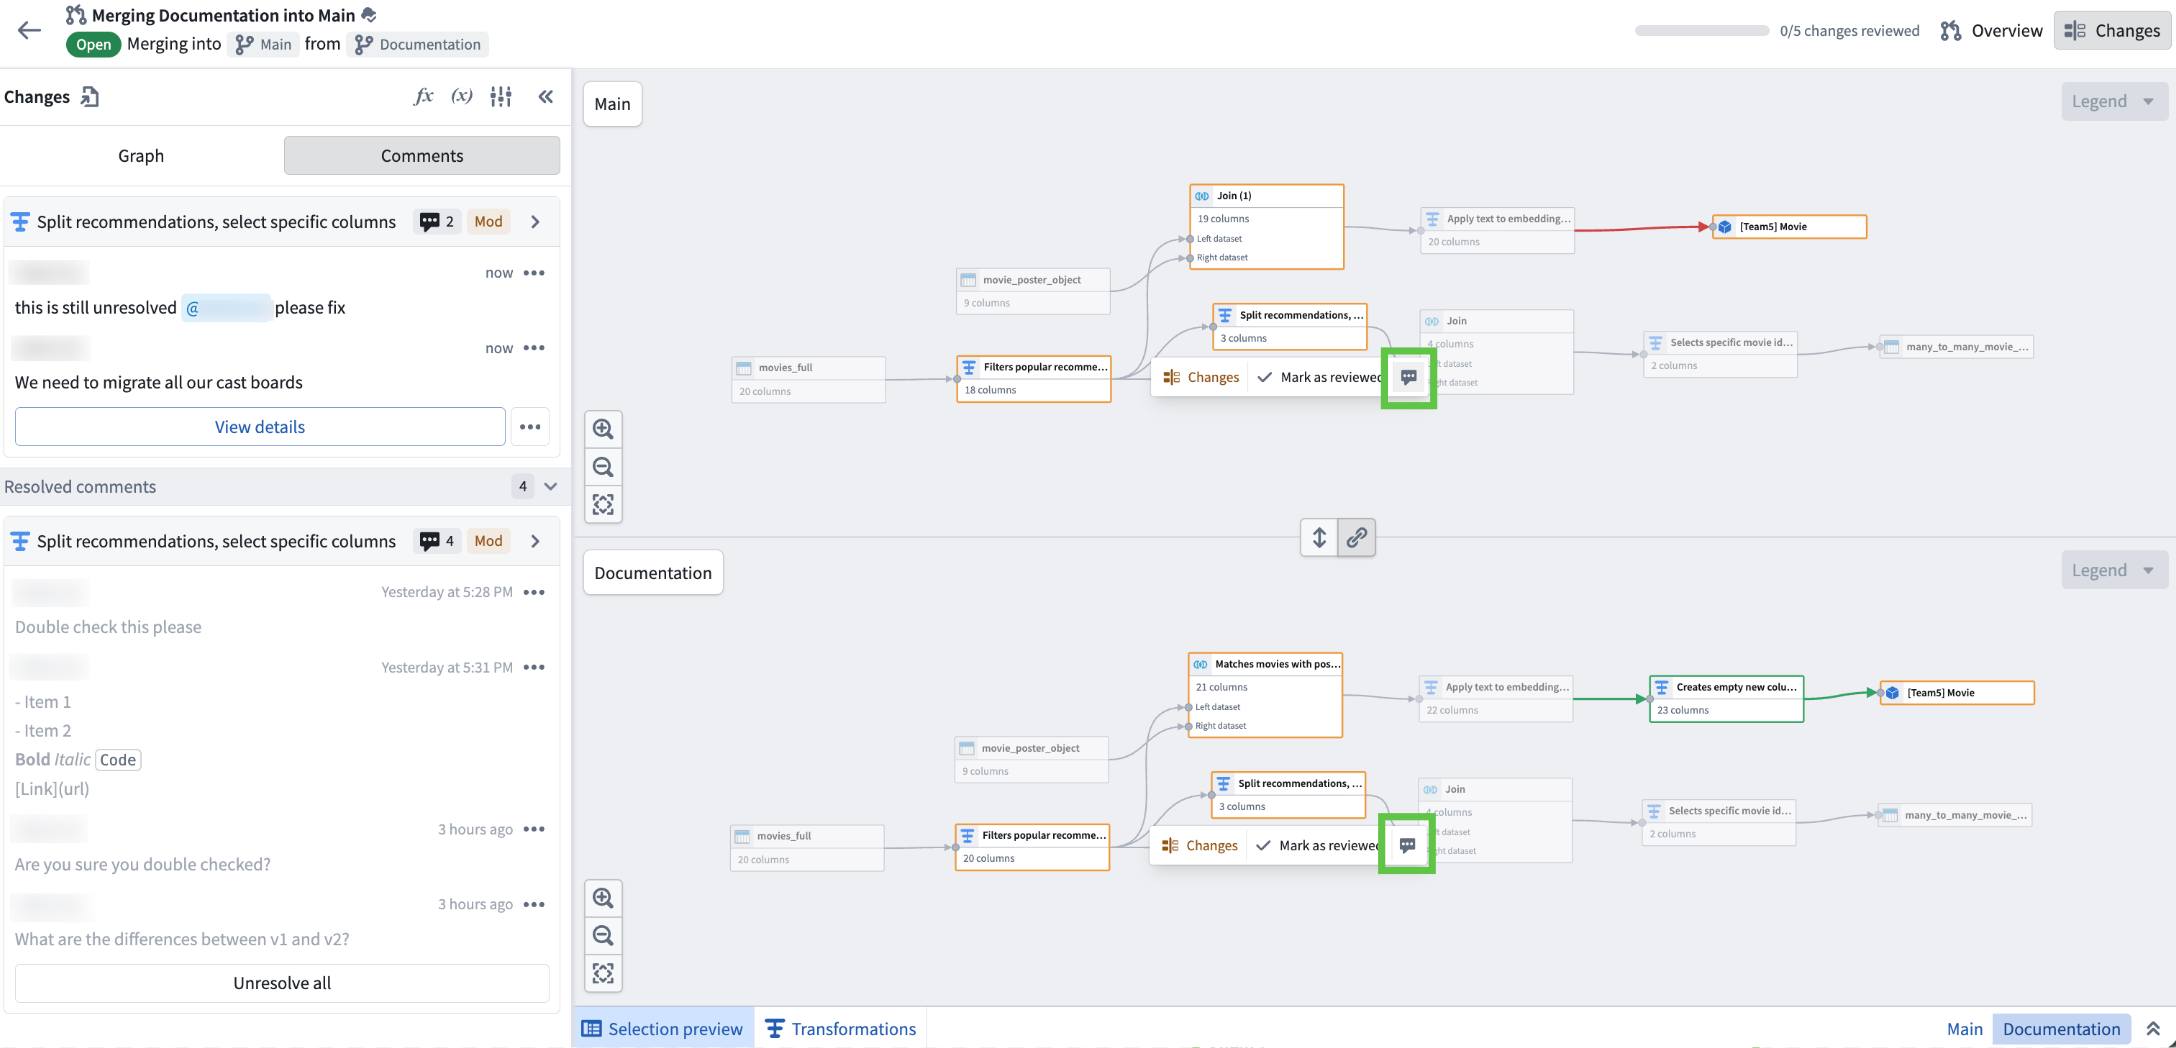
You can now comment directly on individual nodes within your proposals in Pipeline Builder. Previously, comments were limited to the pipeline level.
Available across all enrollments, node-level commenting lets you:
- Add, view, and manage comments at the node level: Target your feedback, ask questions, or flag issues exactly where they matter—right on the relevant node.
- Resolve and unresolve comments: Mark feedback as addressed, or reopen discussions as needed. Toggle the visibility of resolved comments from the Comments panel to focus on active discussions.
- Tag teammates with @mentions: Bring the right people into the conversation, exactly where their input is needed.
- Use rich formatting: All node comments support Markdown: add bold, italics, links, and
code blocksfor clearer communication.
Learn more from the Comments documentation.
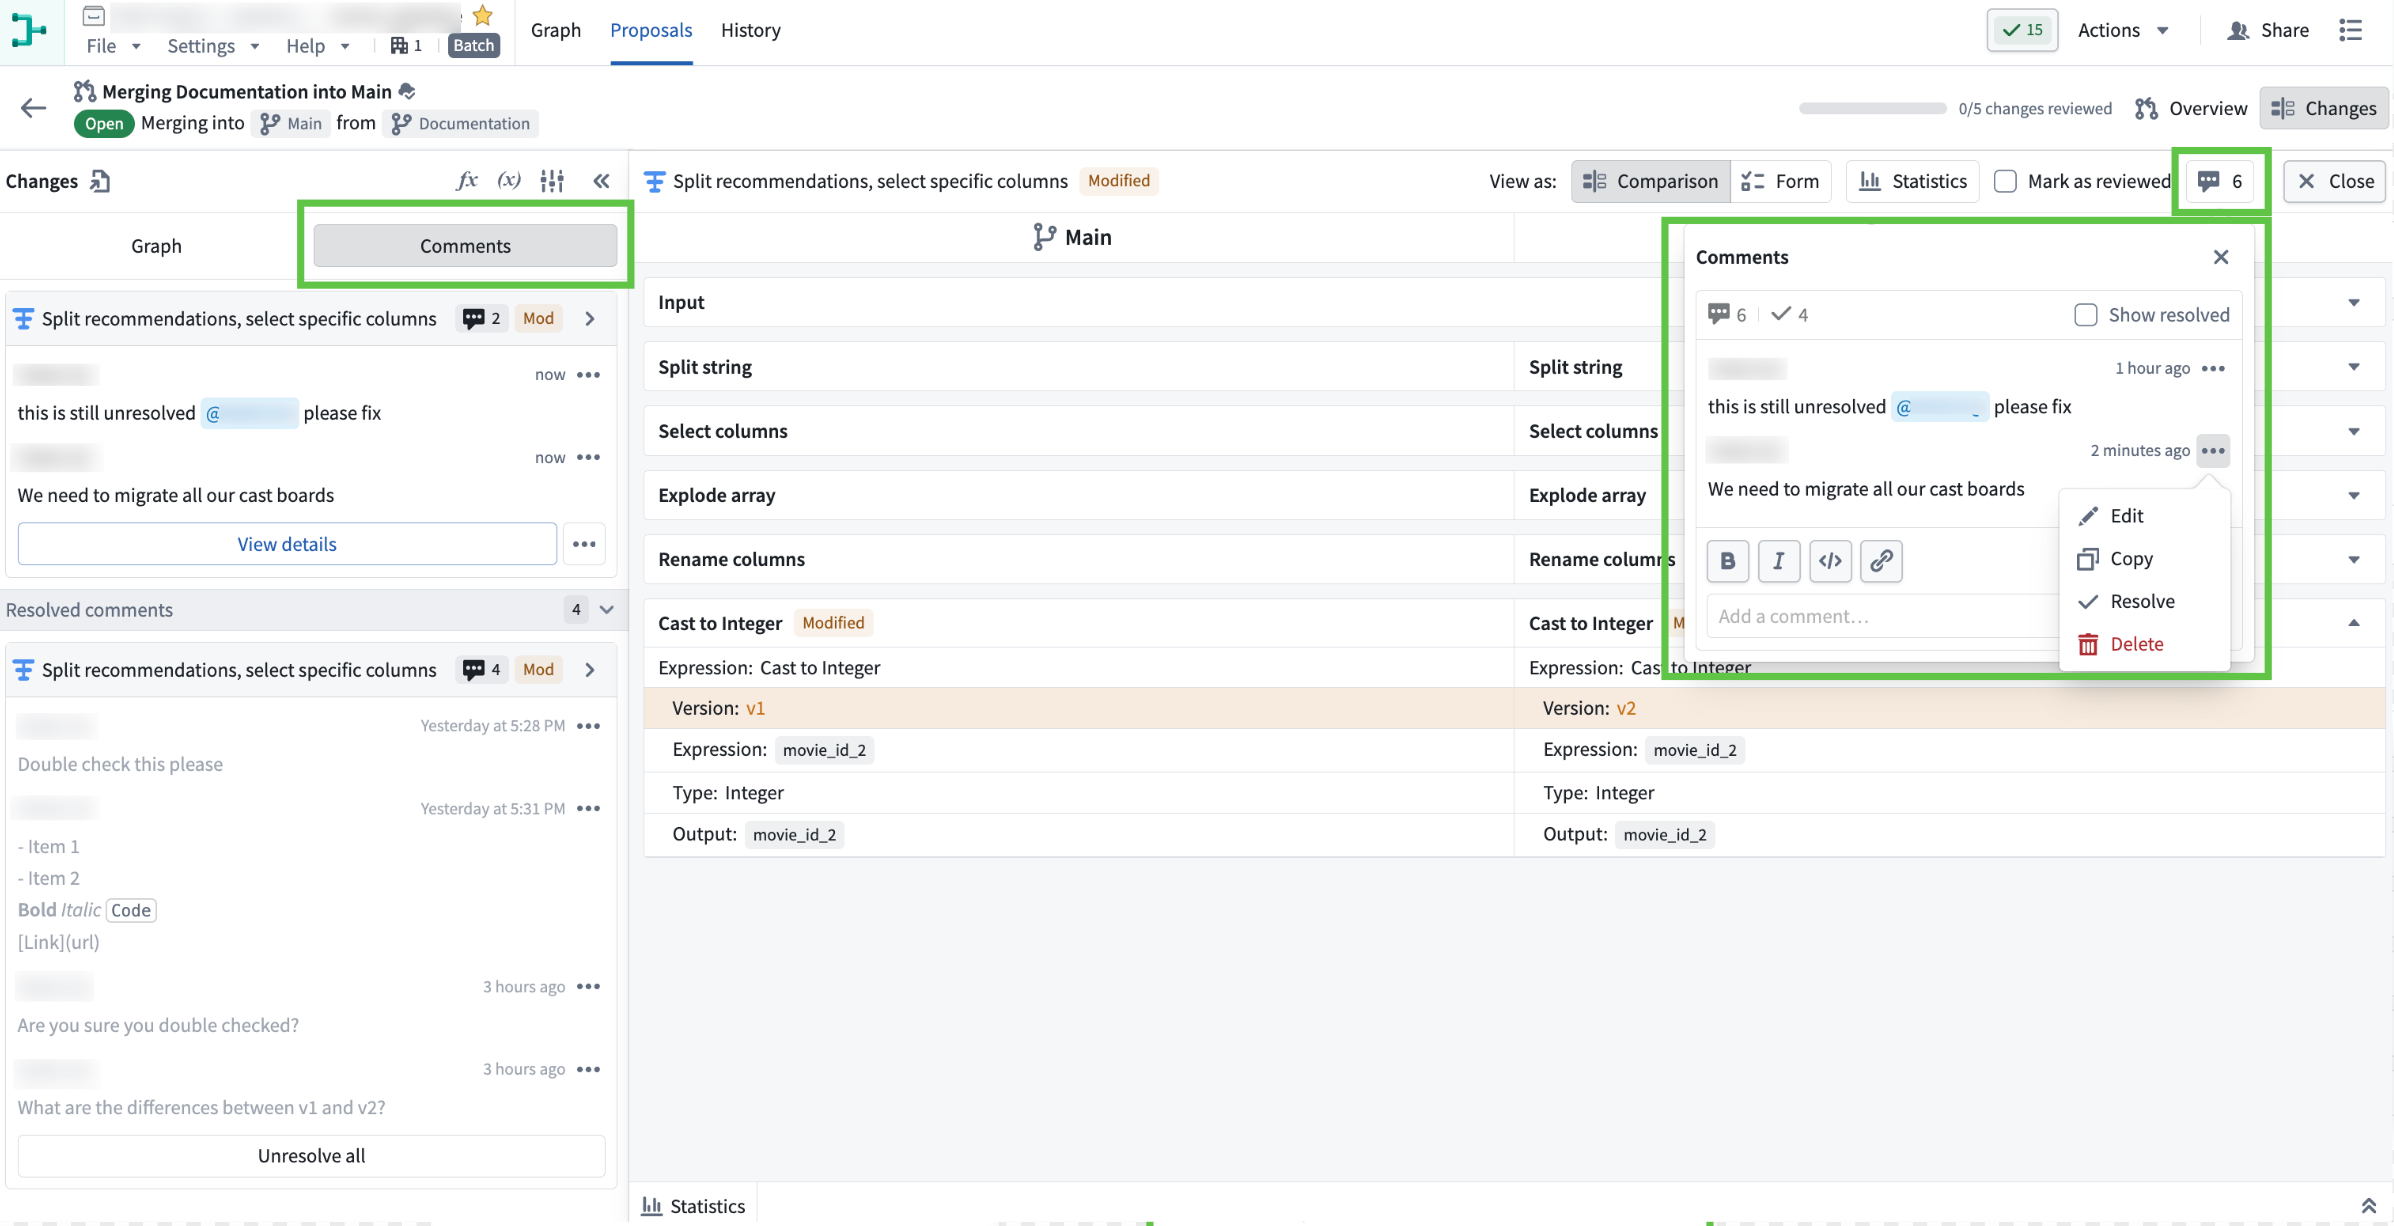
The "Comments" tab within the "Changes" section of the proposal view. The left panel displays all comments related to the proposal, while the right window shows the comment on a specific node.
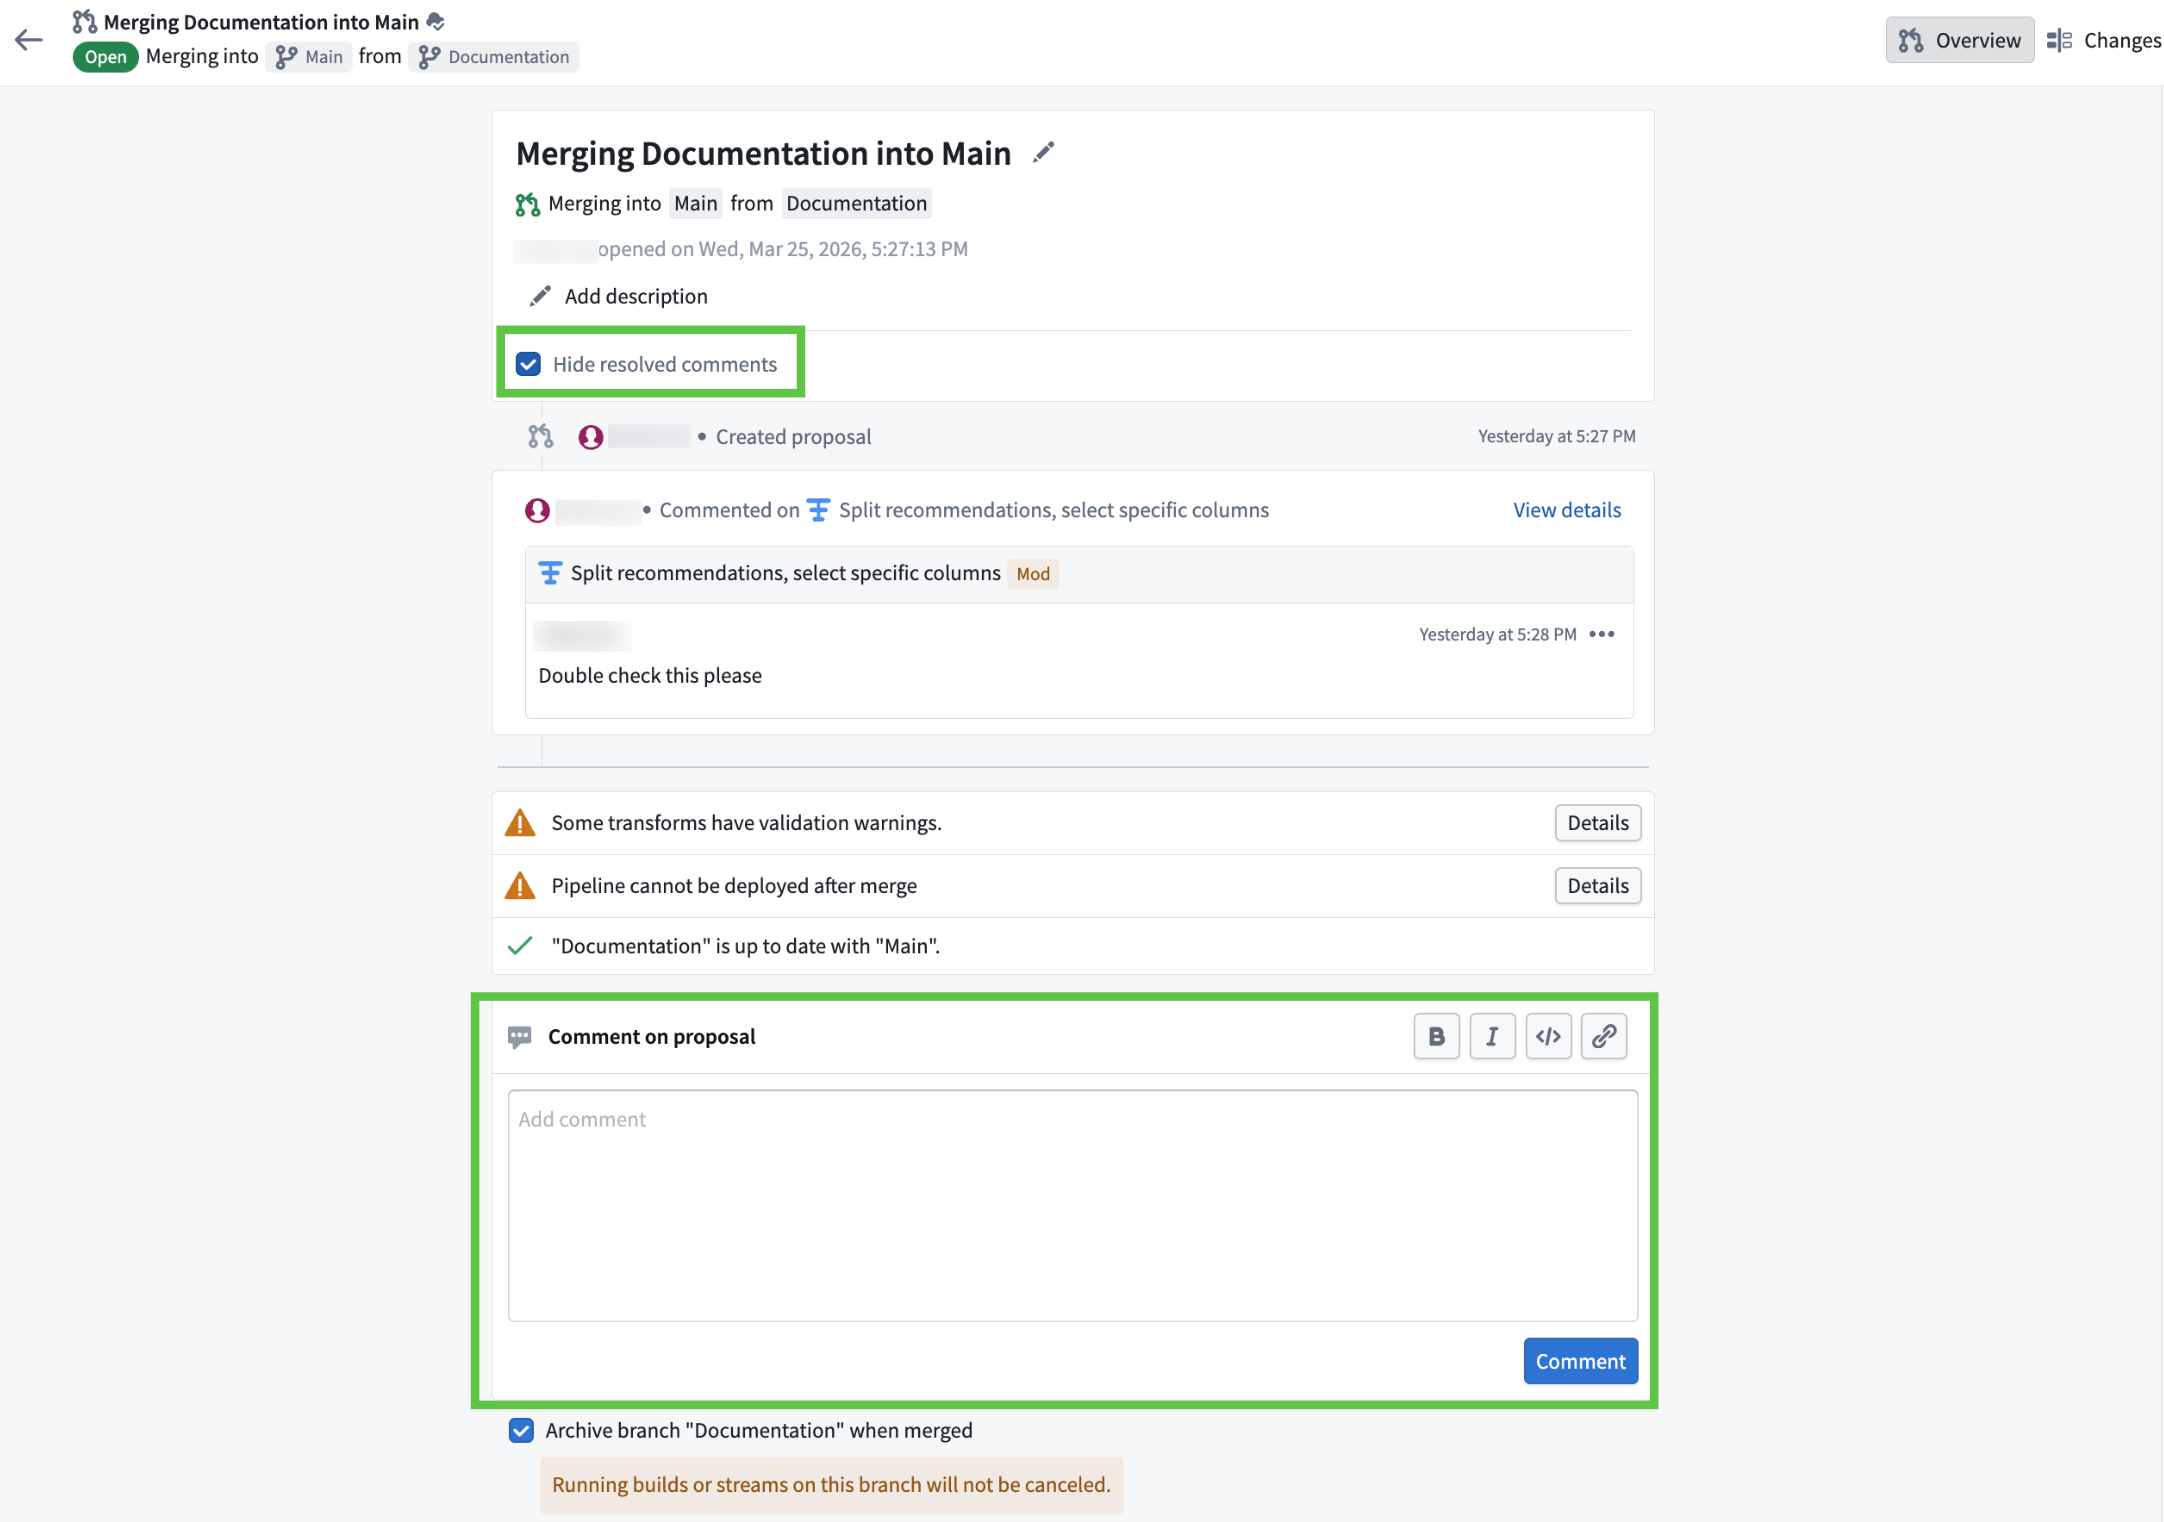
The proposal overview page, featuring a comment box at the bottom for new input and a "Hide resolved comments" toggle at the top for filtering comments.
How to use
Node-level commenting makes collaboration more efficient and organized, ensuring feedback is always actionable and context-specific. To get started:
- Open your proposal in Pipeline Builder.
- Go to the Changes tab.
- Select a node and use the comment icon to add your feedback. You can also double click into node and add comments within it.
Use the comment icon when a specific node is selected in the pipeline graph within the "Changes" tab to add comments related to that node.
Share your feedback
As we continue to add features to Pipeline Builder, we want to hear about your experiences and welcome your feedback. Share your thoughts with Palantir Support channels or our Developer Community ↗ using the pipeline-builder tag ↗.
Analyze and investigate your ontology with Insight
Date published: 2026-03-27
Insight, a point-and-click application for exploring and analyzing ontology data without writing code, will be generally available for all enrollments starting the week of March 30.
An Insight workbook displaying an analysis path of an Aircraft object type.
Insight lets you build step-by-step analysis paths to filter objects, follow object links, aggregate results, and create visualizations. Your work is saved in workbooks, which store analysis paths, layouts, and data in one place. Workbooks can be saved, shared with other users, and used to create published object sets that are reusable across the platform.
Insight is designed for operational users and analysts who need to explore ontology data, drill into relationships between object types, and take action on results without needing deep technical expertise.
Key capabilities
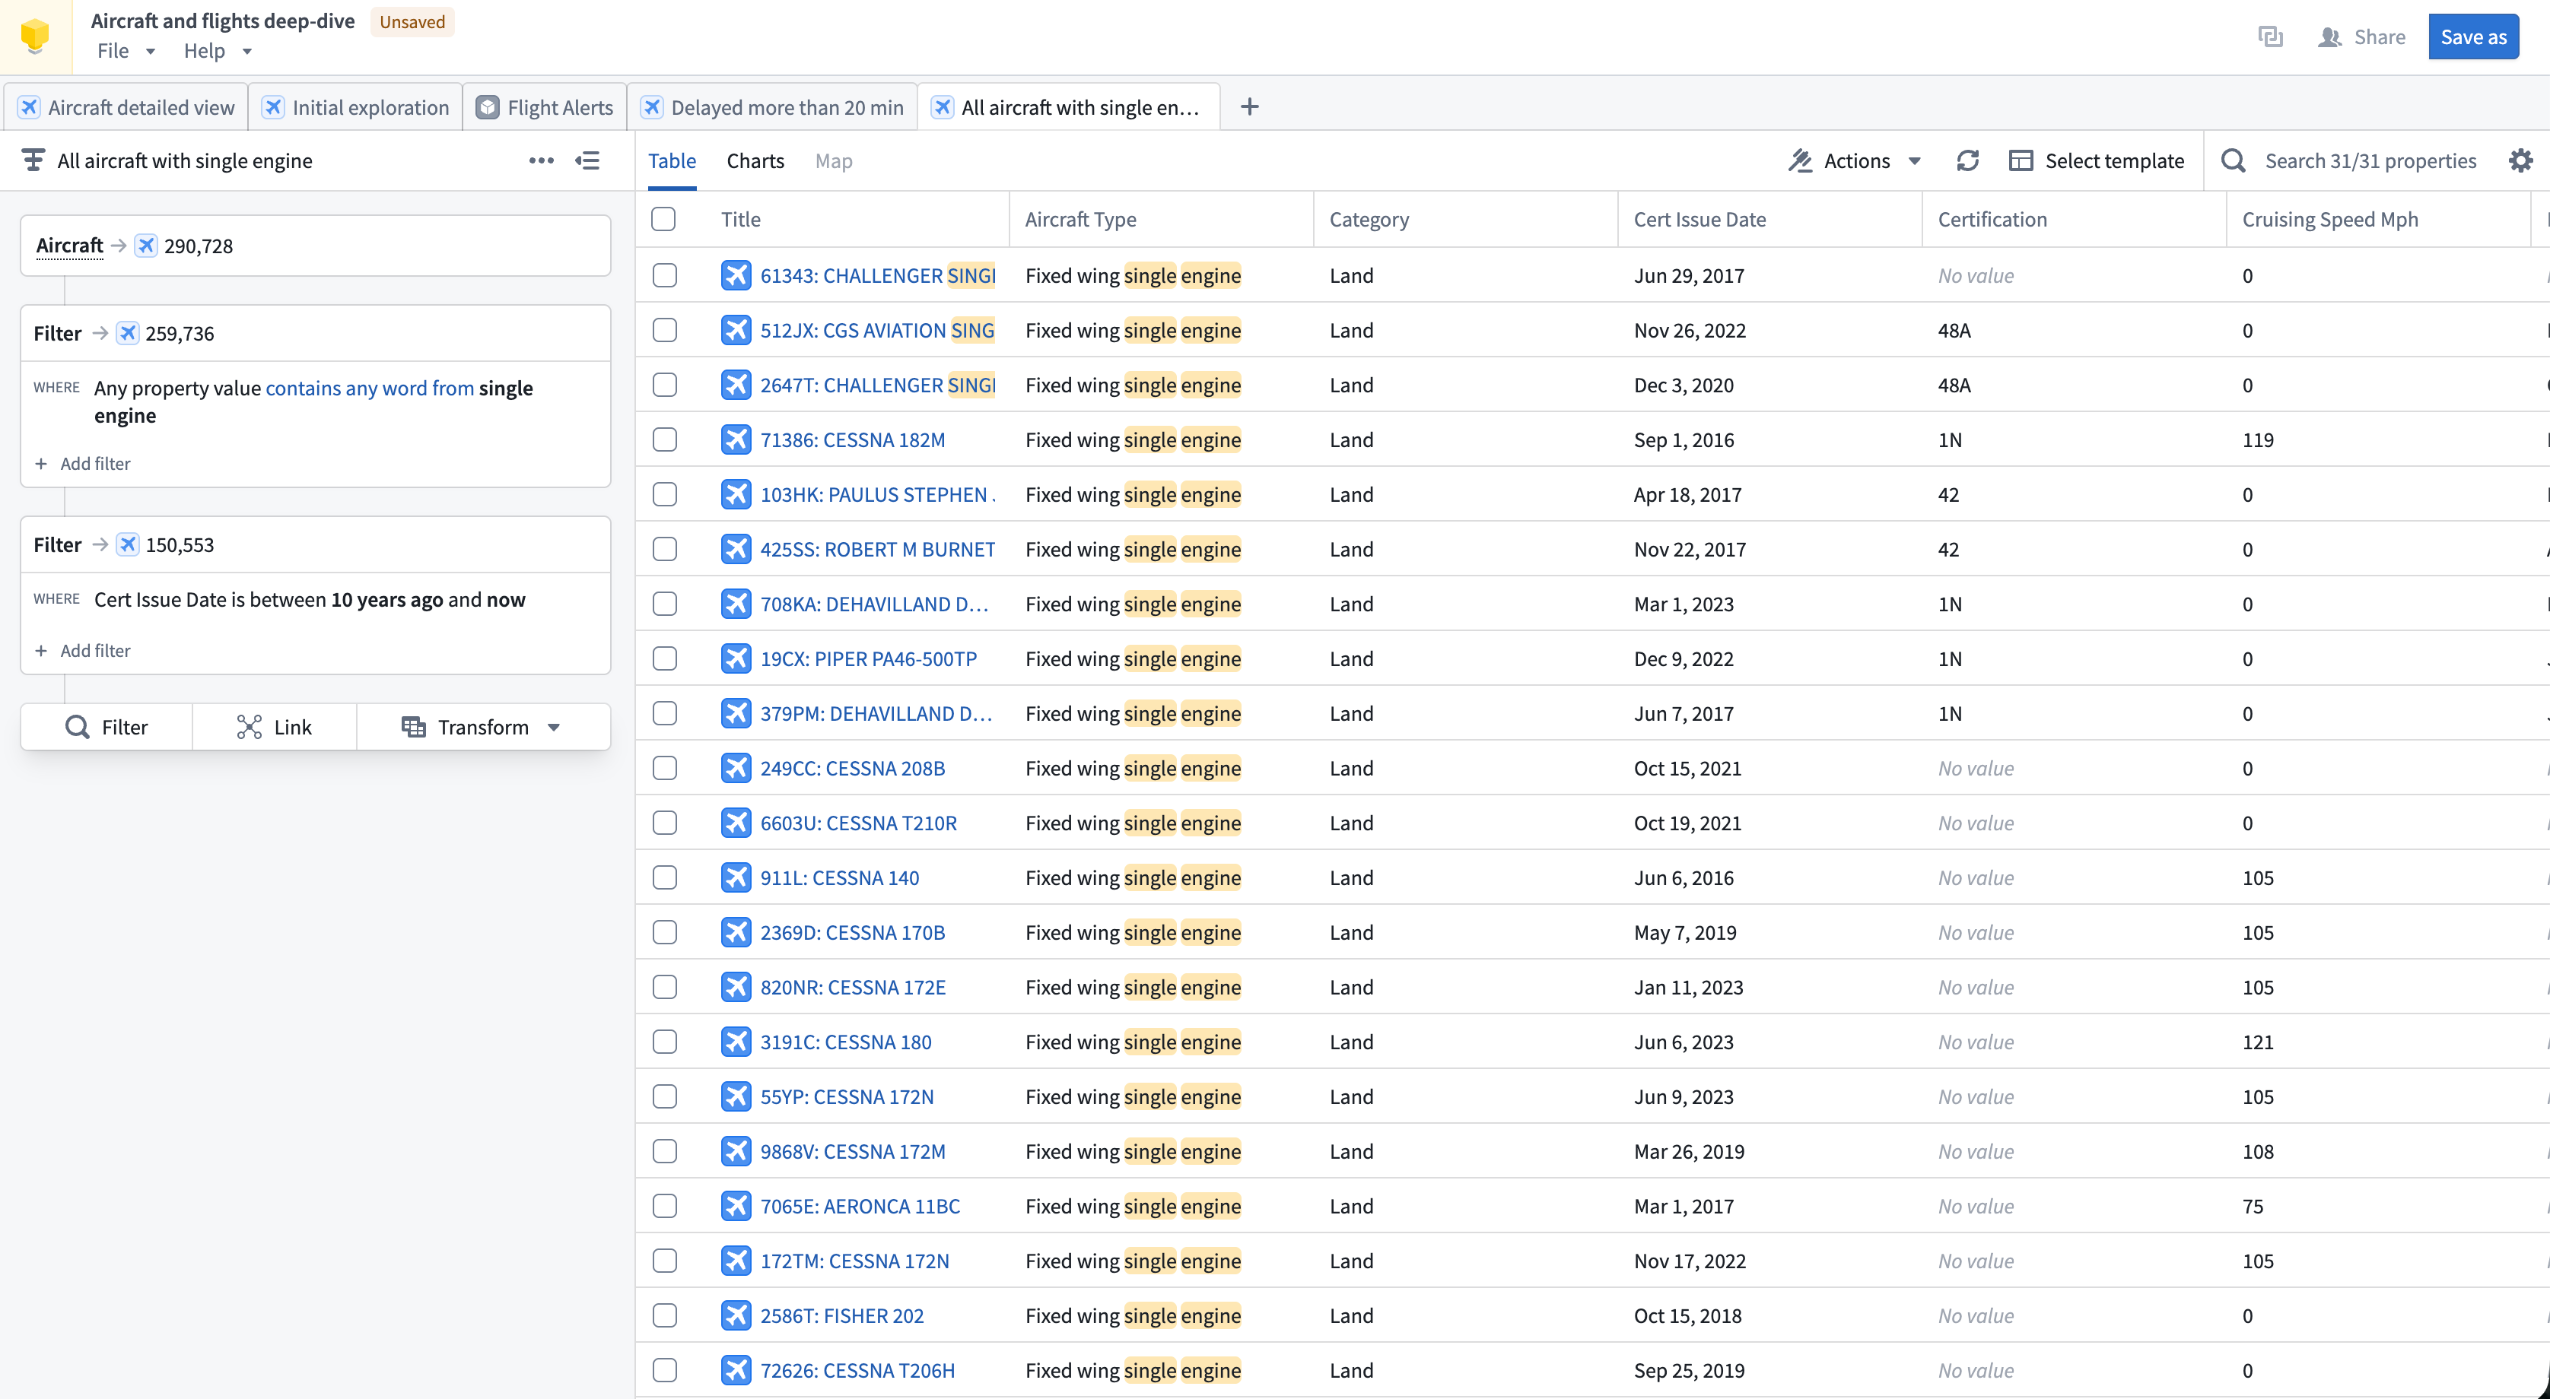
Analysis paths: Build multi-step analyses by chaining Filter, Link, and Transform cards in the Analysis panel. Each card tracks object counts at that step, and individual steps can be toggled on or off without removing them from the path.
Object type links: Use the Link card to traverse object relationships and pivot your analysis to connected object types. For example, start with a filtered set of Aircraft, follow links to Flights, then follow links again to Airports to view only the airports relevant to your filtered results.
Aggregations and SQL: Group objects and compute metrics using Group by operations, or write SQL queries directly in the SQL sandbox for advanced analysis. SQL operates on a single object type and supports joins with other object types without relying on ontology link types.
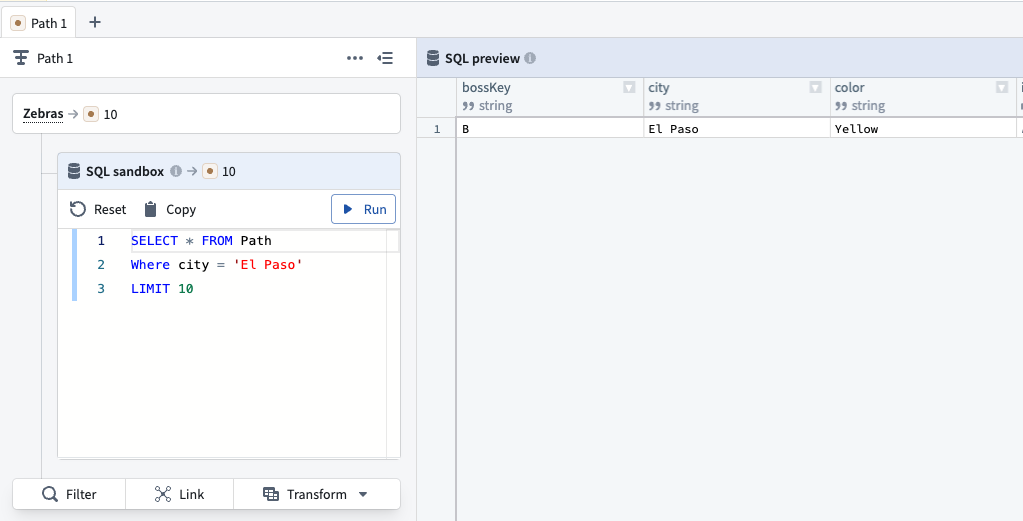
A SQL query in Insight, searching for object type data where the City property is El Paso.
Visualizations and maps: Visualize properties as distributions, histograms, and single-stat metrics in the Charts tab. If an object type contains geographic properties, the Map tab is available to filter objects spatially using drawn shapes and polygons.
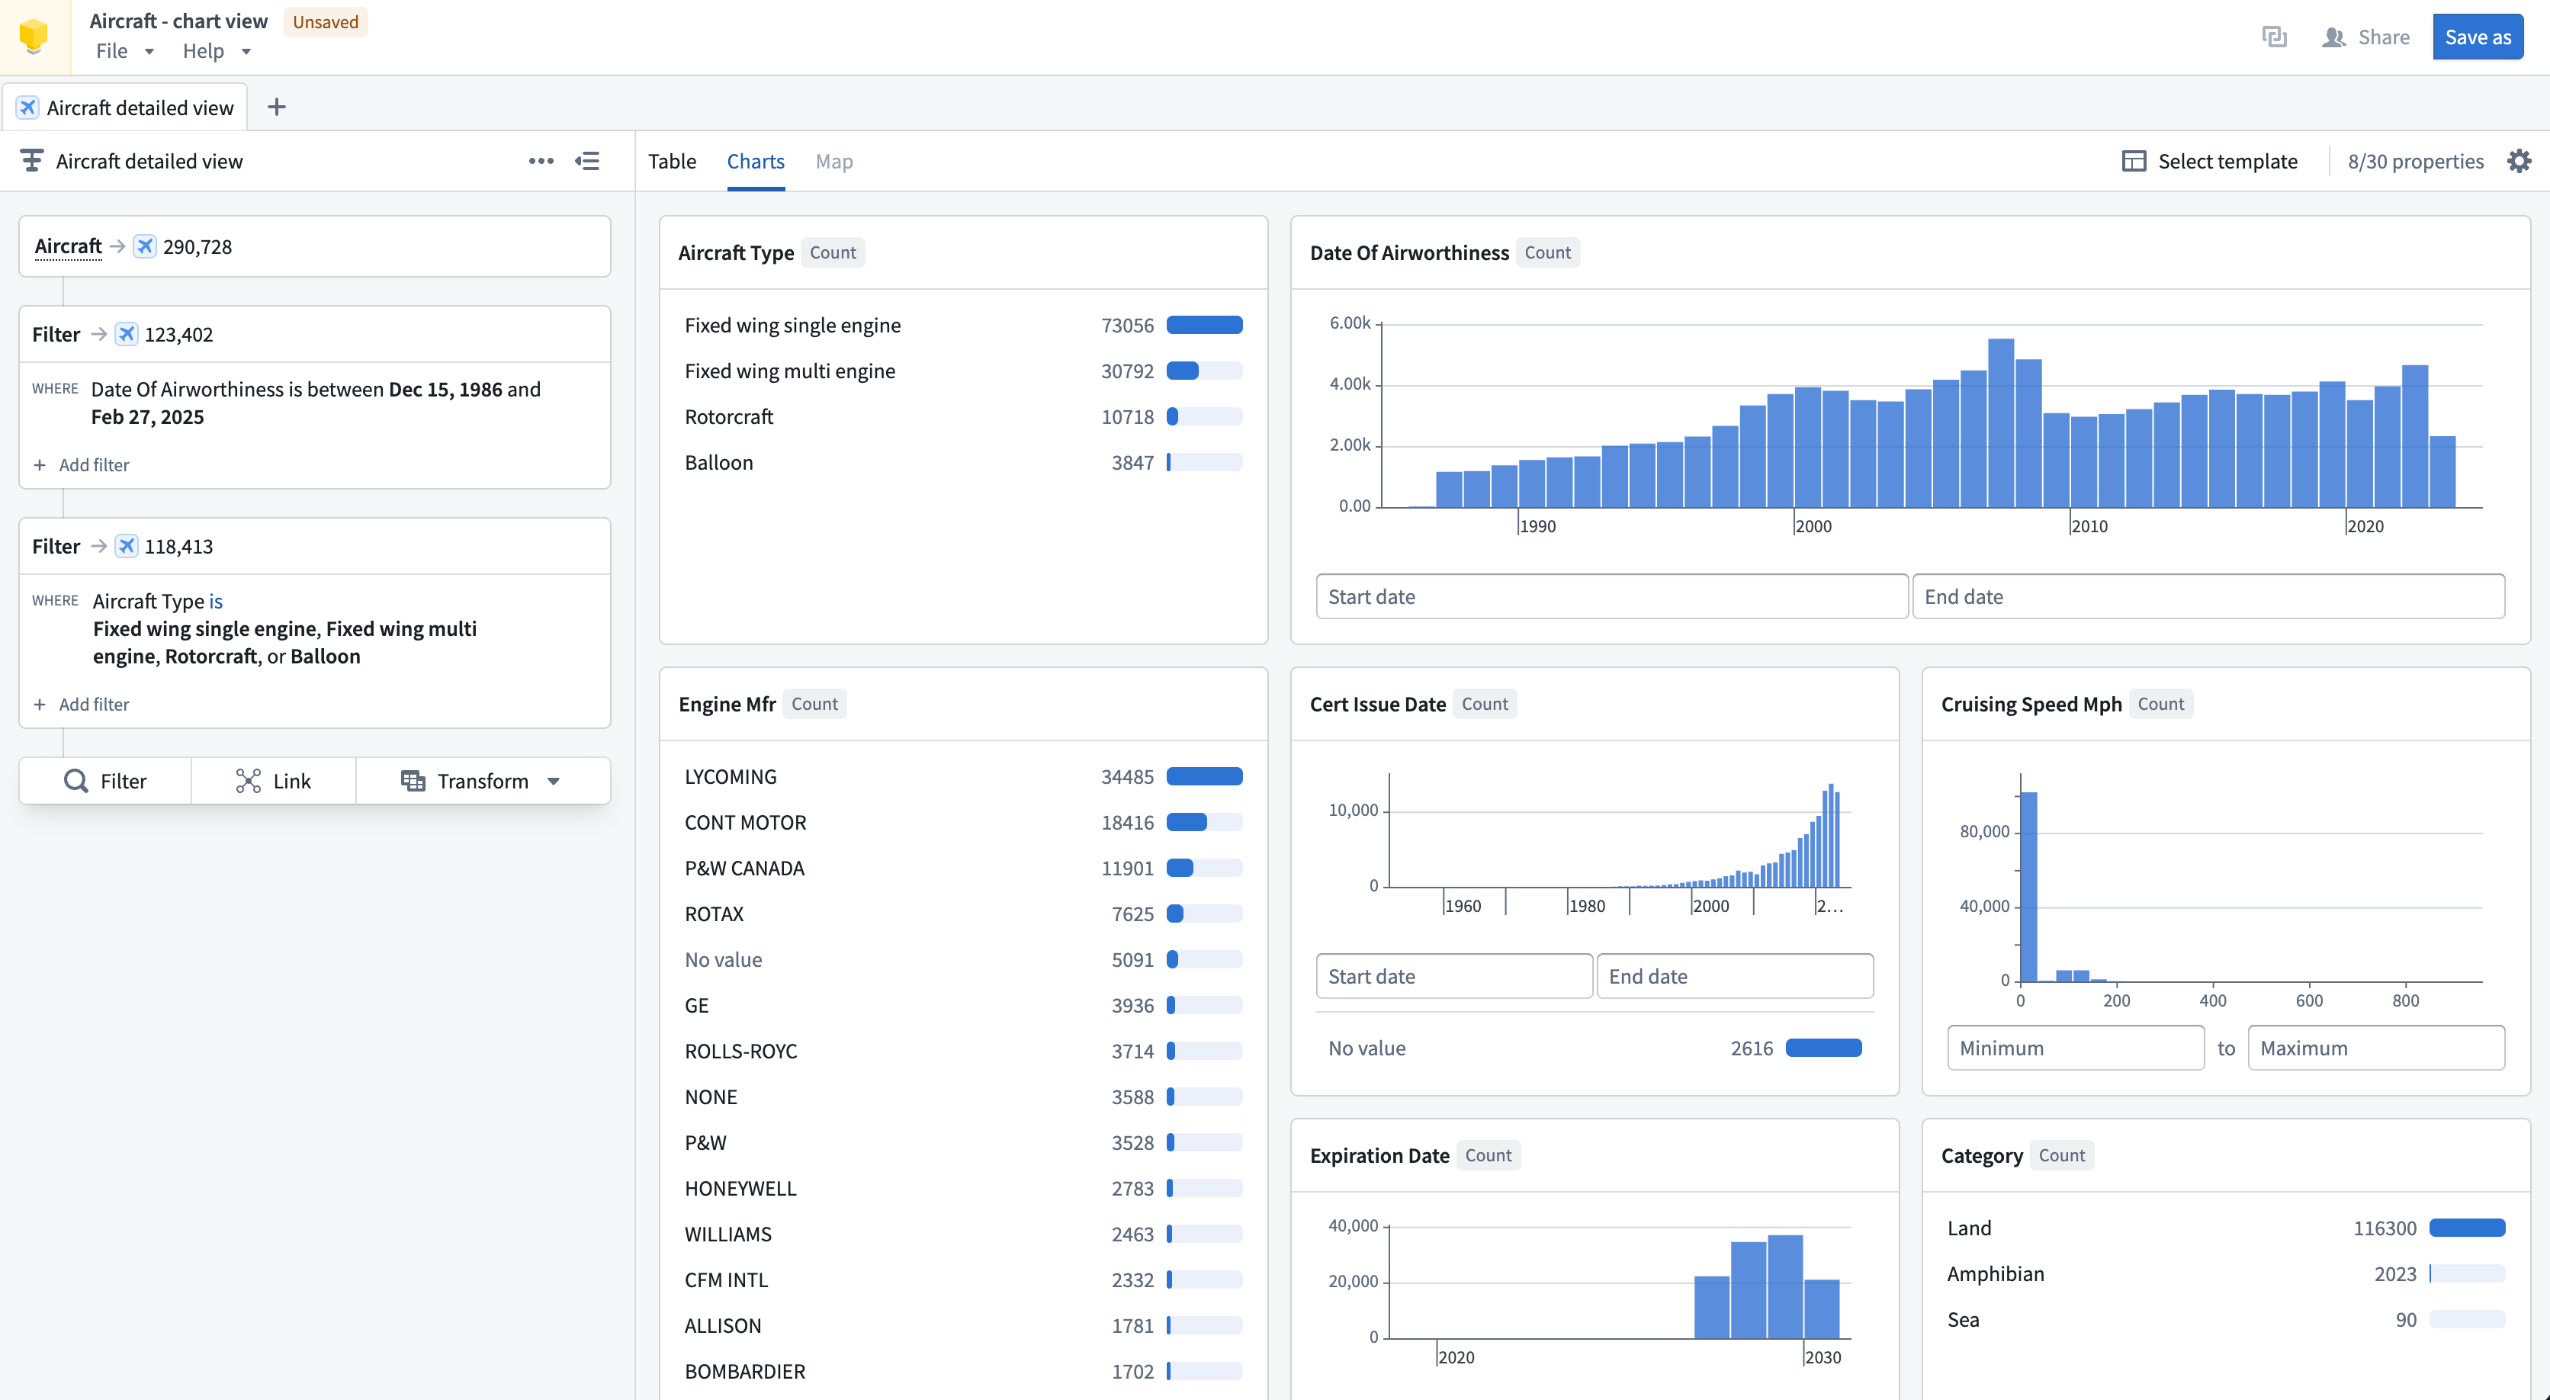
The Charts tab in an Insight workbook, displaying data visualizations of an Aircraft object type analysis.
Data writeback: Create, update, and delete objects directly from analysis results using actions, without leaving Insight.
Sharing and reuse: Publish any analysis path as an object set, making it discoverable and usable in other applications including Quiver and Vertex. Share workbooks with specific users or via link sharing with configurable access roles.
To get started building an analysis in Insight, review our documentation.
Your feedback matters
We want to hear about your experience analyzing your ontology with Insight. Share your feedback with our Palantir Support ↗ channels or on the Developer Community ↗.
VS Code Workspaces for functions repositories is now available
Date published: 2026-03-26
You can now author your functions repositories in VS Code Workspaces, bringing the same UI and tooling you are used to from Code Repositories into a faster, more capable environment.
Here's what's included:
- Live preview to test changes directly in VS Code
- Side panel for importing resources and generating SDKs
- Tag and release panel to select and manage release versions
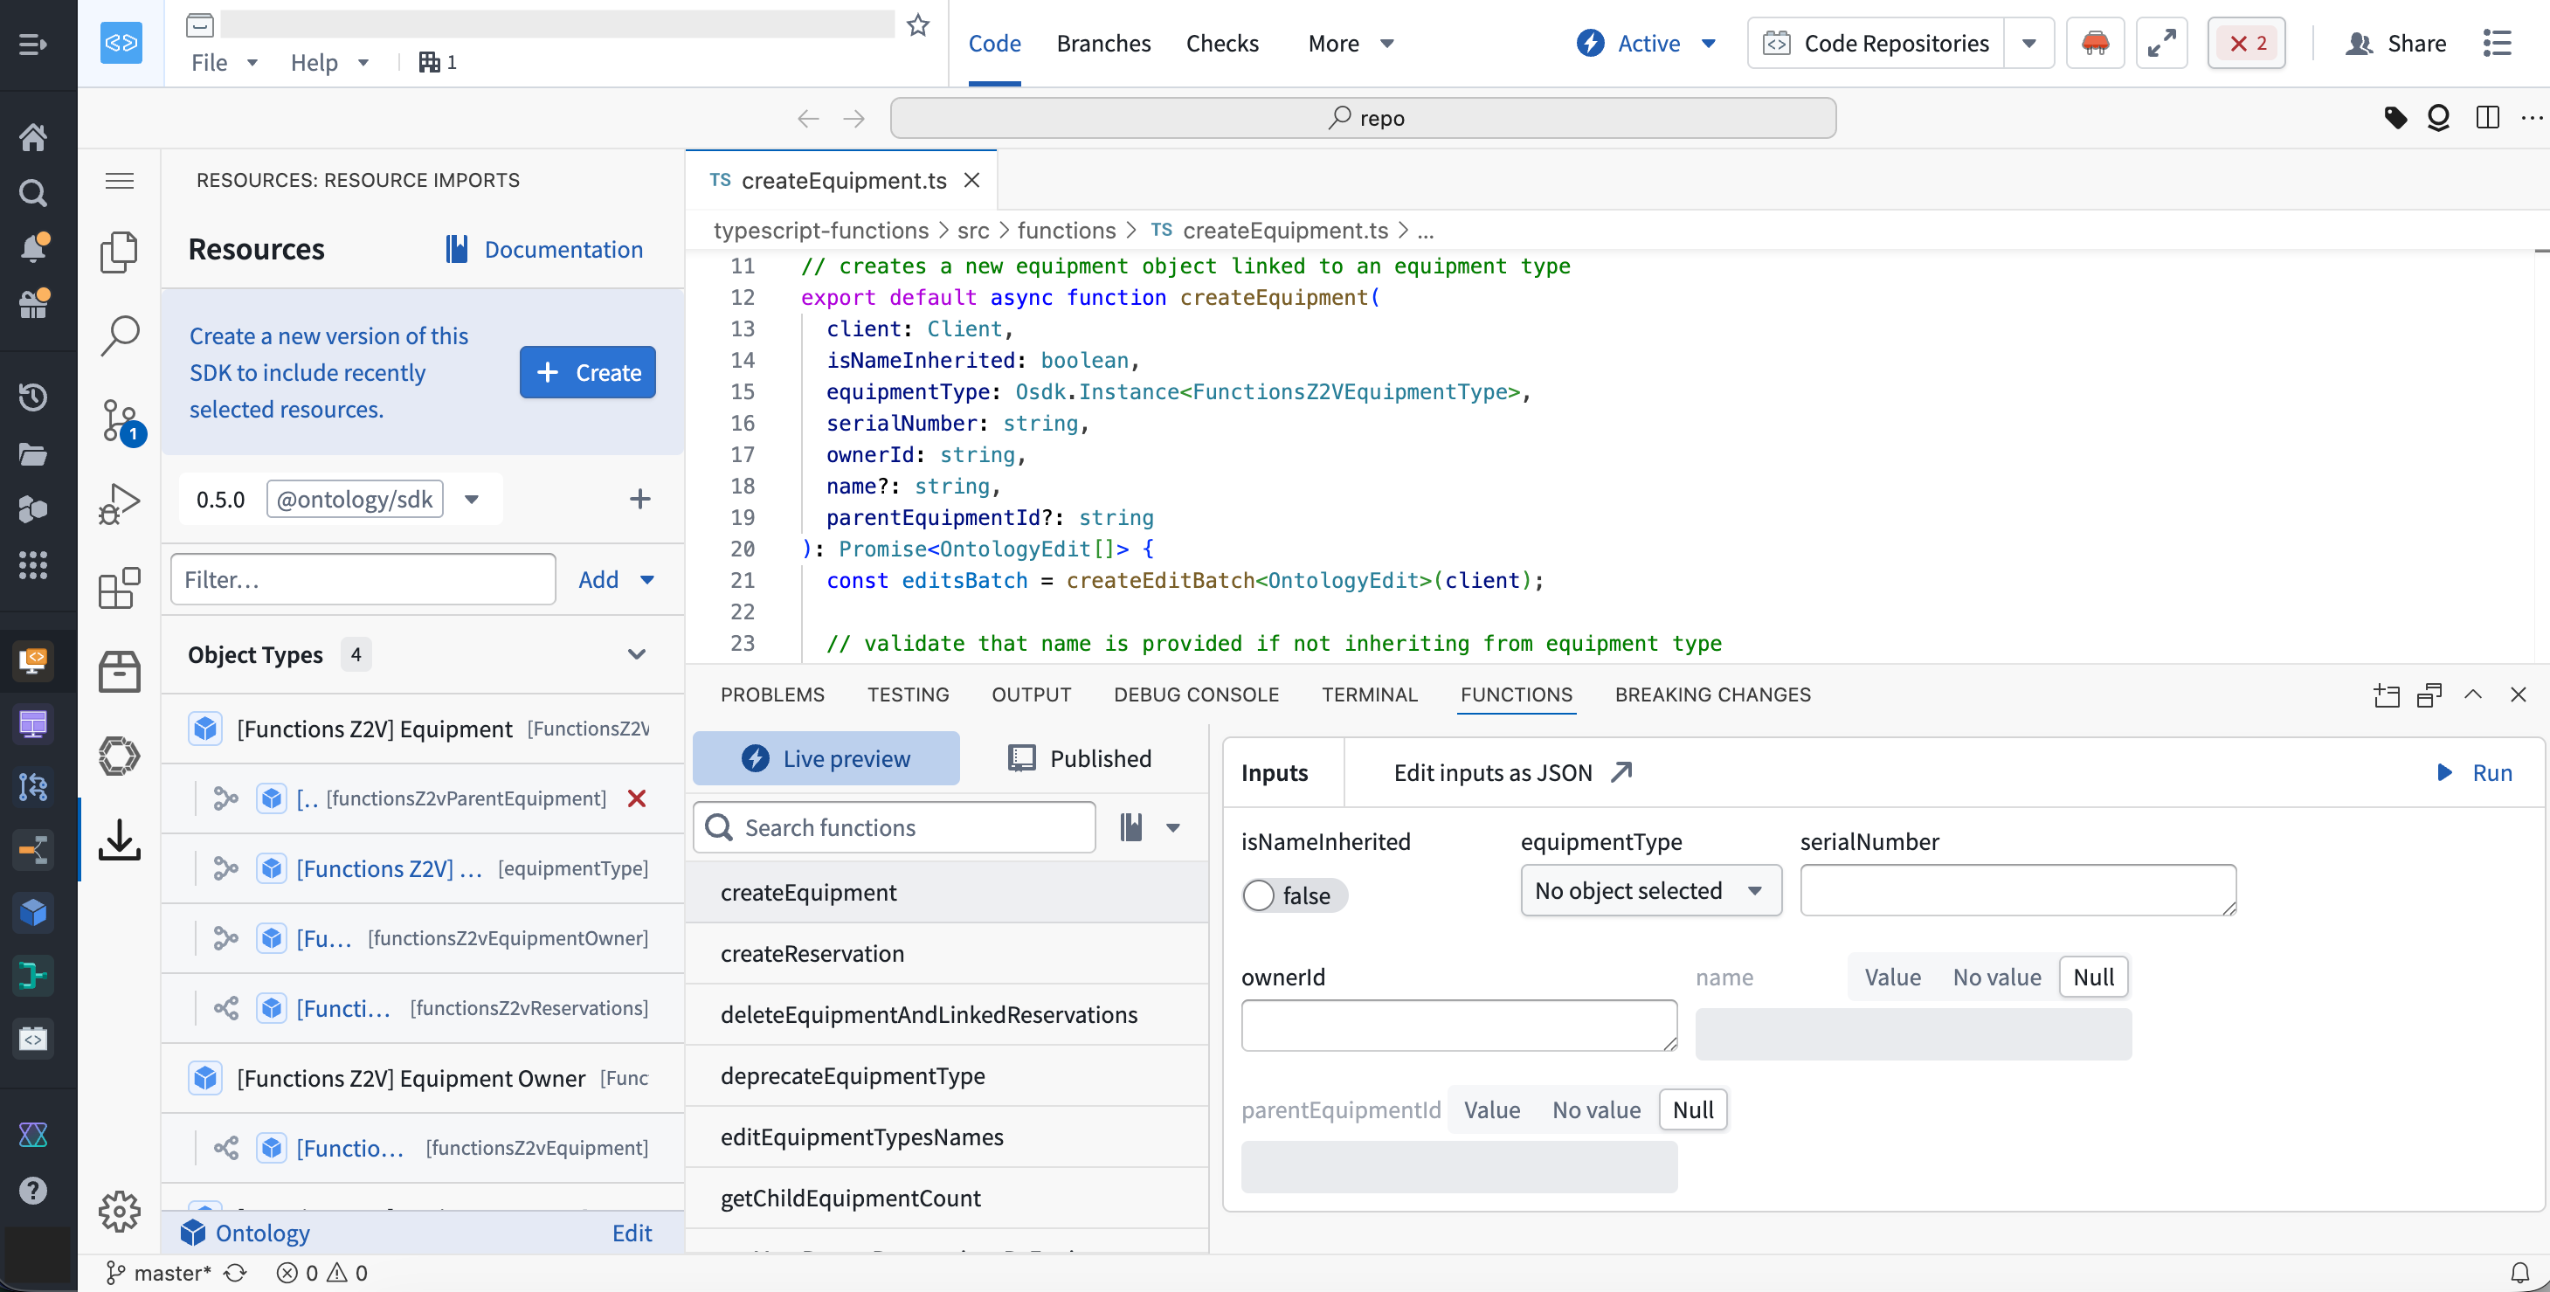
Open your repository in Code Workspaces using the "Edit in VS Code" button in the header to unlock the new experience.
VS Code Workspaces runs on a redesigned architecture that delivers faster performance across the board.
VS Code Workspaces is intended to become the standard application for functions repositories, as support within Code Repositories is expected to start transitioning to legacy status around June 2026.
We want to hear from you
Share feedback or tell us about your experience with VS Code, contact our Palantir Support channels or join the conversation in our Developer Community using the vscode tag ↗ .
Microsoft Copilot Studio integration for Ontology MCP
Date published: 2026-03-26
Ontology MCP now supports integration with Microsoft Copilot Studio, enabling you to connect your Foundry ontology to Microsoft's AI agent platform and surface structured ontology data directly in Teams, Copilot, and Outlook.
When setting up this integration, create your Developer Console application as a Backend service with User's permissions. Copilot Studio only supports authorization code grant in a Confidential Client, which requires a service user to issue tokens on behalf of your users.
Adaptive Cards for rich data display
With this integration, you can use Microsoft Adaptive Cards to render ontology data as formatted, interactive cards rather than plain text. For example, an agent can query your ontology for a customer portfolio and display the results as a structured card with risk status, renewal dates, and action buttons.
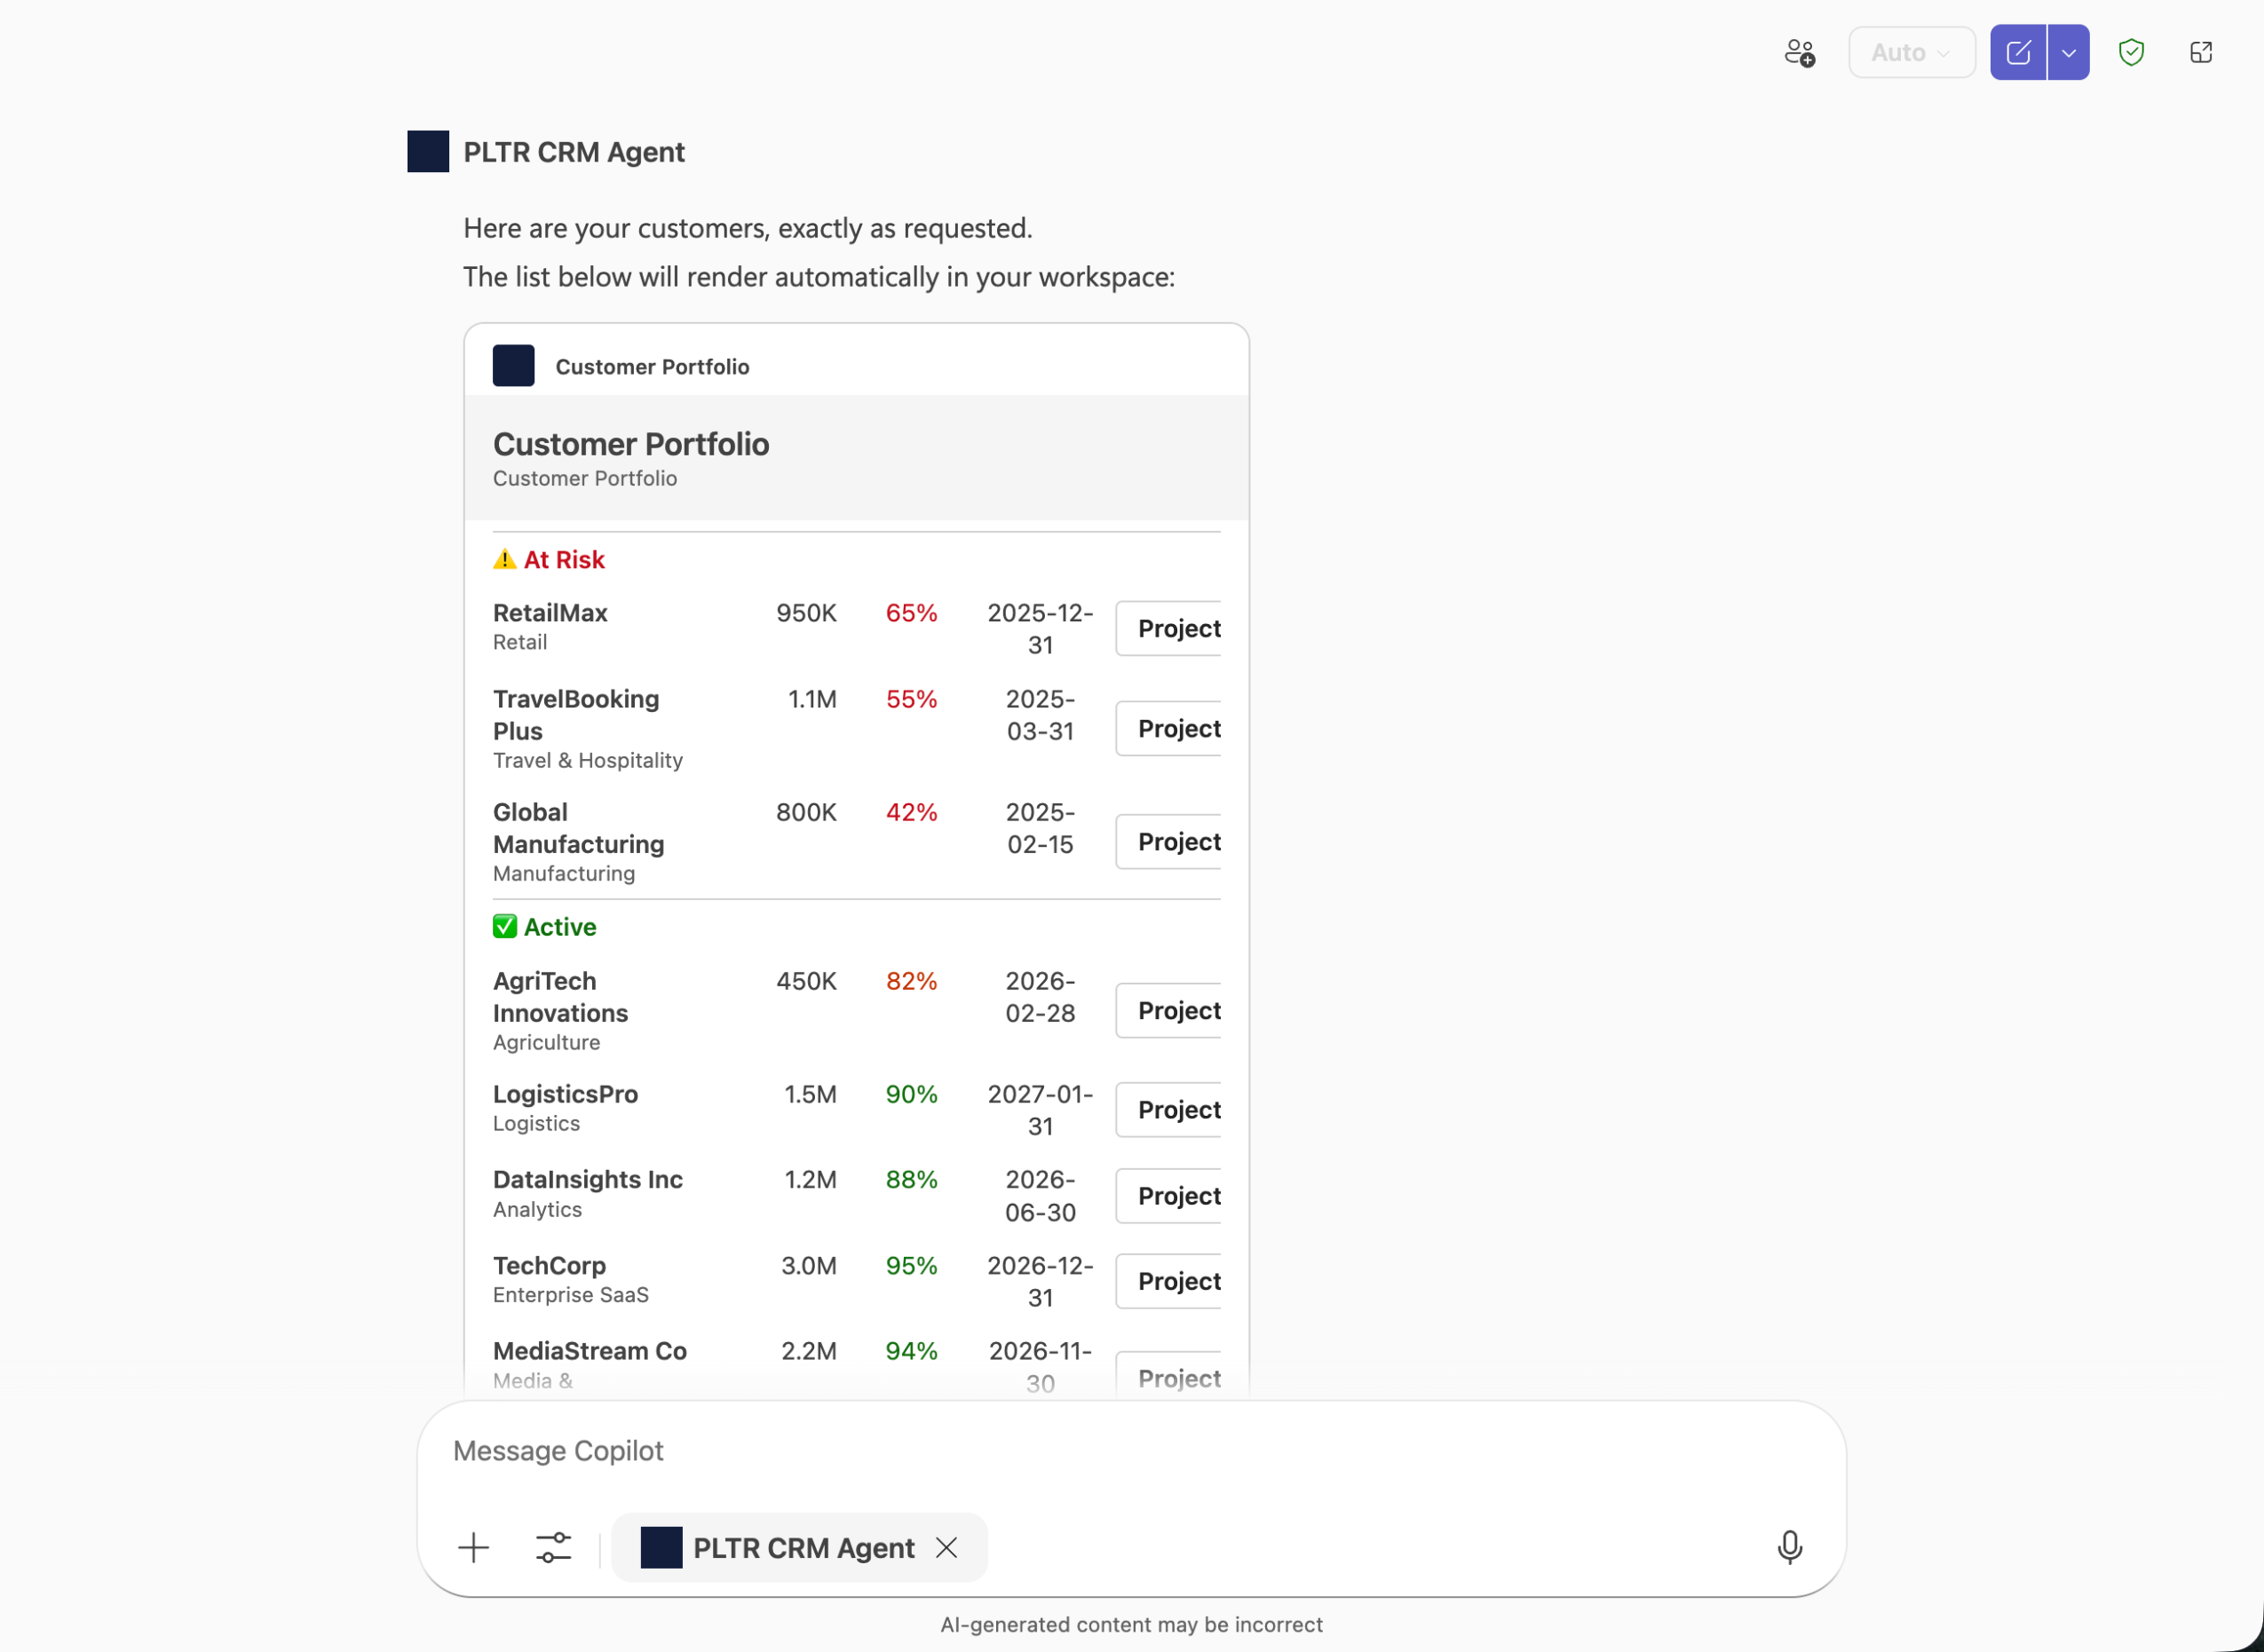
An example Palantir CRM Agent displaying data with Microsoft Adaptive Cards using Copilot Studio.
You can also use Action.OpenUrlDialog in your Adaptive Cards to open custom dialogs in Teams or Copilot, allowing users to interact with Ontology MCP data inline.
Getting started
To begin, install the Microsoft 365 Agents Toolkit and Adaptive Card Previewer VS Code extensions. Then, configure your Ontology MCP server in VS Code and use the Microsoft 365 Agents Toolkit to create an adaptive agent. Add a capabilities block with response_semantics to your agent's tool definitions to map Ontology MCP tool output to Adaptive Card templates.
For a step-by-step walkthrough, see the MCP tools and agent configuration documentation.
GPT-5.4 Mini and GPT-5.4 Nano are now available in AIP
Date published: 2026-03-19
GPT-5.4 mini↗ and GPT-5.4 nano↗ are now available directly from OpenAI for non-georestricted enrollments.
Model overviews
GPT-5.4 mini is enhanced over GPT-5 mini for coding, reasoning, tool use, computer use, and multimodal tasks, while running twice as fast with performance nearing GPT-5.4. GPT-5.4 nano is the smallest and most affordable GPT-5.4 variant, ideal for classification, data extraction, ranking, and lightweight coding tasks. Learn more about these models in OpenAI's announcement ↗.
- Context window: 400,000 tokens
- Knowledge cutoff: August 2025
- Modalities: Text, image
- Capabilities: Responses API, structured outputs, function calling, tool search, computer use, streaming
Getting started
To use these models:
- Confirm that your enrollment administrator has enabled the relevant model family.
- Review token costs and pricing.
- See the complete list of all models available in AIP.
Share your feedback
We want to hear about your experiences using language models in the Palantir platform and welcome your feedback. Share your thoughts with Palantir Support channels or on our Developer Community ↗ using the language-model-service ↗ tag.
Enforce default preview behavior in Pipeline Builder
Date published: 2026-03-19
You can now configure Pipeline Builder to require manual confirmation before running previews, preventing unintended runs and saving compute resources. To enable this setting, navigate to Control Panel > Pipeline Builder, and toggle the Enable preview confirmation by default option.
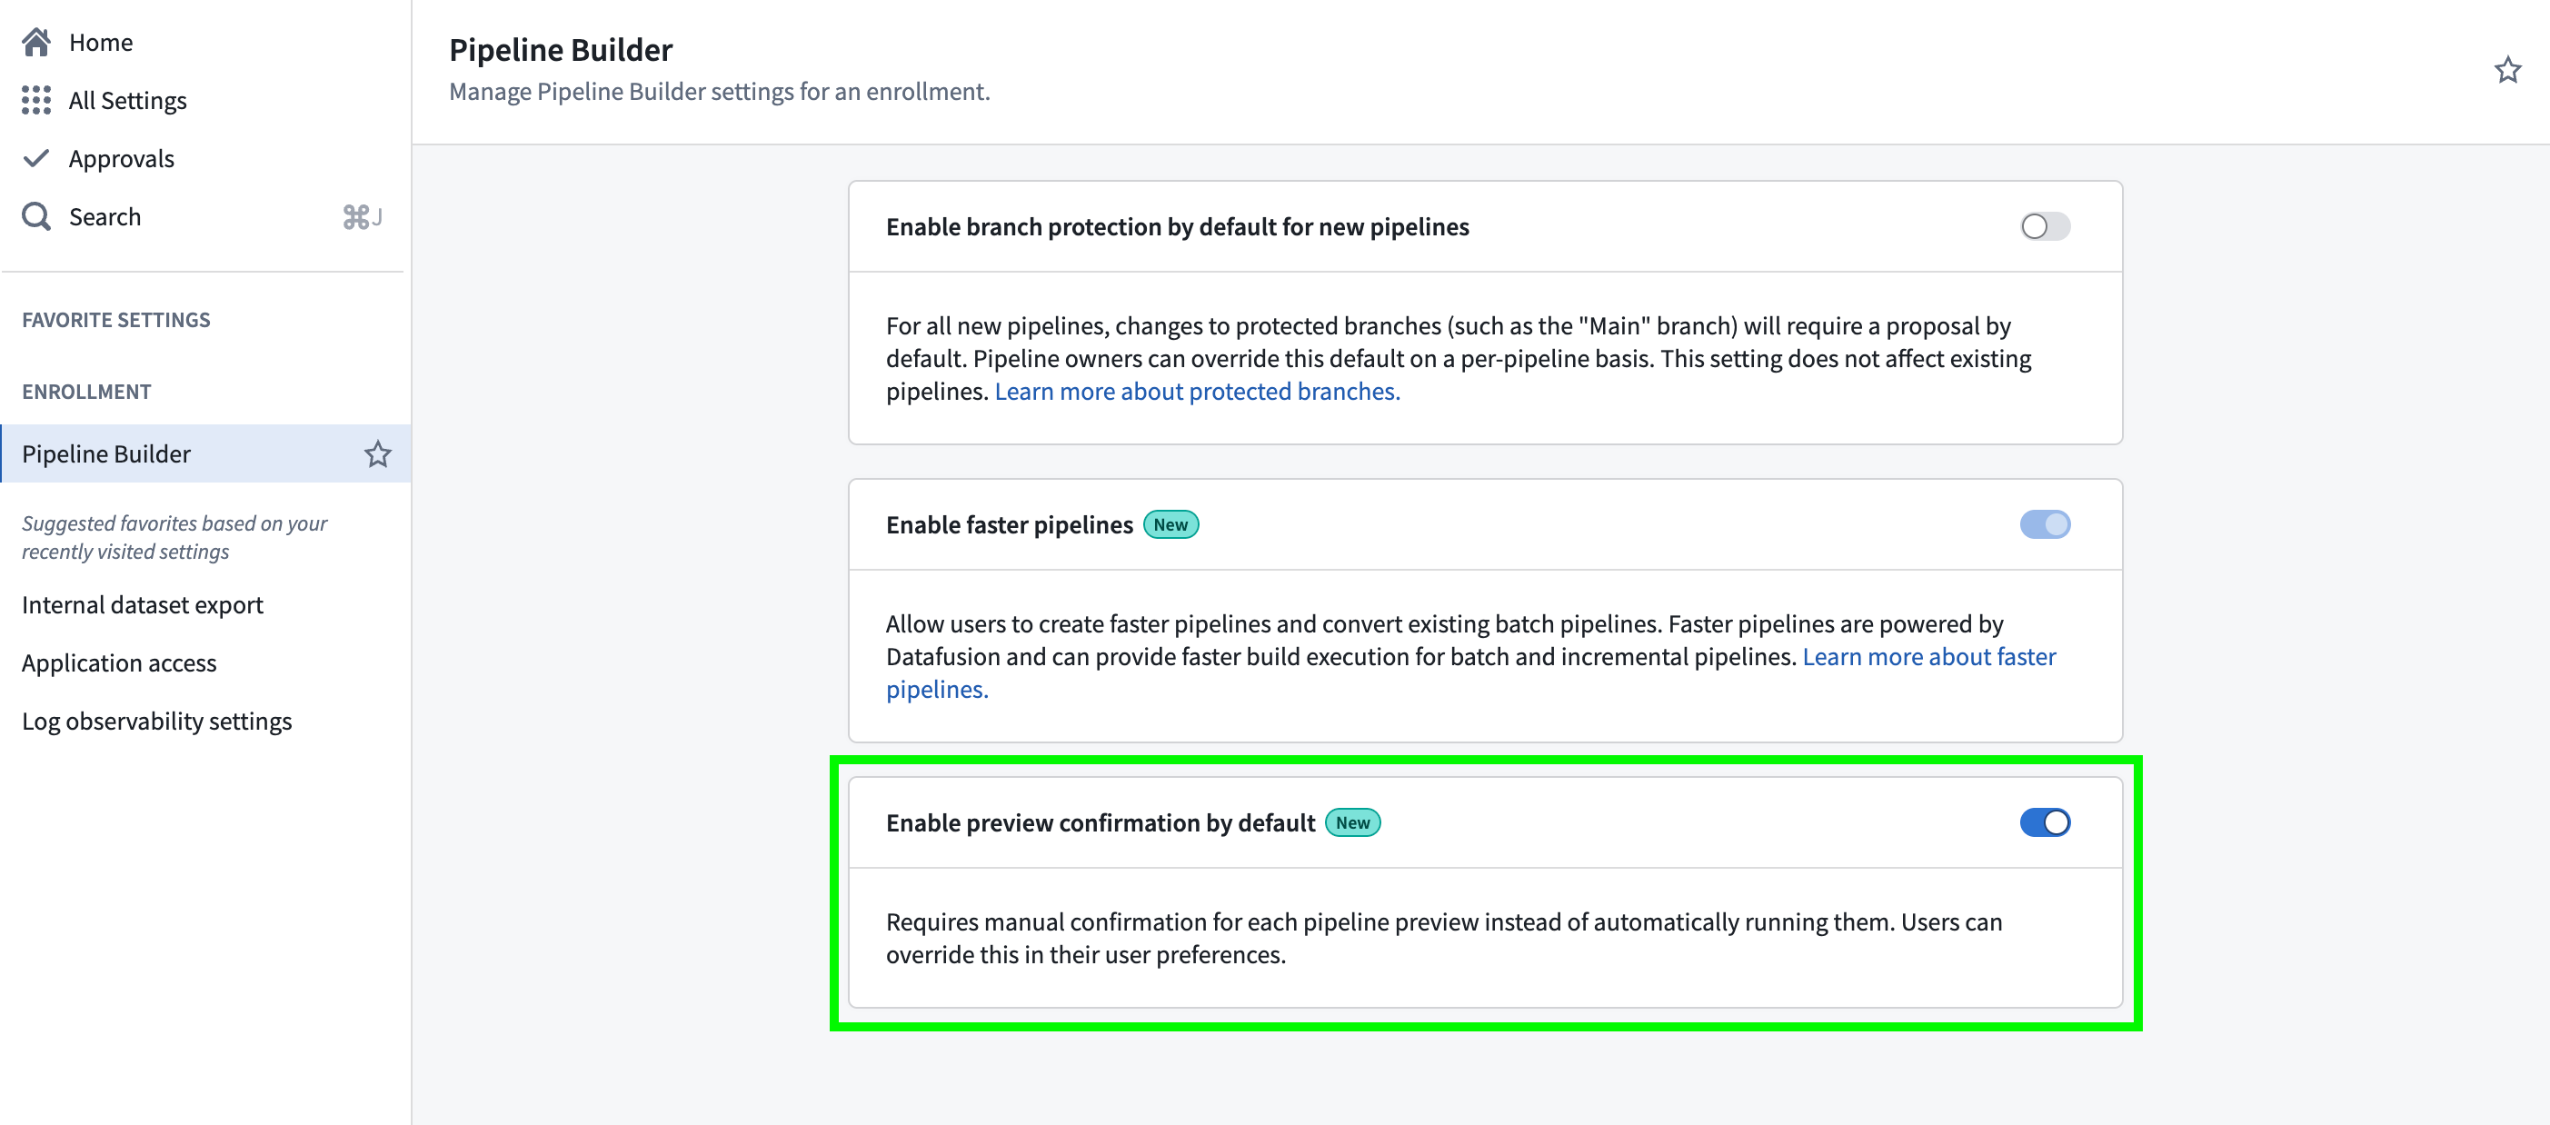
Pipeline Builder's Enable preview confirmation by default setting in Control Panel.
With this new option, enrollment administrators can choose whether previews run automatically or require manual confirmation for all users in an enrollment. User preference settings in Pipeline Builder remain available, allowing individuals to override the enrollment default with their own preview behavior configuration.
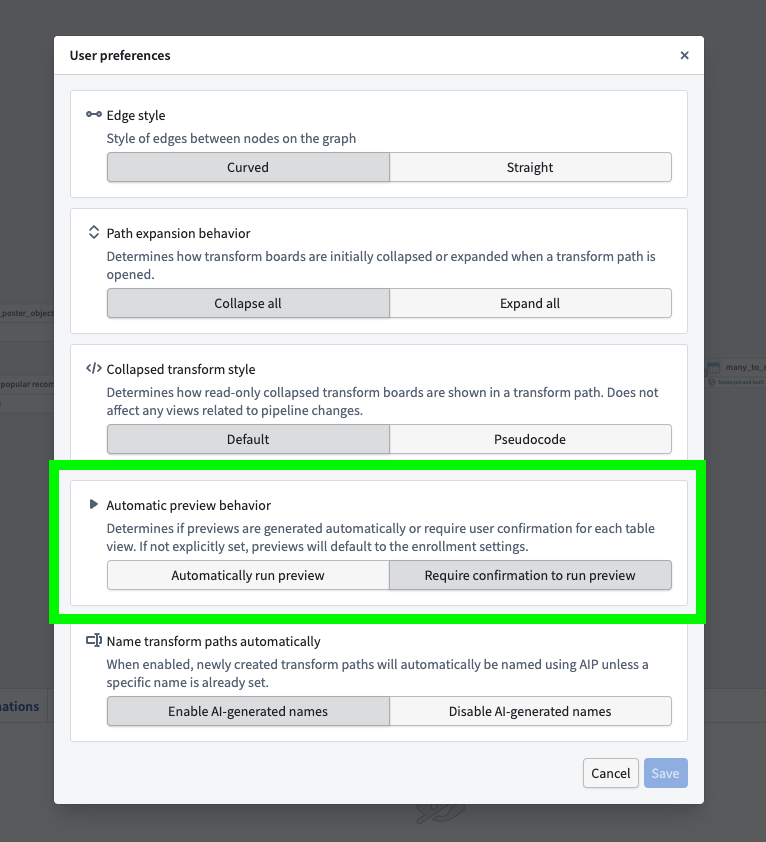
The Automatic preview behavior option in the Pipeline Builder User preferences menu.
This update gives organizations greater control and consistency in how data previews are managed, making it easier to enforce best practices and optimize compute usage across enrollments.
Learn more about pipeline preview in Pipeline Builder.
Health checks are now available for virtual and Iceberg tables
Date published: 2026-03-19
You can now configure health checks for virtual as well as managed and virtual Iceberg tables to enable monitoring and alerting for common issues, such as:
- Ensuring primary key values are 100 percent unique and non-null
- Verifying the total time since the table last updated meets a configured threshold
- Verifying the table's schema respects the chosen comparison type
- Checking whether the most recent build or job run of the table succeeded
- Checking for the existence and type of a table column
This functionality extends to virtual tables sourced from Databricks, Snowflake, and BigQuery.
Configure and view your table's health checks
To configure a new health check, select Add checks from your table's Health tab before choosing a check to configure.
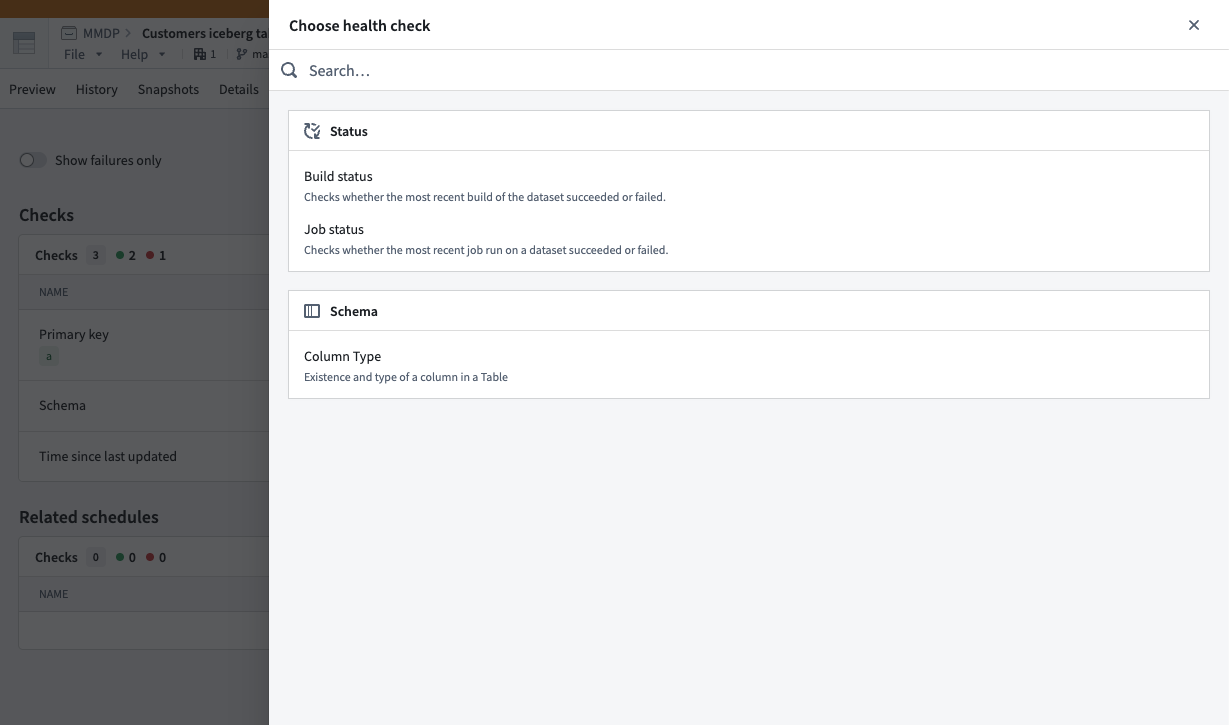
Choose health checks to configure after selecting Add checks in your table's Health tab.
After you configure one or multiple health checks on a virtual or Iceberg table, Foundry displays each in the same Health tab, where you can view its status, timing, monitoring view, and history.
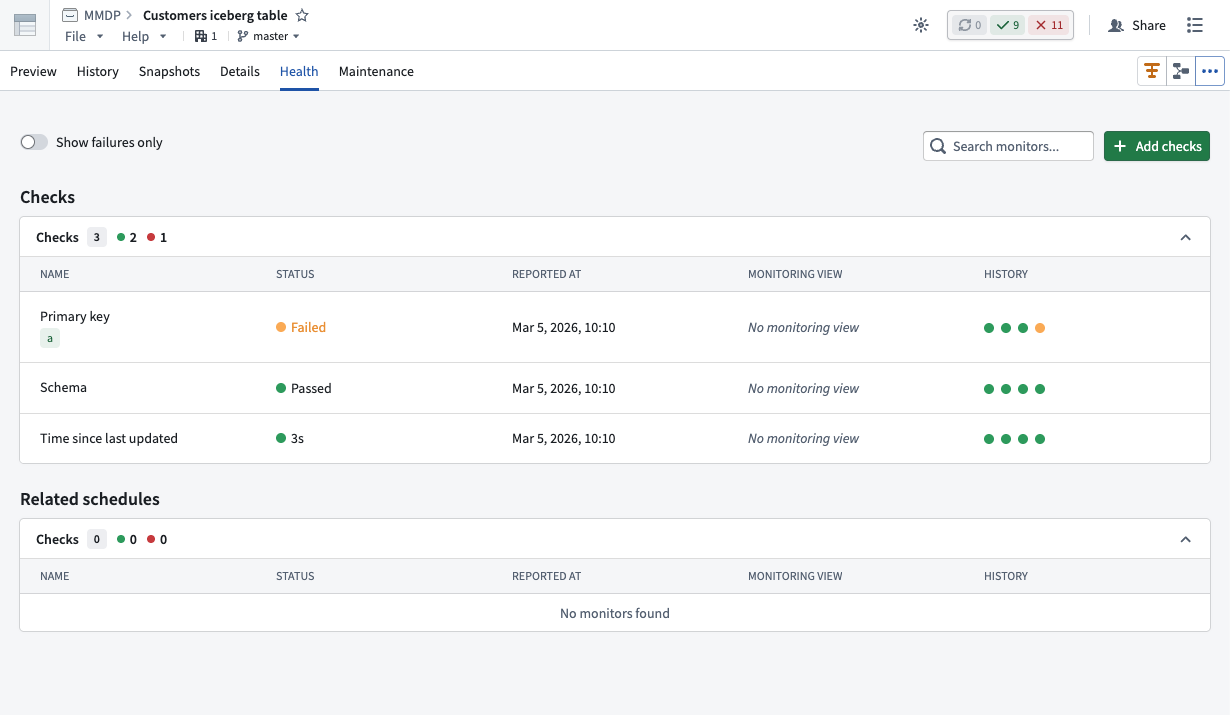
Use the Checks panel of the Health tab to view health checks you configure for a virtual or Iceberg table.
Learn more about when to use virtual or Iceberg tables instead of datasets in Foundry.
Visualize, monitor, and debug your automation workflows with Autopilot
Date published: 2026-03-19
As teams chain together automations, logic functions, and actions in Foundry, understanding how those systems behave becomes difficult. Autopilot, now available in beta, provides the visibility needed to understand how automations connect, trace objects through your workflow, and debug failures in one place. As a beta product, functionality and appearance may change during active development.
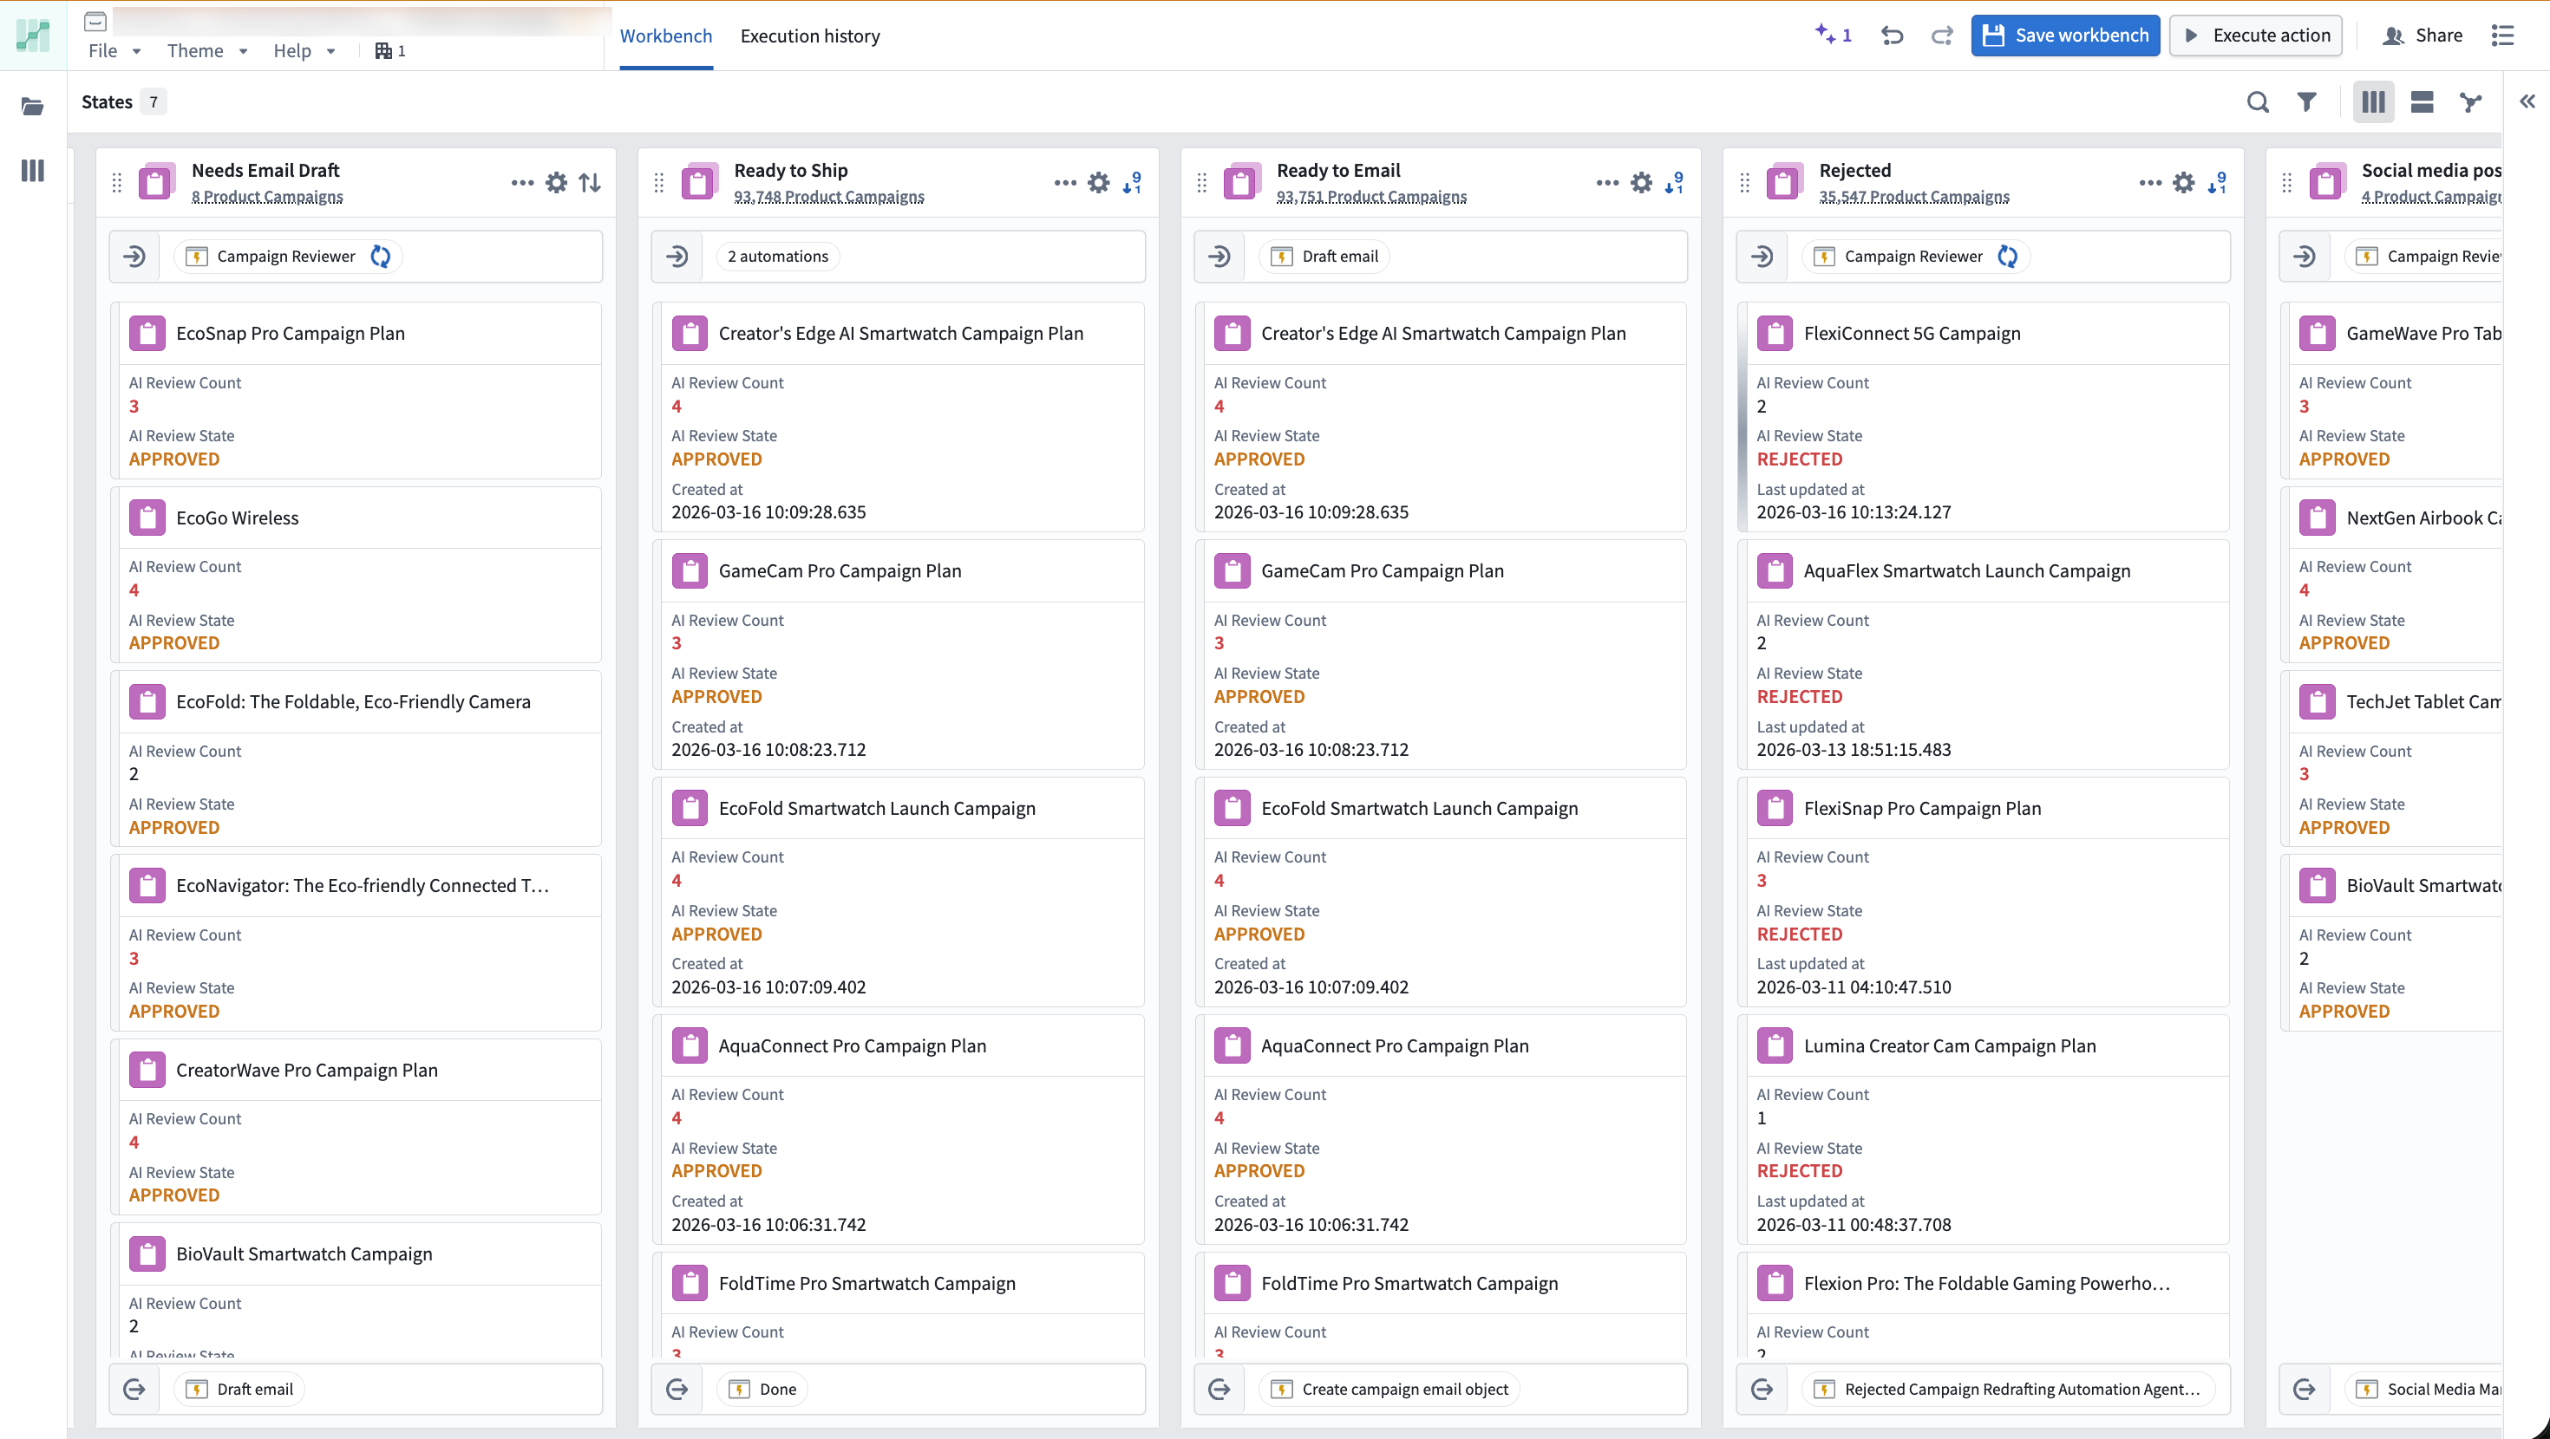
The Kanban board view of the Autopilot workbench.
Capabilities
- Interactive flow graph: Visualize how your automations, logic functions, and actions connect as a dependency graph. Expand nodes to view fallback effects and historical object paths, and monitor active execution with real-time liveness indicators.
- Object-level tracing: Track any object's complete journey through your workflow, including which automations ran, what changes were made, and where failures occurred.
- Live debugging: Monitor automation events and failures in real time using the Object execution tab, with trace logs, error messages, and timing details surfaced directly in Autopilot.
- Kanban-style monitoring: Watch objects move through your workflow states with live updates and instant access to object details.
- Unified resource view: Browse and manage all automation resources from one workbench, with support for Workshop, actions, and pro-code agents.
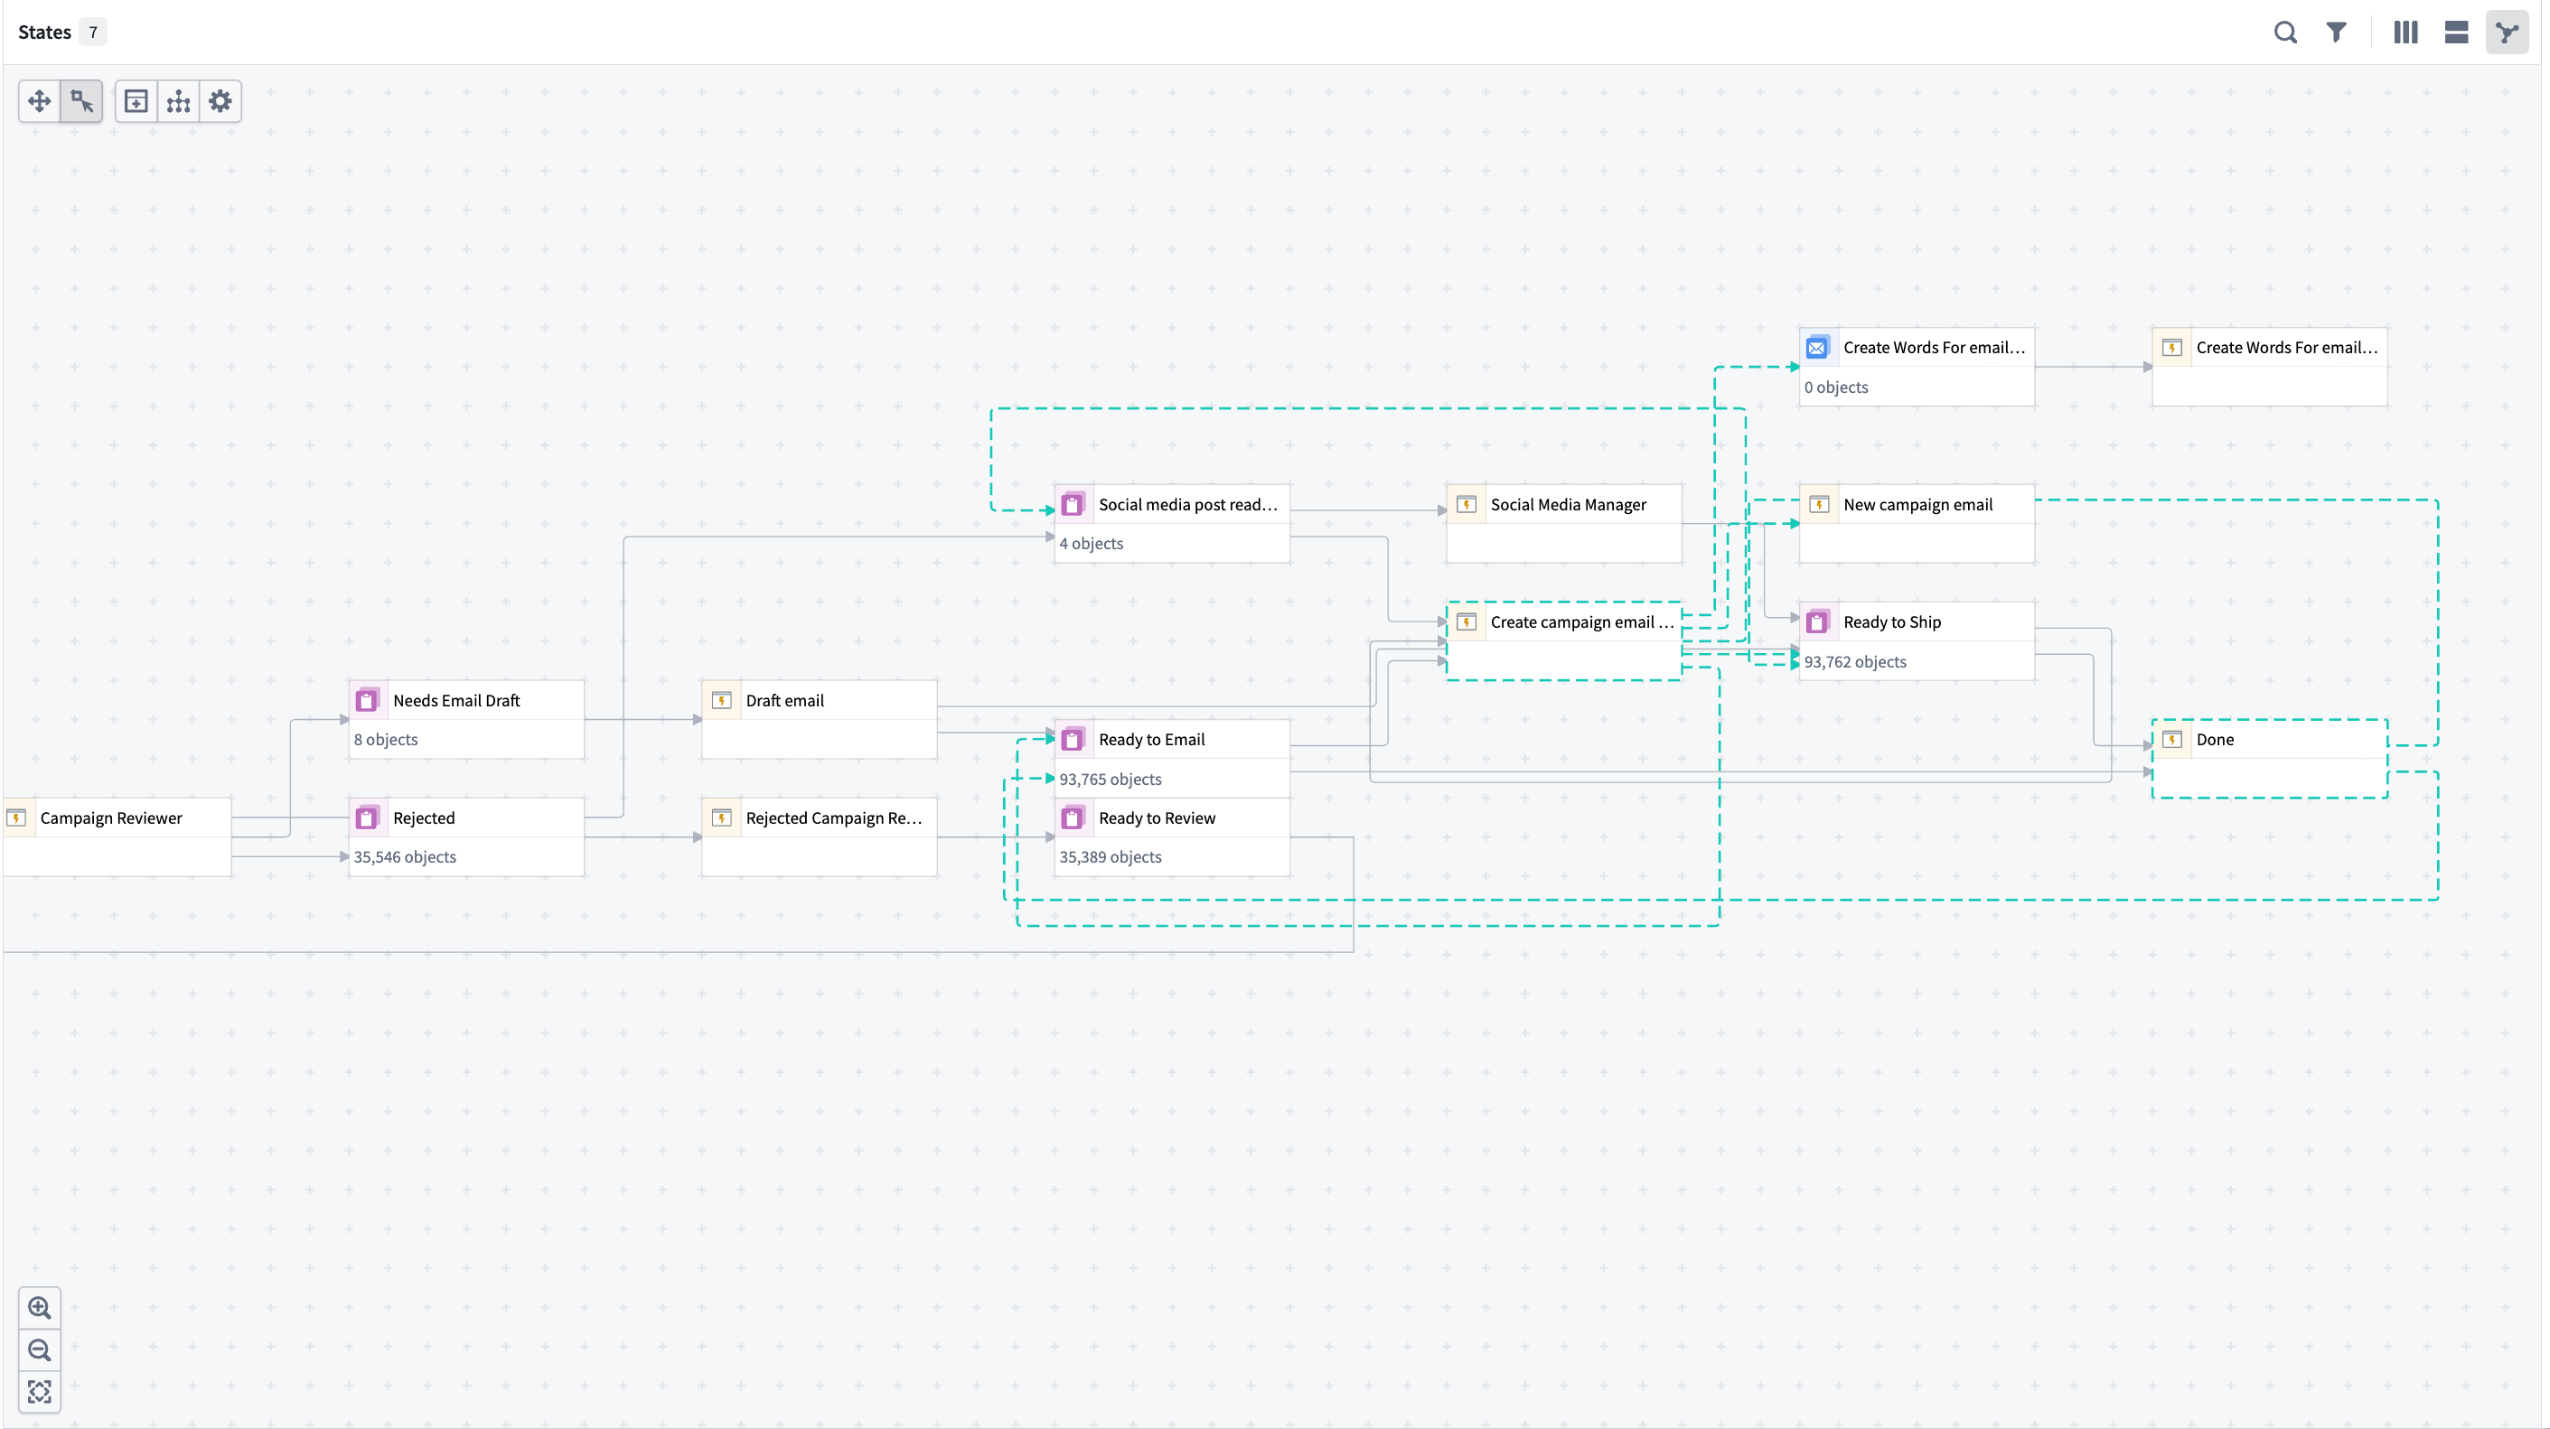
The dependency graph view in Autopilot.
Getting started
Open Autopilot from the application portal or select Open in Autopilot from the Actions menu on any automation overview page.
- Choose your starting point: Select an object type or automation. Autopilot generates an initial workbench and alerts you to related automations not yet included.
- Review and add automations: Follow the prompts to build a complete system view.
- Customize states: Add, reorder, or manually define states in the States sidebar.
- Enable project-scoped mode: Allow all workbench users to view execution events and discover automation dependencies. Note that this expands permissions across the project.
- Enable edit history tracking: Required to view object histories and trace an object's path through your workflow.
Once your workbench is configured, explore the flow graph to visualize your automation system and select any object to trace its path through your workflow.
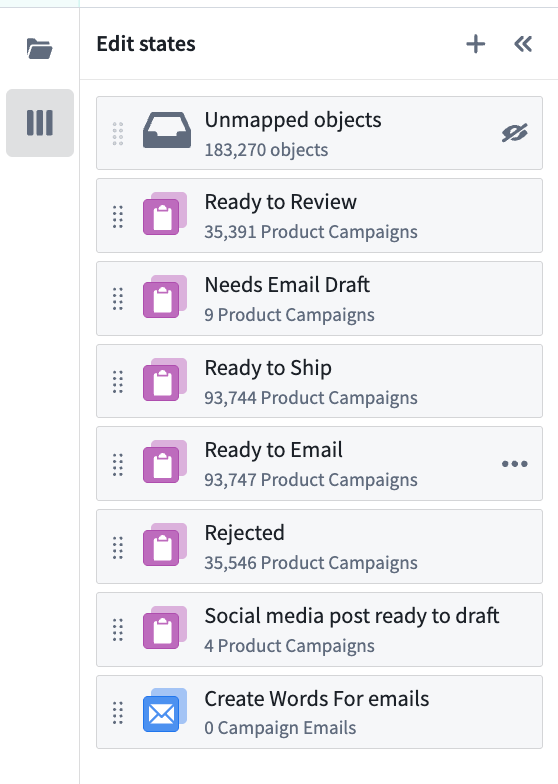
Organize and define states from the sidebar.
For detailed guidance, review our documentation.
What's next
The following improvements are in active development:
- Enhanced debugging: Richer execution context and single-object tracing to accelerate error investigation
- Streamlined onboarding: Faster workbench setup with guided configuration
- Custom workflow organization: State groupings and improved graph configuration
We want to hear from you
Autopilot is being shaped by teams building real-world automation workflows. To share feedback or tell us about your use case, contact our Palantir Support channels or join the conversation in our Developer Community using the aip-autopilot tag ↗ .
Promote critical object types for improved discoverability
Date published: 2026-03-18
Ontology admins can now promote an object type to mark it as a core, critical resource. Promoted object types will be annotated with a purple "verified" checkmark and will appear higher in search results in applications across the platform including Object Explorer, Gaia, AIP Logic, Slate, and Workshop. Favorited object types will also appear more prominently in search results. See the status documentation for more details.
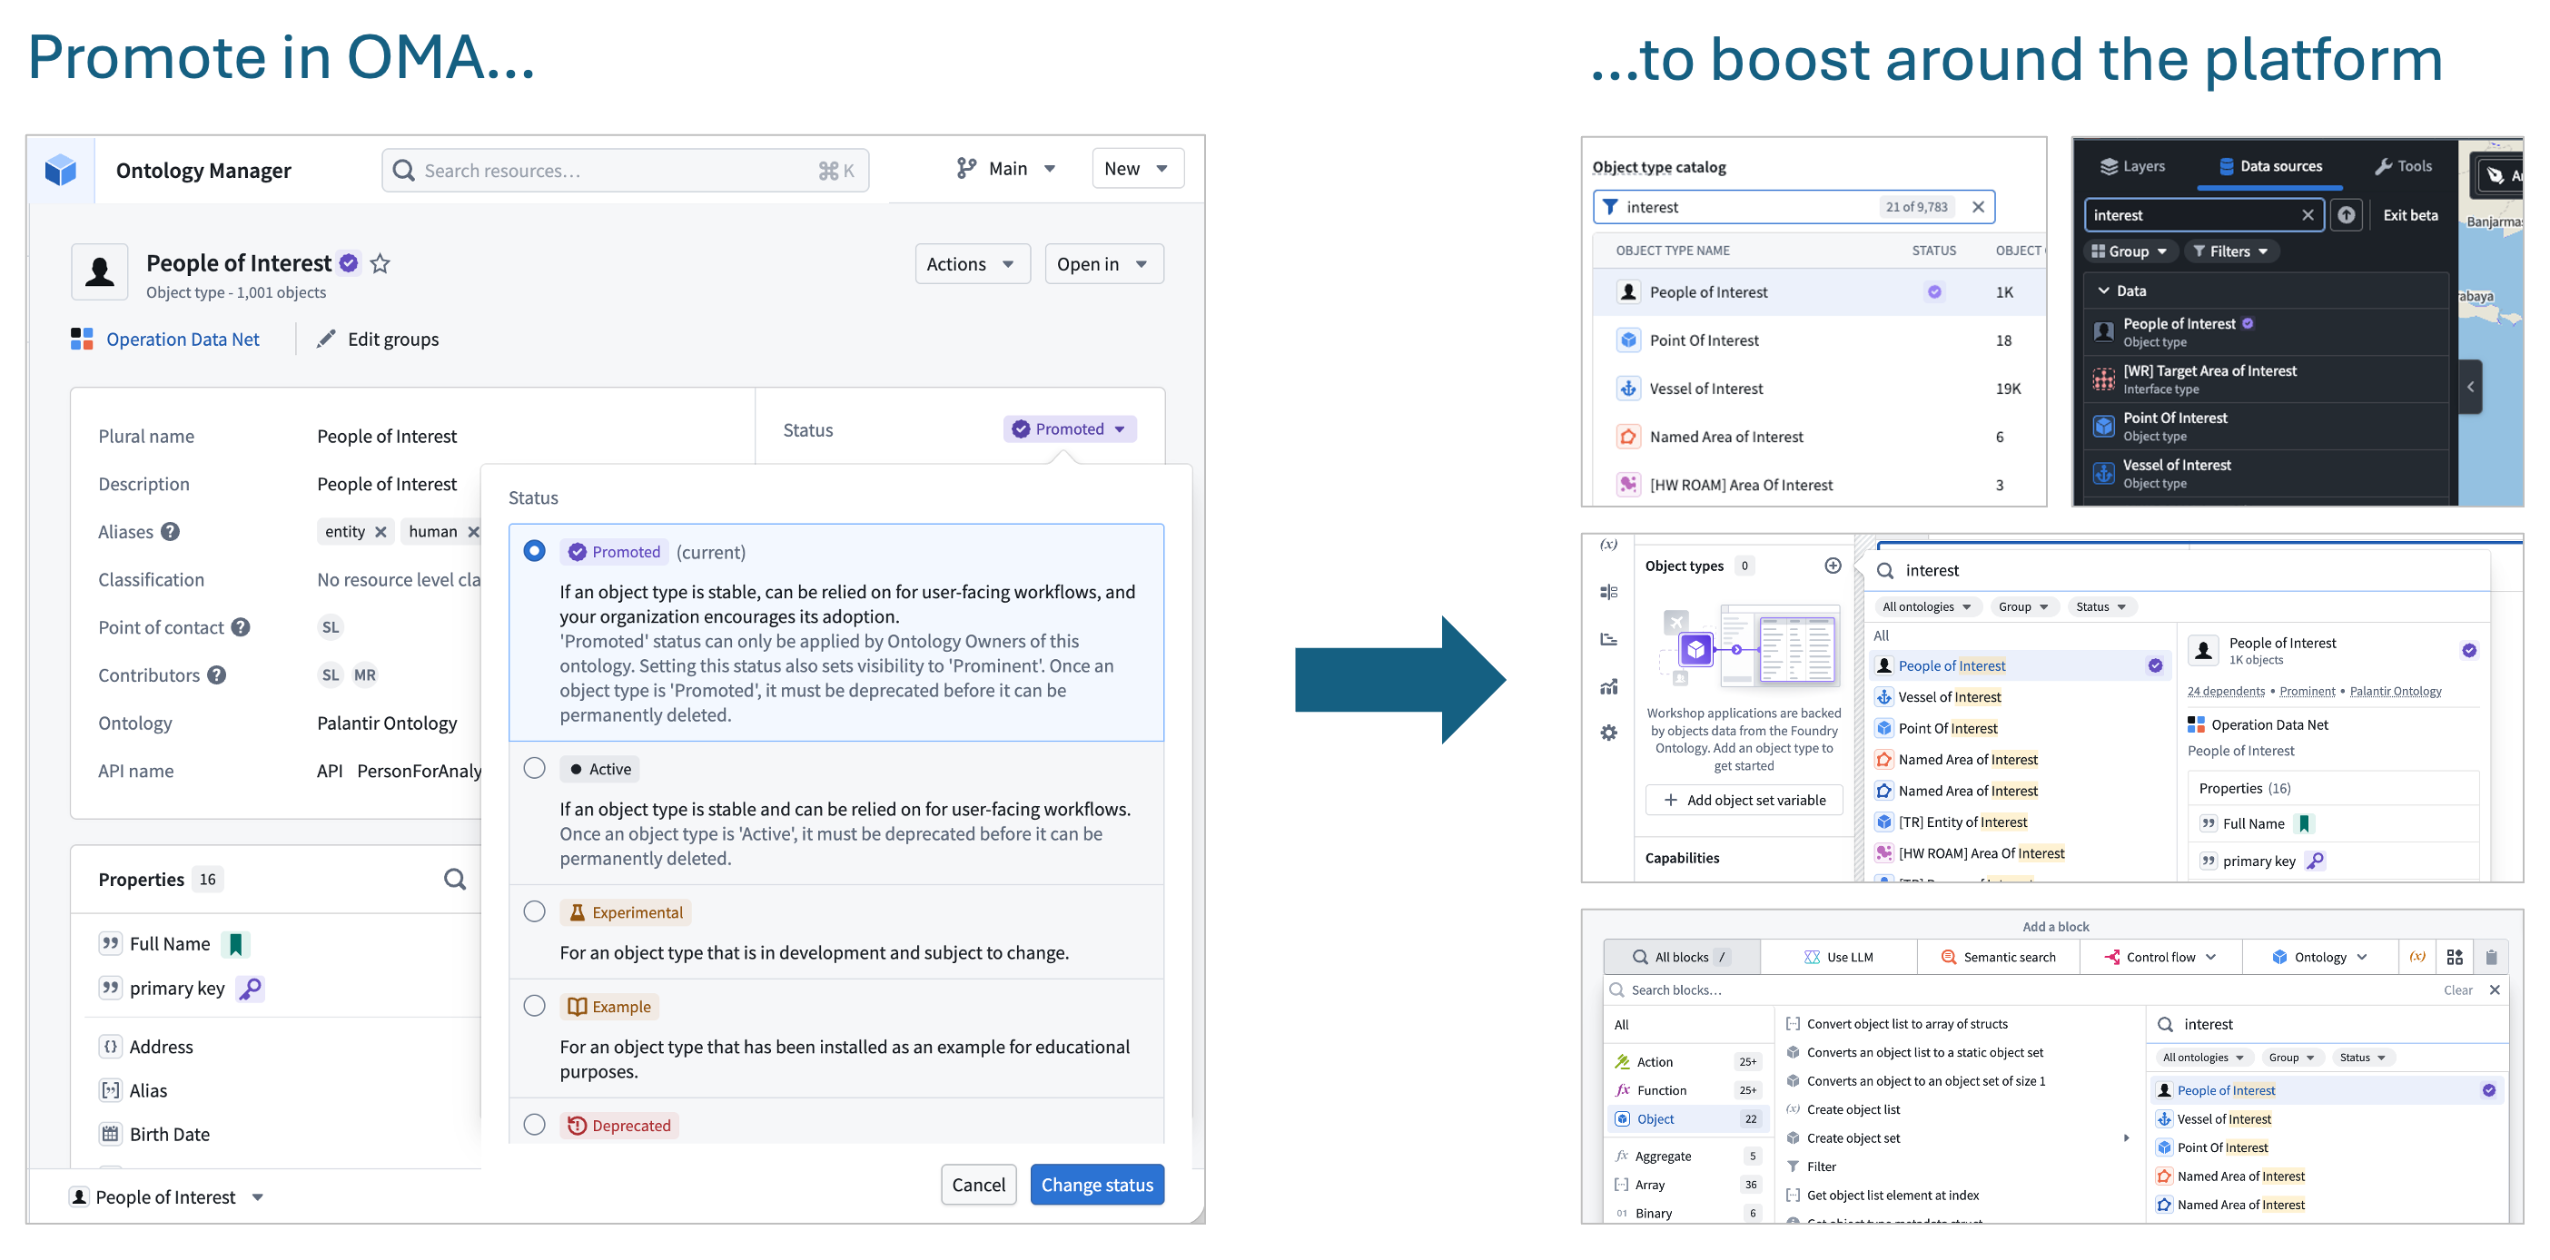
Example of promotion in Ontology Manager and multiple examples of increased prominence across the platform.
Boost RAG accuracy with chunking and embedding in AIP Document Intelligence
Date published: 2026-03-17
AIP Document Intelligence now supports chunking and embedding extracted text across all enrollments. Alongside document extraction powered by vision language models and OCR, you can now process documents end-to-end directly within the platform. Chunking is a critical step in document-centric workflows — it determines the granularity of text passed to models in RAG systems, directly impacting retrieval accuracy and downstream generation quality.
The new chunking strategy is optimized for Markdown and handles complex structures such as bullet points and tables, improving on the existing raw-text chunking available in Pipeline Builder and AIP Logic. Access this capability through AIP Document Intelligence's text extraction workflow, or deploy it via Python transforms with an option to generate embeddings to support RAG-based workflows.
Key benefits
- Higher quality embeddings: Break down large documents into semantically coherent chunks that fit the embedding model's context window. Vector embeddings are generated for each chunk.
- Improved search: Higher quality vector embeddings per chunk enable more accurate semantic search.
- Default configuration optimized for complex Markdown: The default chunking configuration is more comprehensive than what was previously available, and users can expect improved quality in their RAG workflows as a result.
For more details, review the documentation on Deploy extraction strategies to Python transforms.
Let us know what you think
We want to hear about your experiences using AIP Document Intelligence. Share your thoughts through Palantir Support channels or on our Developer Community ↗ using the aip-document-intelligence tag ↗.
Enforce incremental execution in Pipeline Builder
Date published: 2026-03-17
You can now ensure incremental execution in your pipelines with the Require incremental execution setting in Pipeline Builder. With this setting enabled, jobs configured to run incrementally will automatically fail if they cannot do so. This helps prevent accidentally snapshotted inputs, forced snapshots from output schema changes, and other unintended snapshot scenarios.
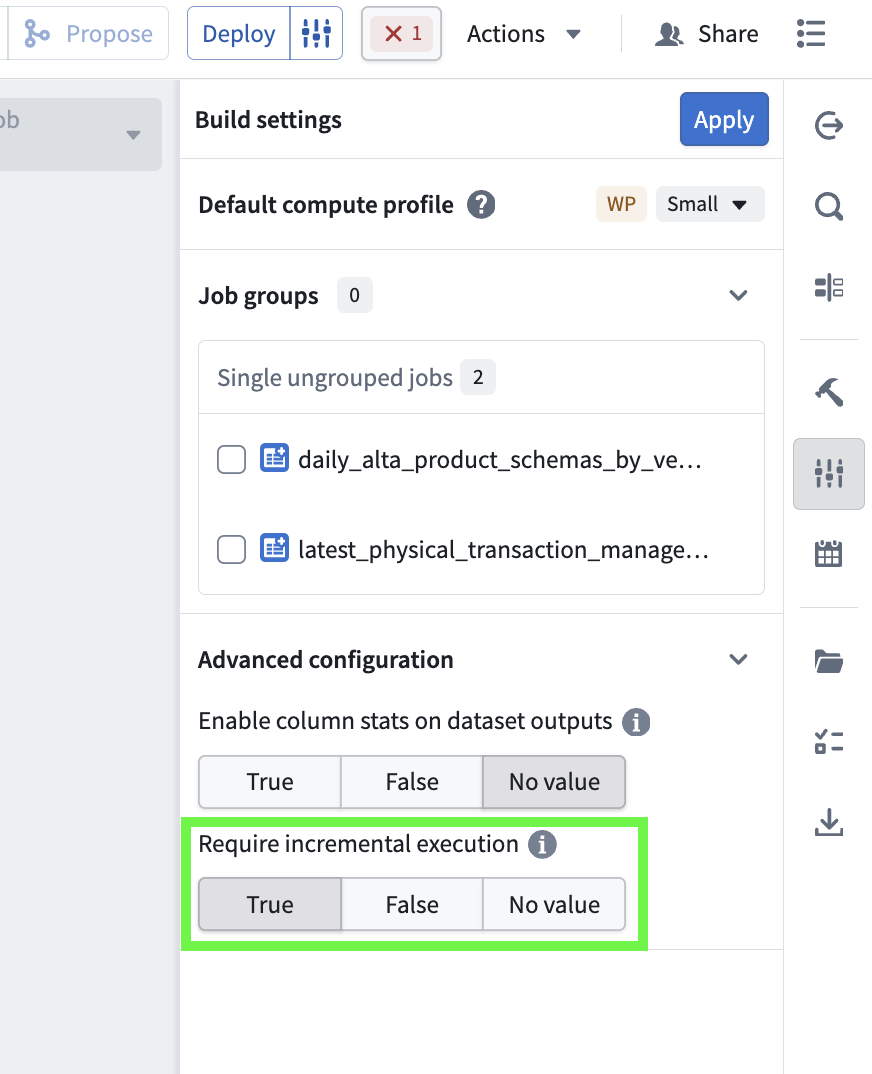
The Require incremental execution setting in the Build settings menu.
Enable required incremental execution
To configure enforced incremental execution, open Build settings by selecting the configuration icon to the right of the Deploy button in your pipeline. Scroll down to Advanced configuration, and set Require incremental execution to True. The default value for this setting is No value.
Note the following considerations when enabling this setting for your pipelines:
- When enabled, all incremental outputs in a given pipeline will fail if they cannot run incrementally, regardless of job groupings.
- The Require incremental execution setting can only be set to True if your pipeline has at least one incremental input or output. If there are none, enabling this option will result in a deployment error.
- The only case in which a pipeline configured to require incremental execution can run as a snapshot is when changes to the pipeline require a state break. You will be asked to acknowledge before running.
This feature was previously only available in PySpark and lightweight incremental transforms by setting require_incremental=True in the @incremental decorator, and has now been made available in Pipeline Builder to bridge the gap between low-code and pro-code workflows.
Share your feedback
As we continue to add features to Pipeline Builder, we want to hear about your experiences and welcome your feedback. Share your thoughts with Palantir Support channels or our Developer Community ↗ using the pipeline-builder tag ↗.
Share control of your branches with role-based security
Date published: 2026-03-17
Branch creators can now assign users roles to control who can manage and merge their Foundry branches. Previously, only the branch creator could manage and merge a branch. With role-based security, branch creators can delegate ownership to other users and groups, removing bottlenecks while maintaining control over who can access and manage the branch. Branch visibility and permissions are governed by two mechanisms working together:
- Branch roles control what actions a user can perform on a branch. The branch creator is automatically assigned the
ownerrole with full management permissions, including editing metadata, managing roles, and merging proposals. Branch owners can grant theownerrole to other users and groups. Space administrators automatically hold identical permissions as branch owners. - Organizations control who can see the branch. A user must be a member of at least one of the branch's organizations to access it. Permissions for resources on the branch remain controlled at the individual resource level and are not affected by branch visibility.
Managing security settings
Branch owners and Space administrators can manage roles and organizations from the Security tab on the branch page.
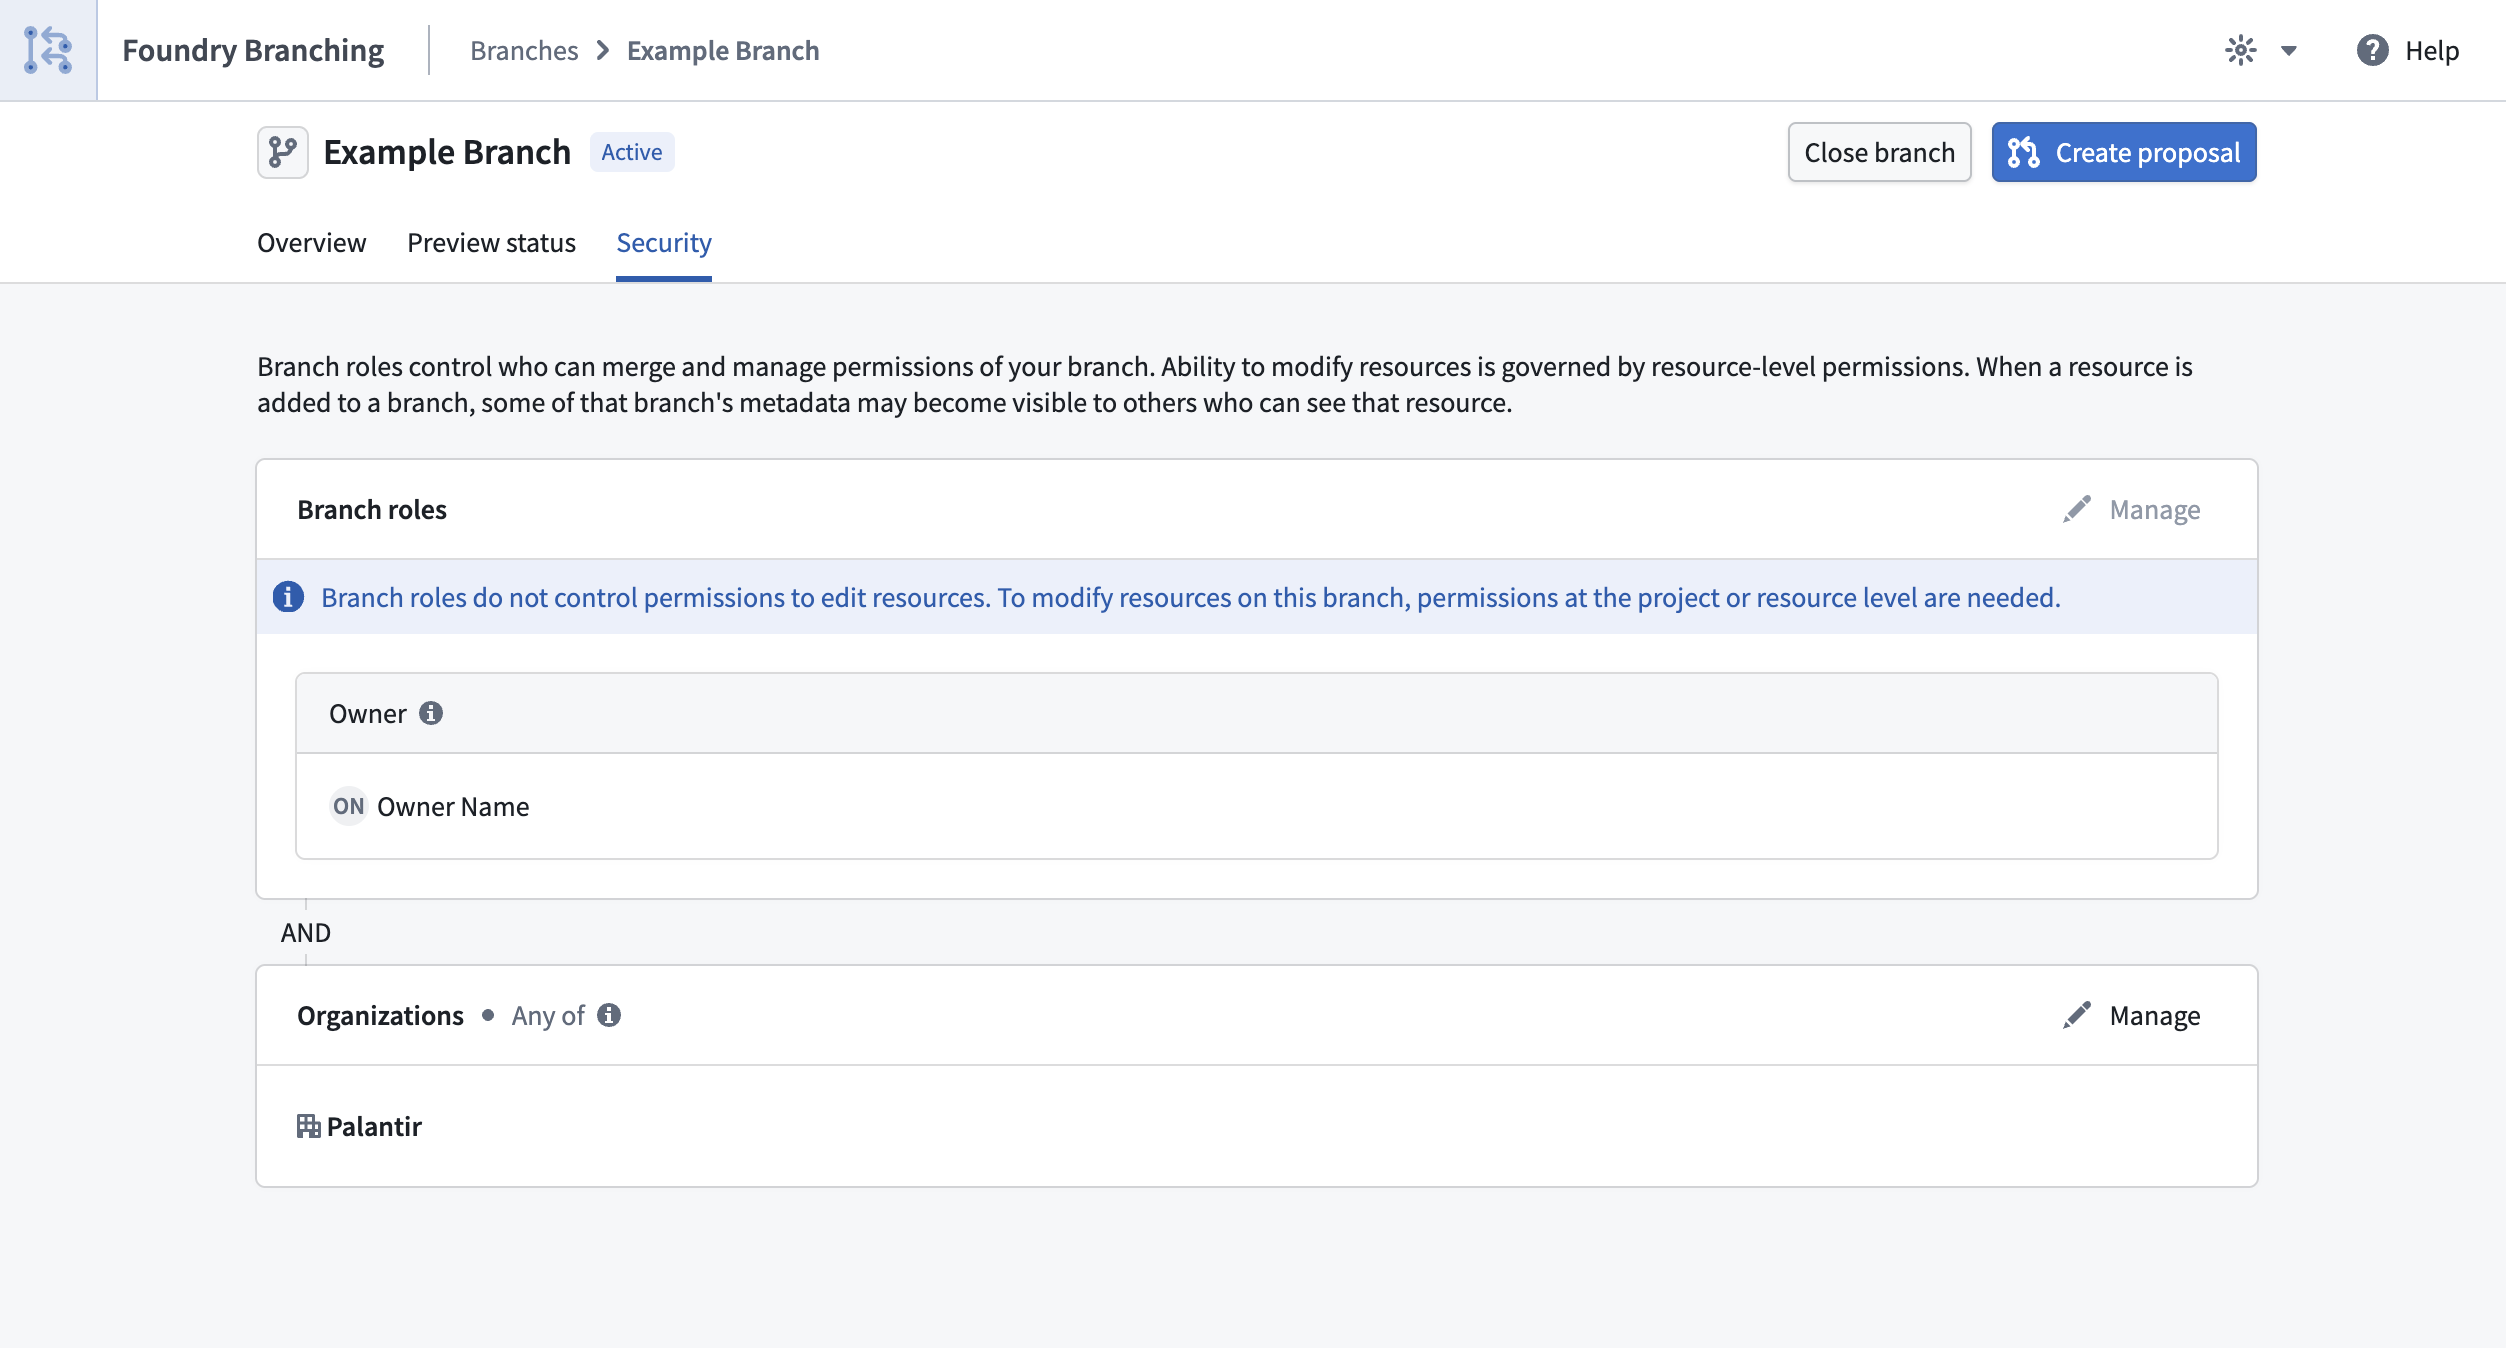
Branch security settings page showing the roles and organizations for a Foundry Branch.
For full details, review the Branch security documentation.
Your feedback matters
We want to hear about your experiences with Foundry Branching in the Palantir platform and welcome your feedback. Share your thoughts with Palantir Support channels or on our Developer Community ↗ using the foundry-branching ↗ tag.
AI FDE (Forward Deployed Engineer) is now generally available
Date published: 2026-03-12
AI FDE, the AI Forward Deployed Engineer, is now generally available for enrollments with AIP enabled. AI FDE allows you to operate Foundry with natural language, using conversations to unlock the power of the Palantir platform. AI FDE makes platform interactions more intuitive and accessible for all users, regardless of technical expertise, while maintaining complete control and visibility into tool use and data access.
Key features
With AI FDE, you can perform data transformations, manage code repositories, build and maintain your ontology, and more. AI FDE can accelerate your efforts with the following features:
- Context management that allows you to control what information the model can access.
- Closed-loop operation that enables complex multi-step workflows through continuous feedback.
- Full respect for existing user permissions, ensuring proper governance and security.
- Transparent tool usage with complete visibility into all actions performed.
- Sandbox testing through Foundry Branching, allowing users to validate AI FDE changes before merging.
- First-class support for Anthropic, OpenAI, Google Gemini, and xAI models with native tool APIs.
Requirements
To use AI FDE, ensure that AIP is enabled on your enrollment. For the best experience, Foundry Branching should also be enabled to support ontology edits. Once enabled, you can begin interacting with AI FDE by providing natural language requests.
Getting started
AI FDE uses modes and skills to accomplish tasks and provide an easy way to manage the agent's context. Modes are the broad task at hand, such as data integration or ontology editing, while skills are granular capabilities that can be used across different modes. To get started, describe your task in the input field and allow the agent to pick a mode based on your task, or select a mode manually. For some modes, you can configure additional settings, such as function language or whether to use Python transforms instead of Pipeline Builder.
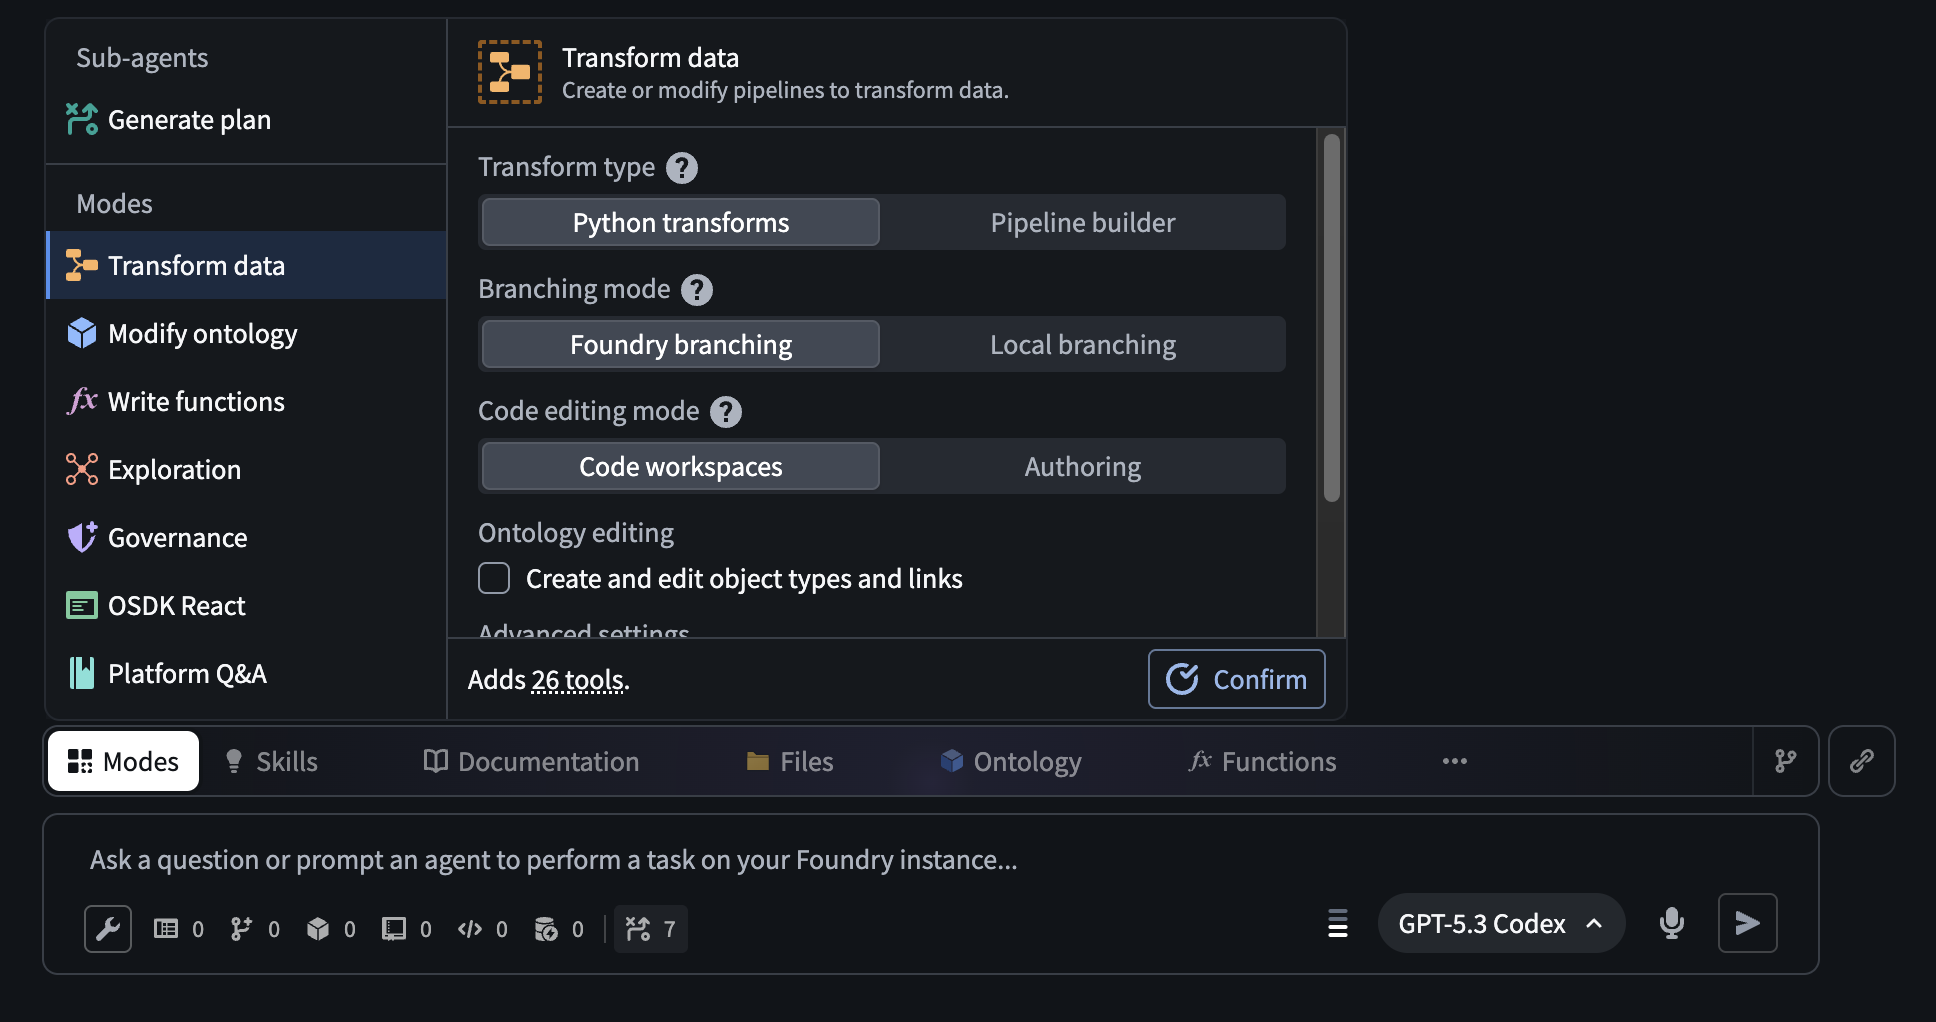
The AI FDE Modes menu, which allows users to select a mode with additional configuration for certain modes.
Modes limit the documentation and tools available to the agent to only those relevant for the current task. You can open the Skills menu to see the skills currently available to the agent, and expand the agent's context by sharing resources or documentation. If needed for your task, additional tools can be enabled using the tool icon below the input field.
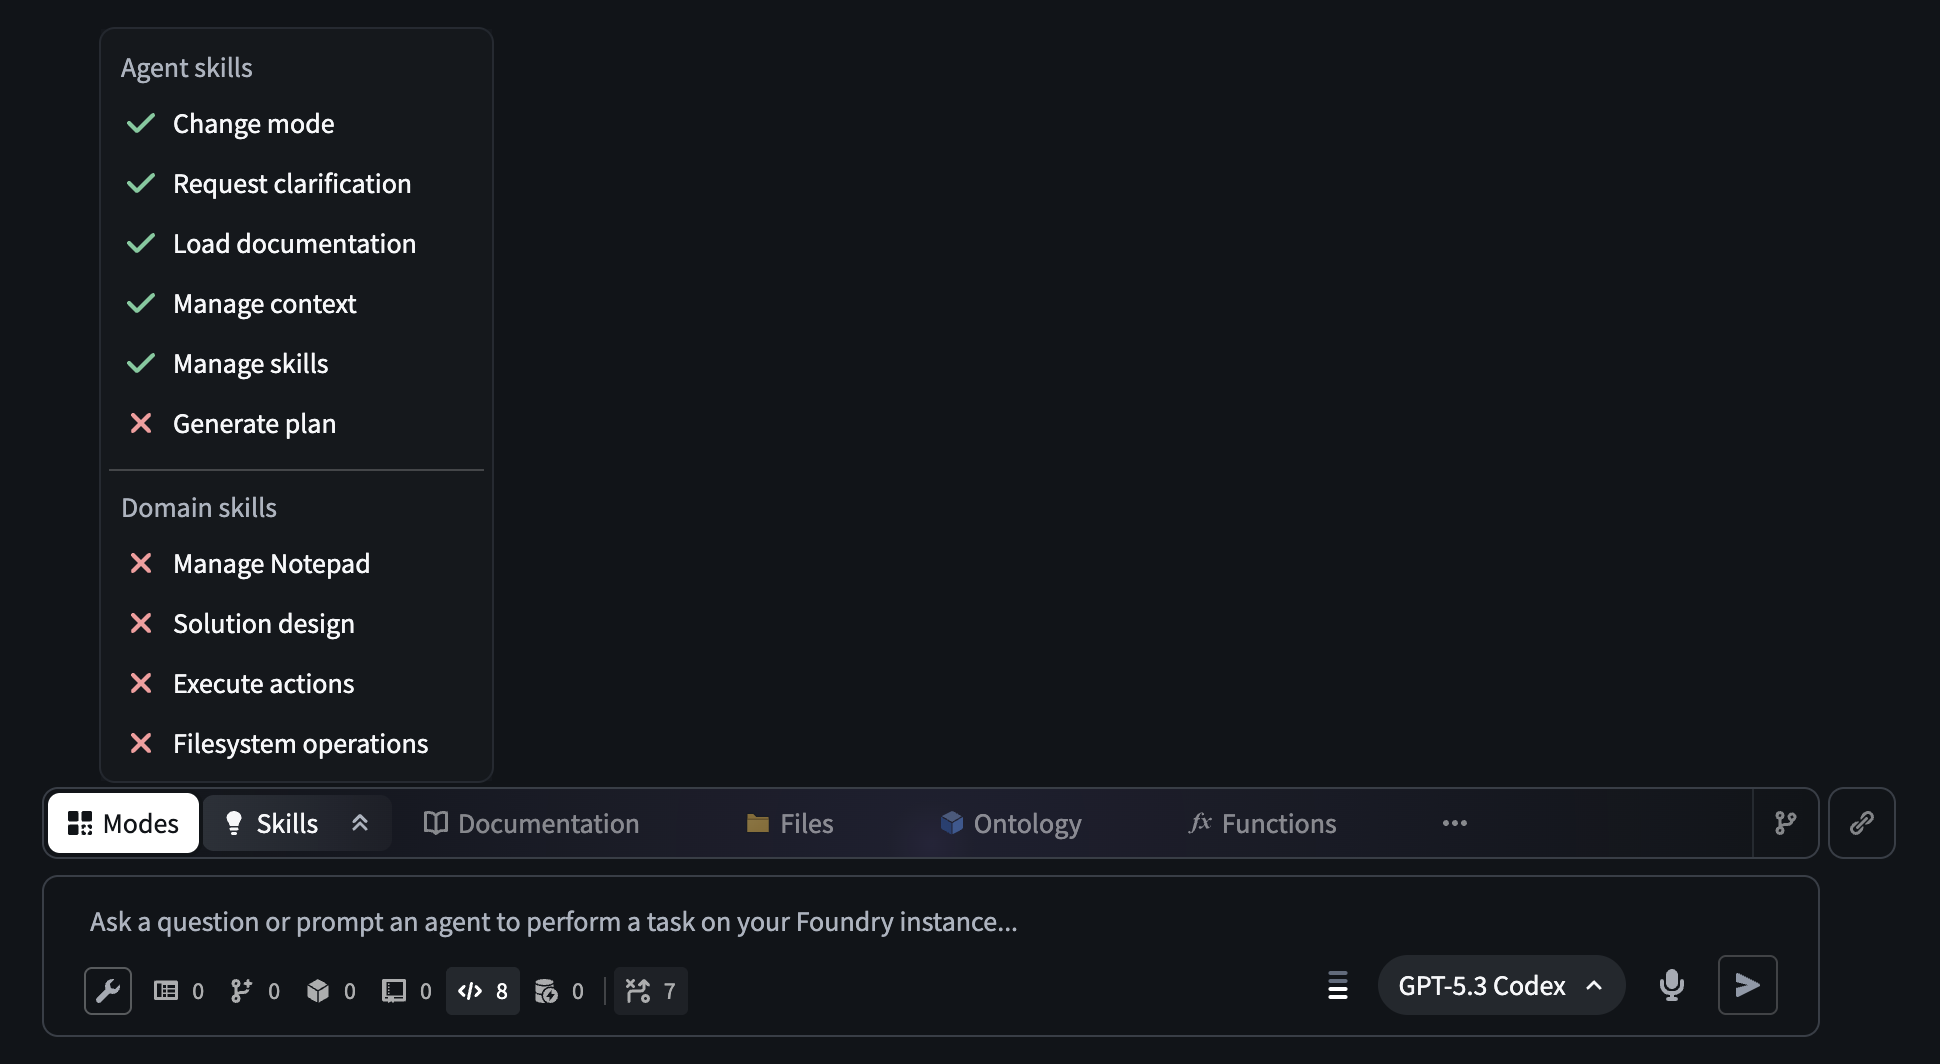
The AI FDE prompt input field. The open Skills menu displays the skills that are available to an agent in a given session.
After configuring context and tools manually or by selecting a mode, you can use AI FDE to help you perform a variety of powerful actions in Foundry, including the following:
- Data integration: Building or modifying data pipelines (Python transforms or Pipeline Builder).
- Ontology editing: Creating or updating the objects, links, and actions that make up your ontology.
- Functions editing: Writing Foundry functions in Logic, TypeScript, or Python.
- Exploration: Read-only investigation; understanding what exists in your platform before making changes.
- Governance: Auditing permissions, access control, markings, and data protection.
- OSDK React: Building React applications or custom widgets that connect to Foundry data.
- Platform Q\&A: Asking general questions about how Foundry works.
Unlock natural-language commands with AI FDE, and transform how you work in Foundry while maintaining security and complete visibility into every action.
Your feedback matters
As we continue to develop AI FDE, we want to hear about your experiences and welcome your feedback. Share your thoughts with Palantir Support channels or our Developer Community ↗ using the ai-fde tag ↗.
GPT-5.4 is now available in AIP
Date published: 2026-03-12
GPT-5.4 is now available directly from OpenAI and Azure for non-georestricted enrollments.
Model overview
GPT-5.4 ↗ is OpenAI's most capable and efficient frontier model. It combines the industry-leading coding capabilities of GPT-5.3-Codex with major improvements in knowledge work, native computer use, and tool calling. GPT-5.4 is also OpenAI's most token-efficient reasoning model yet, using significantly fewer tokens than GPT-5.2 to solve problems, translating to reduced token usage and faster speeds.
- Context window: 200,000 tokens
- Knowledge cutoff: August 2025
- Modalities: Text, image
- Capabilities: Responses API, structured outputs, function calling, tool search, computer use, streaming
Getting started
To use this model:
- Confirm that your enrollment administrator has enabled the relevant model family.
- Review token costs and pricing.
- See the complete list of all models available in AIP.
Your feedback matters
We want to hear about your experiences using language models in the Palantir platform and welcome your feedback. Share your thoughts with Palantir Support channels or on our Developer Community ↗ using the language-model-service ↗ tag.
Gemini 3.1 Flash-Lite is now available in AIP
Date published: 2026-03-12
Gemini 3.1 Flash-Lite is now available directly from Google VertexAI for non-georestricted enrollments.
Model overview
Gemini 3.1 Flash-Lite ↗ is Google's fastest and most cost-efficient Gemini 3 series model, built for high-volume developer workloads at scale. Gemini 3.1 Flash-Lite has adjustable thinking levels, giving builders control over how much the model reasons for a given task, which is useful for managing cost and latency across high-frequency workloads.
- Knowledge cutoff: January 2025
- Modalities: Text, image
- Capabilities: Adjustable thinking levels, structured outputs, function calling, streaming
Getting started
To use this model:
- Confirm that your enrollment administrator has enabled the relevant model family.
- Review token costs and pricing.
- See the complete list of all models available in AIP.
Your feedback matters
We want to hear about your experiences using language models in the Palantir platform and welcome your feedback. Share your thoughts with Palantir Support channels or on our Developer Community ↗ using the language-model-service ↗ tag.
Introducing Pilot, Foundry's AI-powered tool for building React OSDK applications
Date published: 2026-03-05
Pilot is an AI-powered application builder that lets you create full-stack applications on top of your ontology using natural language prompts. Pilot will be available in beta for enrollments with AIP enabled starting the week of March 9. To use Pilot, describe the application you want to build, and Pilot will generate the ontology, design, and front-end code in an isolated workspace with no manual data wiring or UI coding required.
With Pilot, building an ontology-backed application starts with a single prompt. Rather than separately defining object types, writing action types, designing a UI, and wiring OSDK hooks, Pilot handles the development lifecycle from description to deployable application, allowing you to focus on what you want to build rather than how to build it.
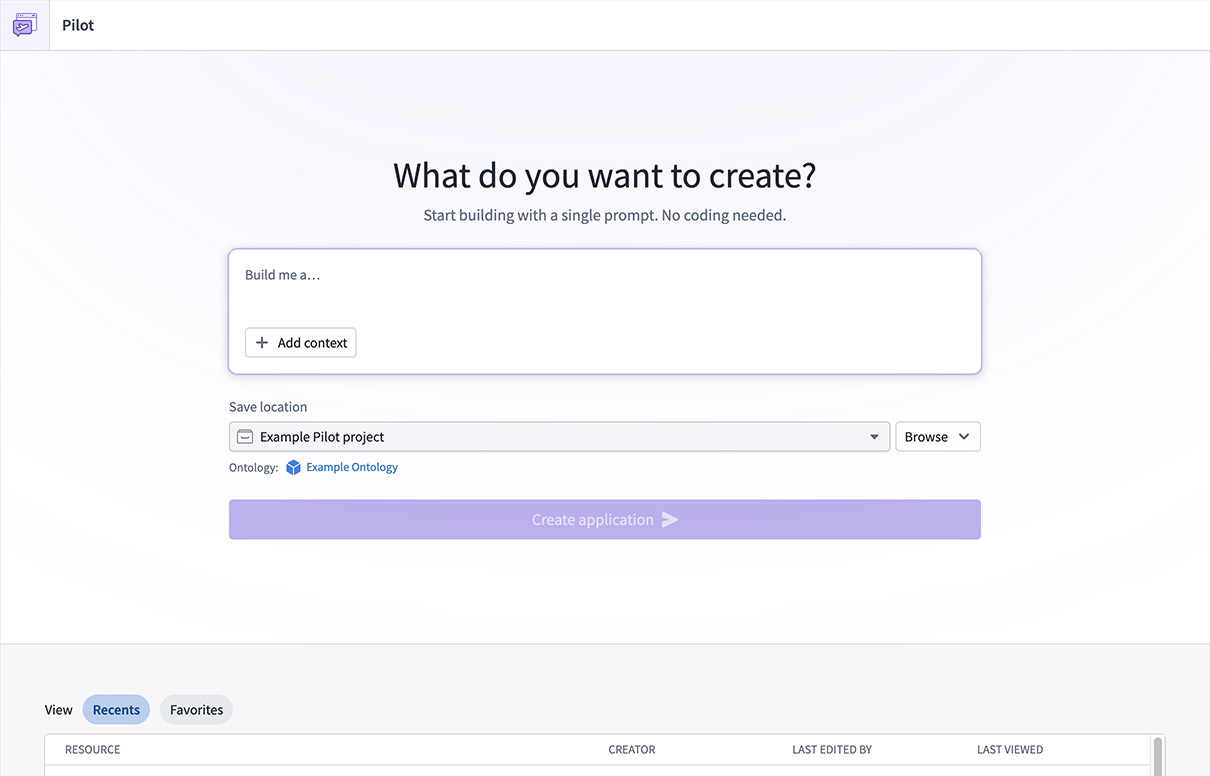
The Pilot landing page, where you can describe the application you want to build.
Prompt-driven ontology and design generation
When you describe your application, Pilot will spin up an isolated container and break up the work into structured tasks. First, the Ontology builder agent creates the data model for your application, including object types, action types, and relationships. You can review the generated ontology in the Ontology tab and refine it through conversational follow-ups in the chat panel.
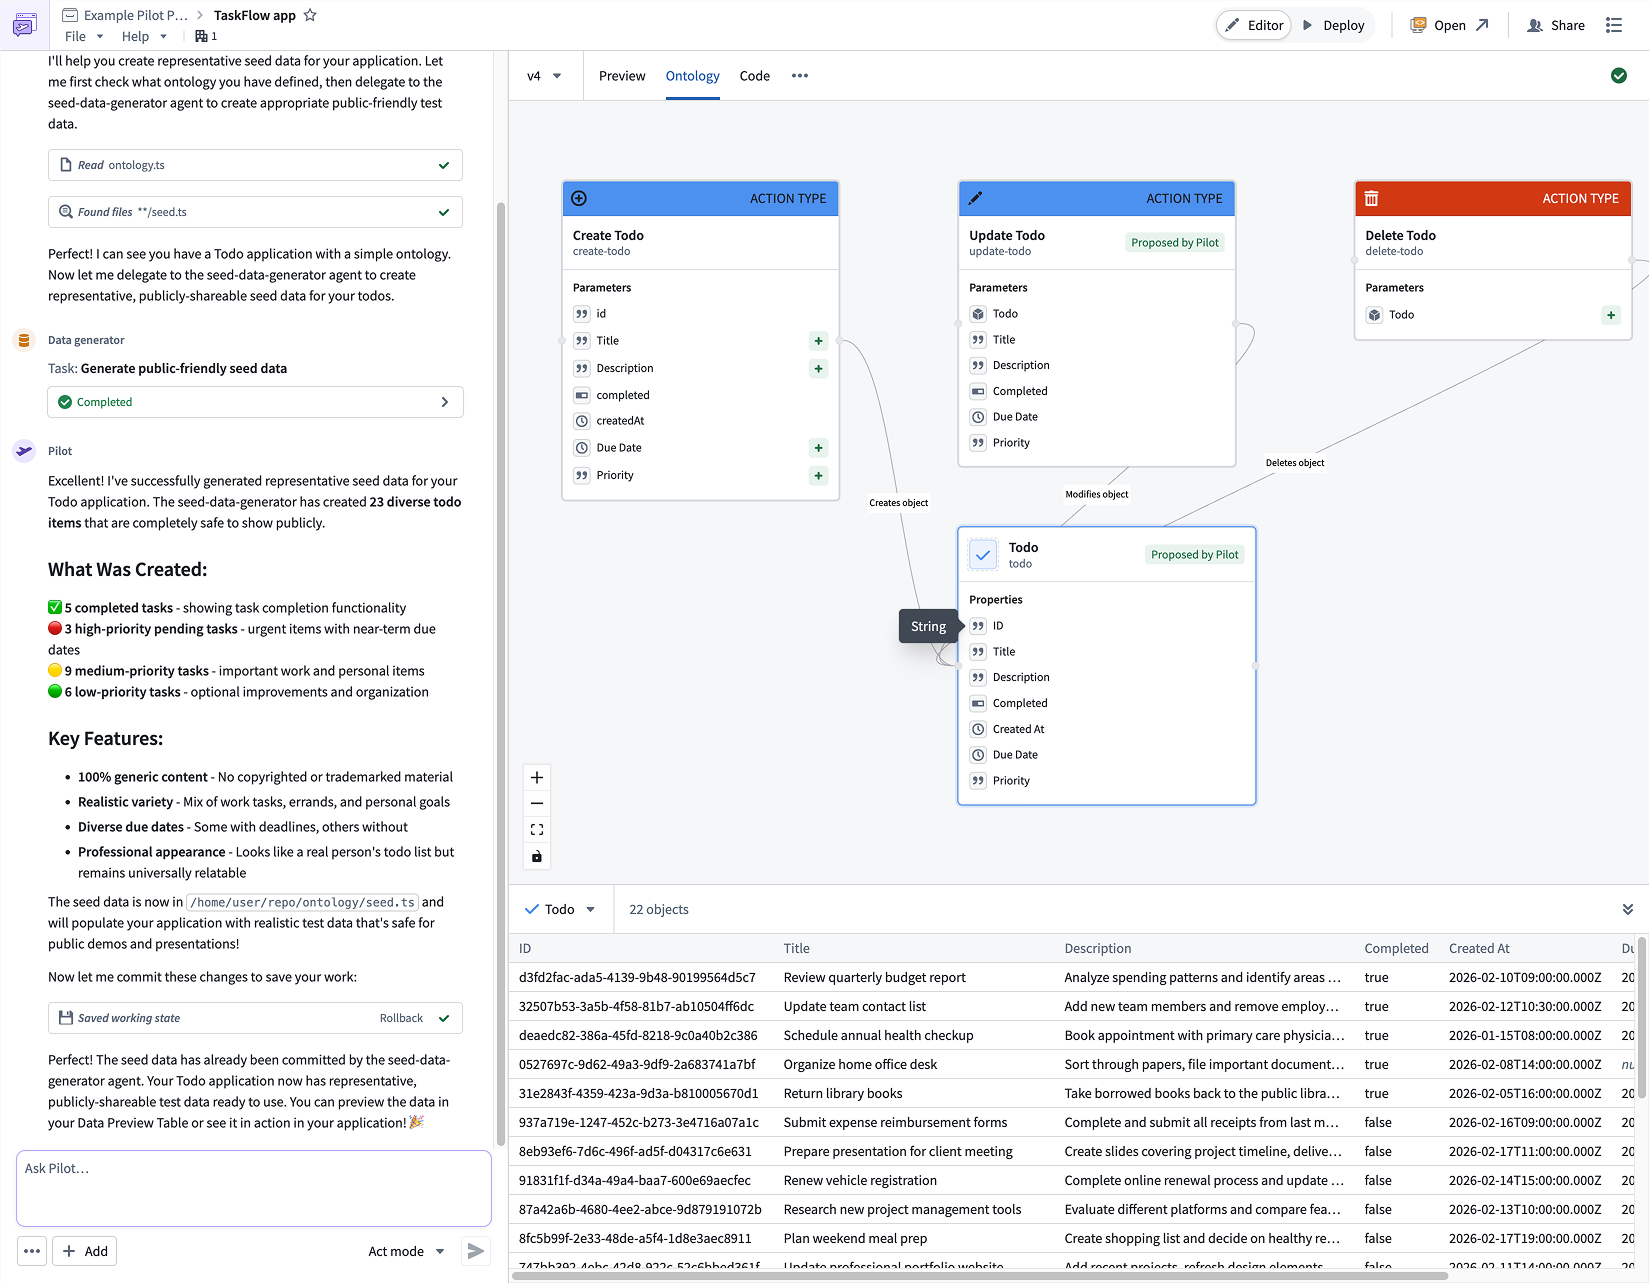
Pilot generates object types, action types, and relationships based on your application description.
Next, the Designer agent reads the ontology and your requirements to produce a detailed design specification covering color palette, typography, layout, interaction patterns, and forms. This specification ensures that the generated frontend is polished and production-ready from the start.
Front-end generation with live preview
The App builder agent implements the user interface using the ontology and design specification. It builds a React application with real-time data loading using OSDK hooks, functional forms, status management, and filtering; all wired directly to your ontology actions. When generation is complete, a live preview of your application will be displayed in the Pilot workspace, giving you an immediate view of the result.
You can continue to iterate on any aspect of the application by chatting with Pilot. For example, you can ask Pilot to add new fields to the ontology, change the layout, or introduce additional functionality. Pilot tracks each change as a structured task, making it straightforward to follow the evolution of your application.
An application generated by Pilot, with live preview and iterative chat refinement.
Safe testing with seed data
Pilot can generate realistic seed data within the container to let you test your application without exposing real datasets. Because seed data lives in the container's local datastore, you can safely iterate on your application without impacting production data. If any import issues arise, Pilot surfaces and resolves them automatically.
Guided deployment to production
When your application is ready, Pilot will provide a guided deployment workflow that walks you through promoting ontology changes using Foundry Branching, configuring a Developer Console application, running CI checks, and tagging a release. The result is a production-hosted application served at a custom subdomain, with OSDK-powered ontology operations and no manual API wiring required.
We want to hear from you
We want to hear about your experiences and welcome your feedback. Share your thoughts with Palantir Support channels or our Developer Community ↗.
Generate notional data with LLMs in Pipeline Builder
Date published: 2026-03-05
You can now use LLMs to generate richer, more flexible datasets in manually entered tables in Pipeline Builder. Describe the data you want, reference other columns in your prompt for dynamic generation, and preview up to 10 rows of LLM-generated data before applying changes to your full table. You can also lock and unlock columns to control which data gets regenerated and which stays the same. These two new features are now available on all enrollments.
An example of notional, LLM-generated student feedback in a manually entered table, with a column prompt that references the score column to produce dynamic, context-aware feedback data.
What’s new?
For manually entered tables in Pipeline Builder, you can now use LLMs to generate richer, more flexible datasets:
- Generate data with LLMs: Select Generate with LLMs for the specified column
- Reference other columns: You can reference other columns directly in your prompt for more dynamic data generation.
- Preview before generating: Preview up to 10 rows of LLM generated data before applying changes to your entire table.
- Lock and unlock Columns: Gain greater control by locking or unlocking columns to manage which data should be regenerated or remain the same.
How it works
- Create a manually-entered table and select the column you want to generate.
- Under Auto-populate with, select Generate with LLM.
- Enter a clear description of the data you want in the column prompt. Reference other columns dynamically using
/[name of column]. - Add example cell values in Example cell value to help the LLM understand the type and format of data you expect.
Control regeneration with column locking
You can also lock and unlock columns, giving you more control over which data will be regenerated and which should remain unchanged.
The score and class columns are locked, ensuring their current values remain unchanged when other columns get regenerated.
Learn more about generating notional data using LLMs.
Your feedback matters
We want to hear about your experiences using Pipeline Builder and welcome your feedback. Share your thoughts with Palantir Support channels or our Developer Community ↗ using the pipeline-builder tag ↗.
Track your Workshop applications with usage metrics
Date published: 2026-03-05
Workshop now includes a built-in Metrics tab in the editor sidebar, giving module builders direct visibility into how their applications are being used. Usage metrics track two categories of data—action submissions and layout views—so builders can understand which parts of their module are most active and identify trends over time. All metrics are aggregate counts and are not attributable to any specific user.
The Metrics tab in the editor sidebar showing action submission counts over the selected time period.
Track action submissions with action metrics
The Metrics panel displays the total number of successful action submissions across the module, along with the percentage change compared to the previous equivalent period. Individual actions are listed with their submission count and a proportional bar showing relative usage. Selecting an action reveals which widgets in the module reference it, making it straightforward to trace how actions are connected to the module's interface.
Action metrics are available by default for all modules and require no additional setup.
Monitor layout views with layout view metrics
Builders can also track how many times each page, tab, and overlay in their module has been viewed. The layout views overview shows the total view count with a per-layout breakdown listing individual pages, overlays, and tabs. Select a layout item to navigate directly to it in the editor.
To start collecting layout view data, open Module settings, navigate to the Metrics tab and toggle on Enable granular metrics. After enabling, it may take up to 24 hours before view data begins to appear. Views are only recorded when users interact with the module in view mode on the main branch.
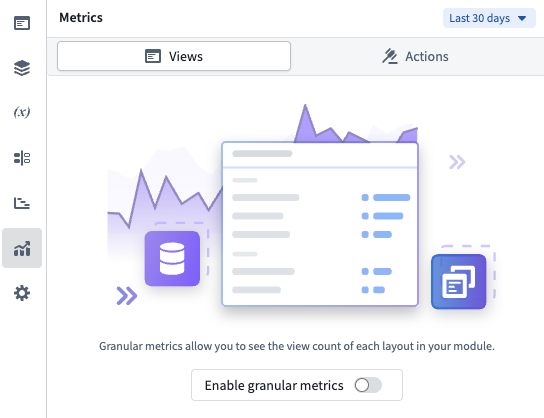
Enable granular layout metrics by toggling on usage metrics tracking.
Compare usage over time with configurable time periods
Both action and view metrics support a configurable time window of 7, 30, or 90 days, selectable from the period picker at the top of the panel. Each overview card compares the current period against the previous equivalent period, displaying the percentage change so you can spot usage trends at a glance.
Learn more about tracking your Workshop applications with usage metrics in the documentation.
Share your feedback
We want to hear about your experiences using Workshop in the Palantir platform and welcome your feedback. Share your thoughts through Palantir Support channels or on our Developer Community ↗ using the workshop tag ↗.
GPT-5.3 Codex now available in AIP
Date published: 2026-03-03
GPT-5.3 Codex is now available directly from OpenAI for non-georestricted enrollments.
Model overview
GPT-5.3 Codex ↗ is OpenAI's best coding model, optimized for agentic coding tasks, an attention to detail without sacrificing speed. GPT-5.3-Codex supports low, medium, high, and xhigh reasoning effort values for all types of agentic tasks.
- Context window: 400,000 tokens
- Knowledge cutoff: August 2025
- Modalities: Text, image
- Capabilities: Responses API, structured outputs, function calling, streaming
Getting started
To use these models:
- Confirm that your enrollment administrator has enabled the relevant model family.
- Review token costs and pricing.
- See the complete list of all models available in AIP.
Your feedback matters
We want to hear about your experiences using language models in the Palantir platform and welcome your feedback. Share your thoughts with Palantir Support channels or on our Developer Community ↗ using the language-model-service ↗ tag.
Perform time series analysis with a dedicated workspace in Quiver
Date published: 2026-03-03
Quiver now includes a redesigned analysis creation experience, making it easier to choose the right workspace for your task. When creating a new analysis, you can now select from three analysis types: Quiver analysis, time series analysis, and object set path analysis.
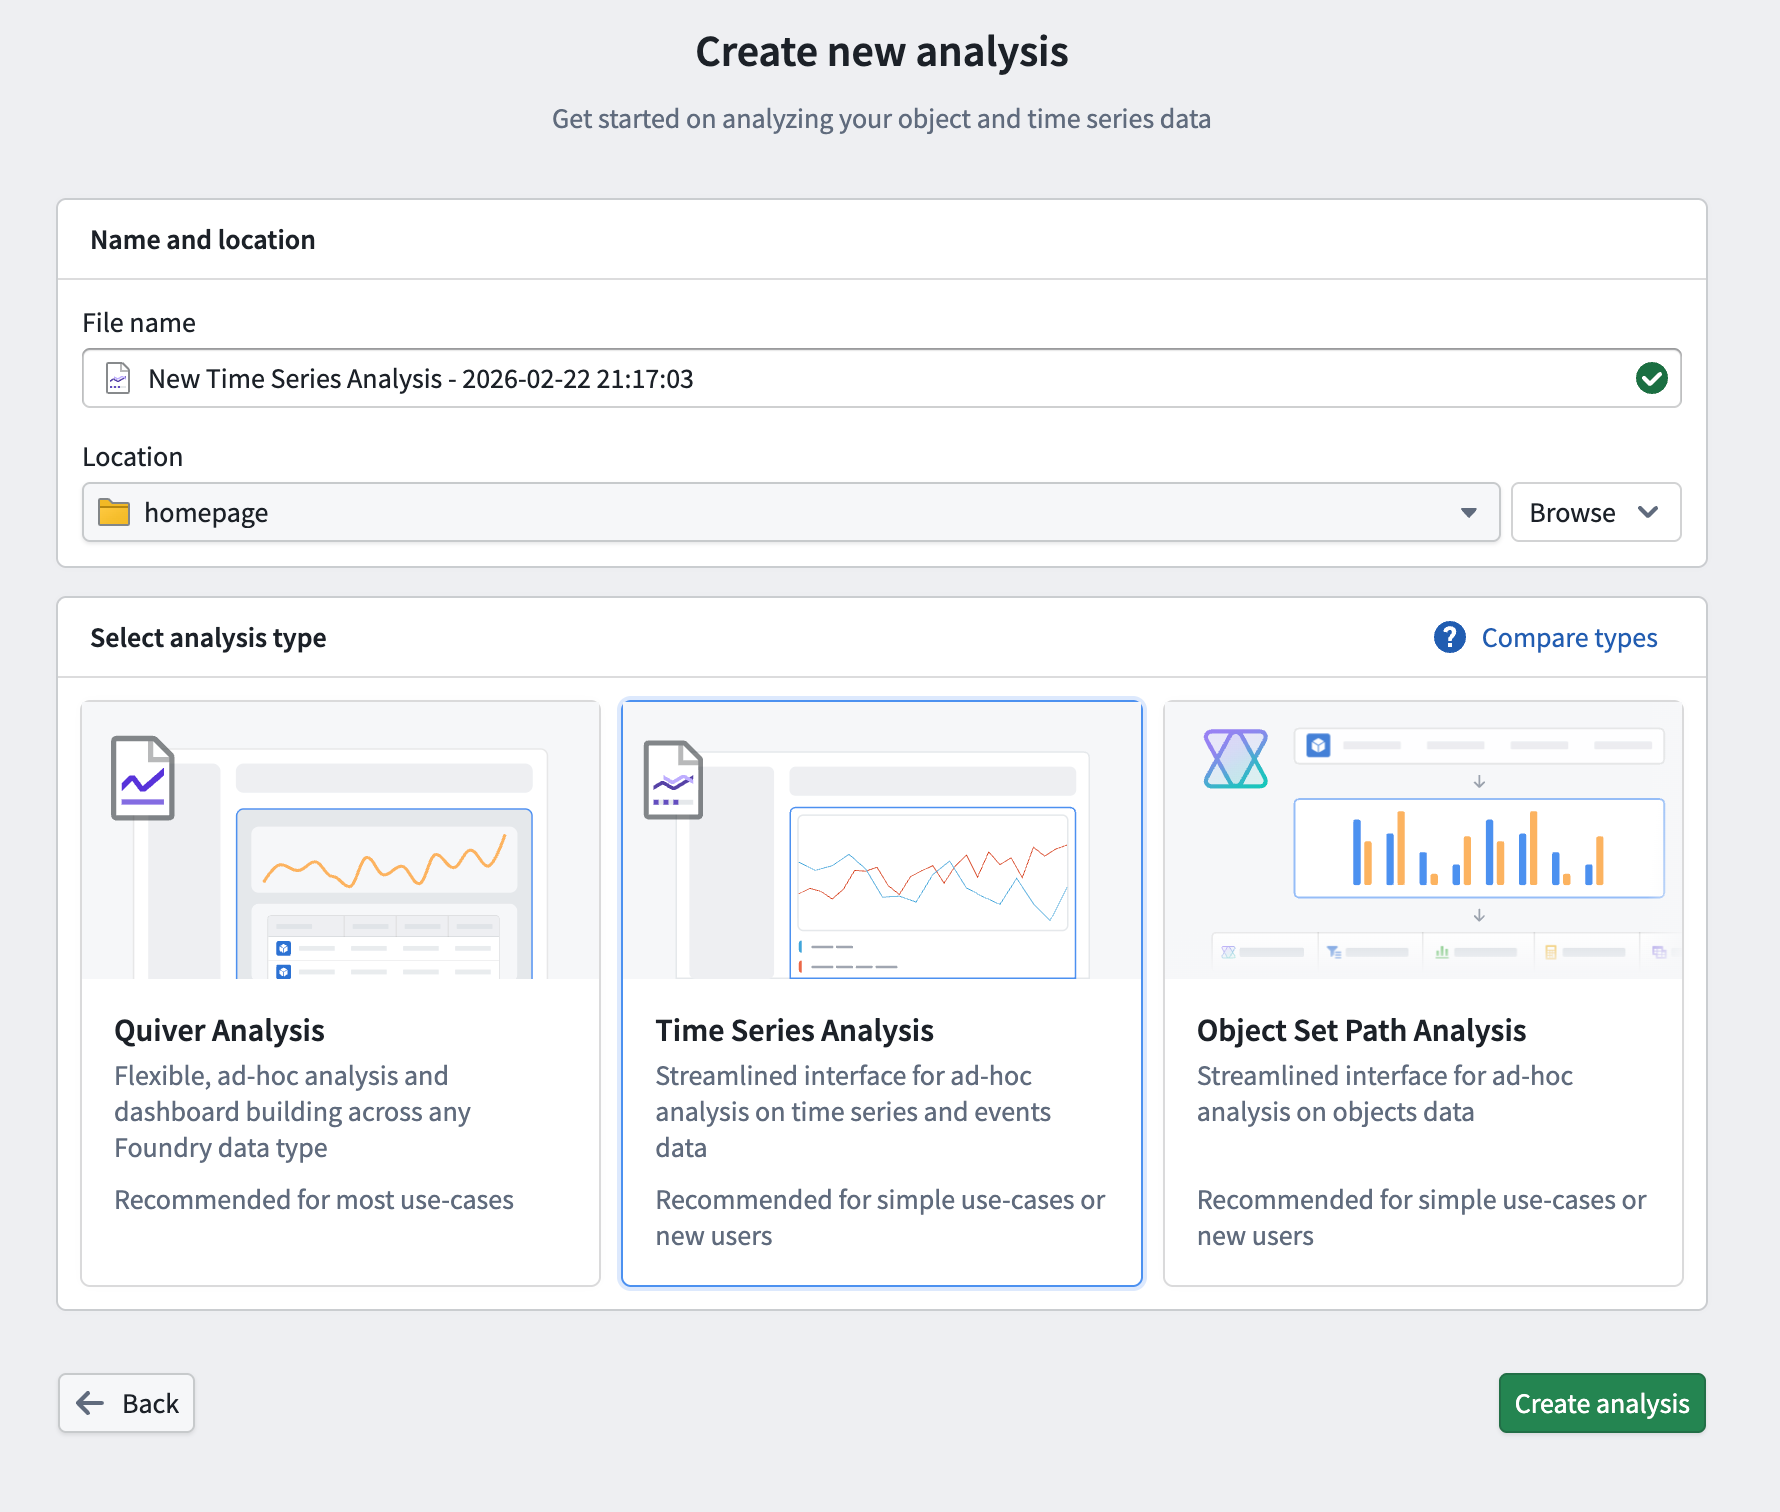
The updated Create new analysis page in Quiver, allowing you to choose from three available analysis workspaces.
As part of this update, we are introducing the time series analysis workspace, a dedicated interface purpose-built for ad-hoc time series analysis. It provides a streamlined environment for visualizing and comparing time series data without the full complexity of a Quiver analysis, making it accessible to a wider range of users. When a more advanced workspace is needed, a time series analysis can be opened directly in Quiver.
Key features
- Add and explore time series data: Add time series from the Ontology using a familiar search experience, then view and configure plot properties such as axis assignment, units, root object, interpolation, and statistics from the details panel.
- Perform time series operations: Apply operations such as rolling aggregates, formulas, filters, and event statistics directly to plots without leaving the analysis context.
- Visualize event sets: Overlay events from linked objects or configurable conditions on charts alongside time series data.
- Organize across multiple canvases: Work across multiple chart canvases with synchronized or independent x-axes. Reorder, move, and hide plots as needed, with automatic axis grouping by unit.
- Save and share analyses: Save analyses as Foundry resources for later use, and open them in a dedicated resource viewer or load them into a Workshop widget using the analysis RID.
Build a guided time series analysis experience in Workshop
The Time Series Analysis widget brings the same interface and tooling to Workshop, allowing application builders to embed time series analysis directly in their applications. The widget includes fine-grained configuration options to tailor the experience for operational users:
- Filter which Ontology series are available for users to add to their analysis
- Control initial time series and event sets using object set variables
- Customize which plot types and event set types are available
- Set chart display options including default view range, tooltip display, and x-axis syncing behavior across canvases
- Configure how analyses are saved and loaded, including default save location and autoloading
Users can also open their analysis in Quiver directly from the widget for more advanced workflows. Note that changes made in Quiver are not reflected back in the Workshop widget.
Getting started
To create a new time series analysis, navigate to the New Analysis button on the Quiver splash page or Foundry side panel. Choose a name and location for your file and select Time Series Analysis before saving.
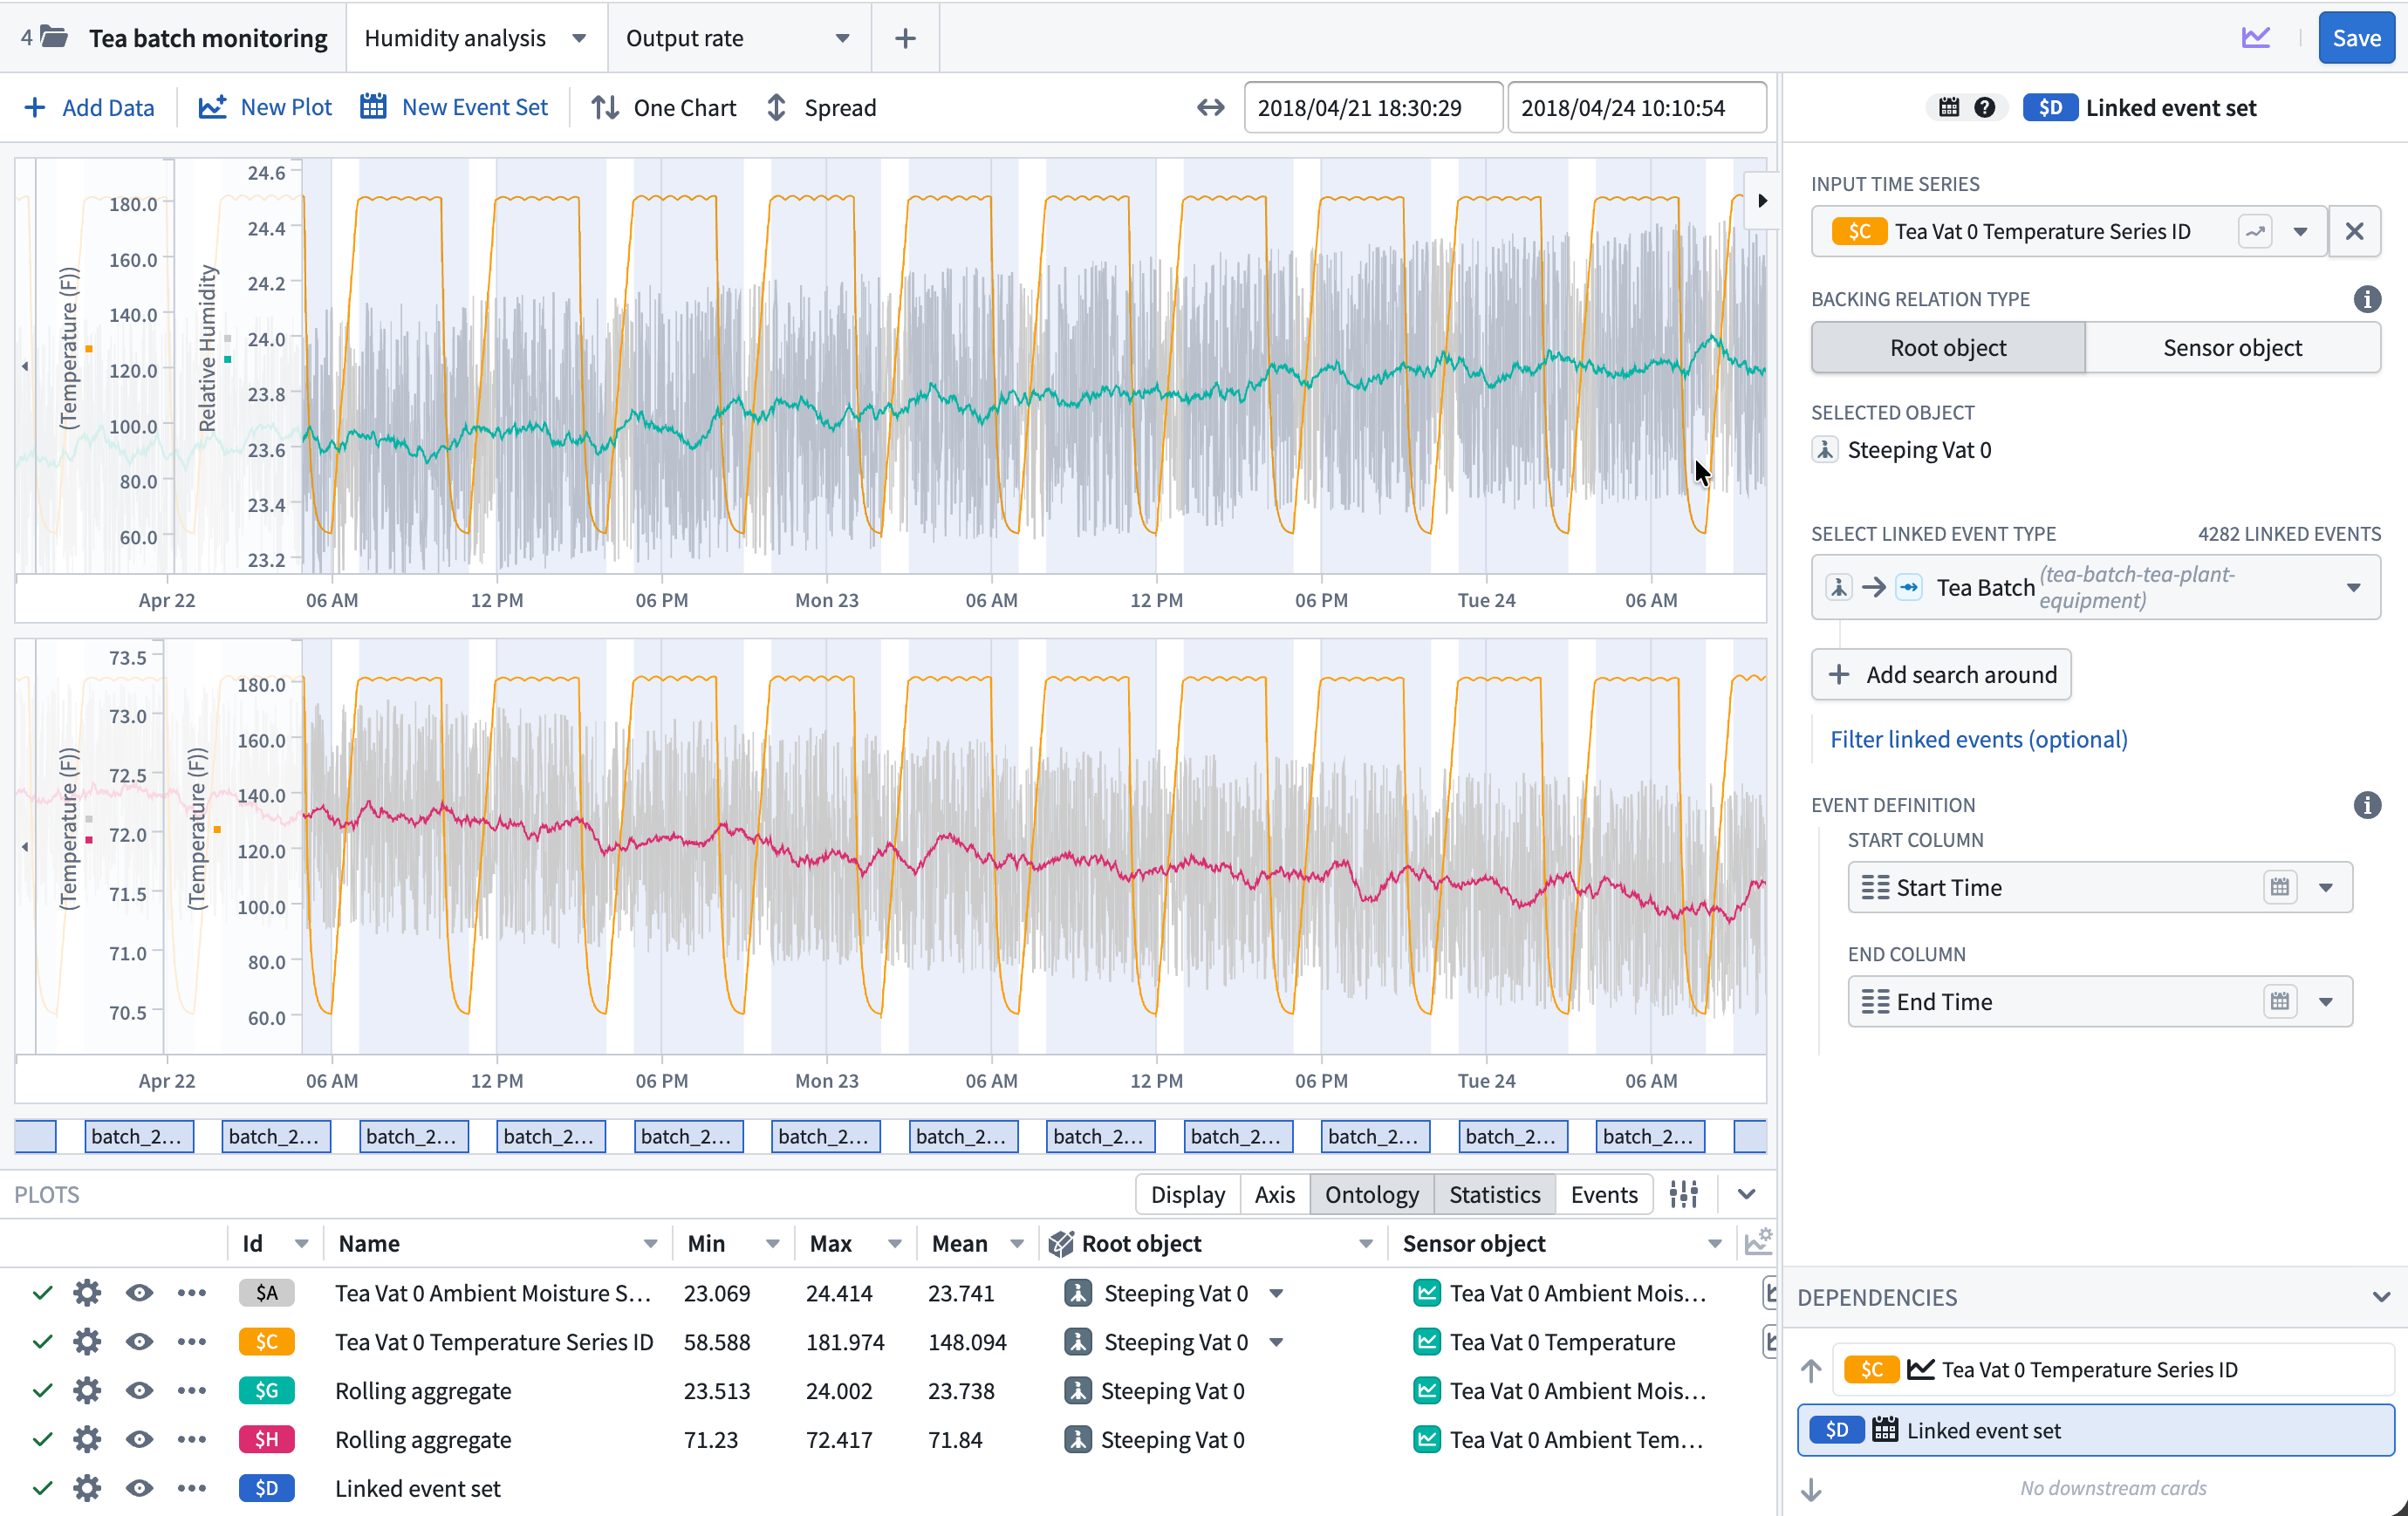
The new time series analysis view in Quiver.
For more information, review the Quiver analysis types documentation and the Time Series Analysis widget documentation.
Share your feedback
We want to hear about your experiences creating time series analyses in Quiver and Workshop. Share your thoughts with our Palantir Support channels or Developer Community ↗ using the quiver ↗ or workshop ↗ tags.
Expanded Workflow Lineage access across the Palantir platform
Date published: 2026-03-03
You can now open Workflow Lineage graphs from more locations across the platform using the Cmd+i (macOS) or Ctrl+i (Windows) shortcut, as well as a dedicated navigation option available on various resource types.
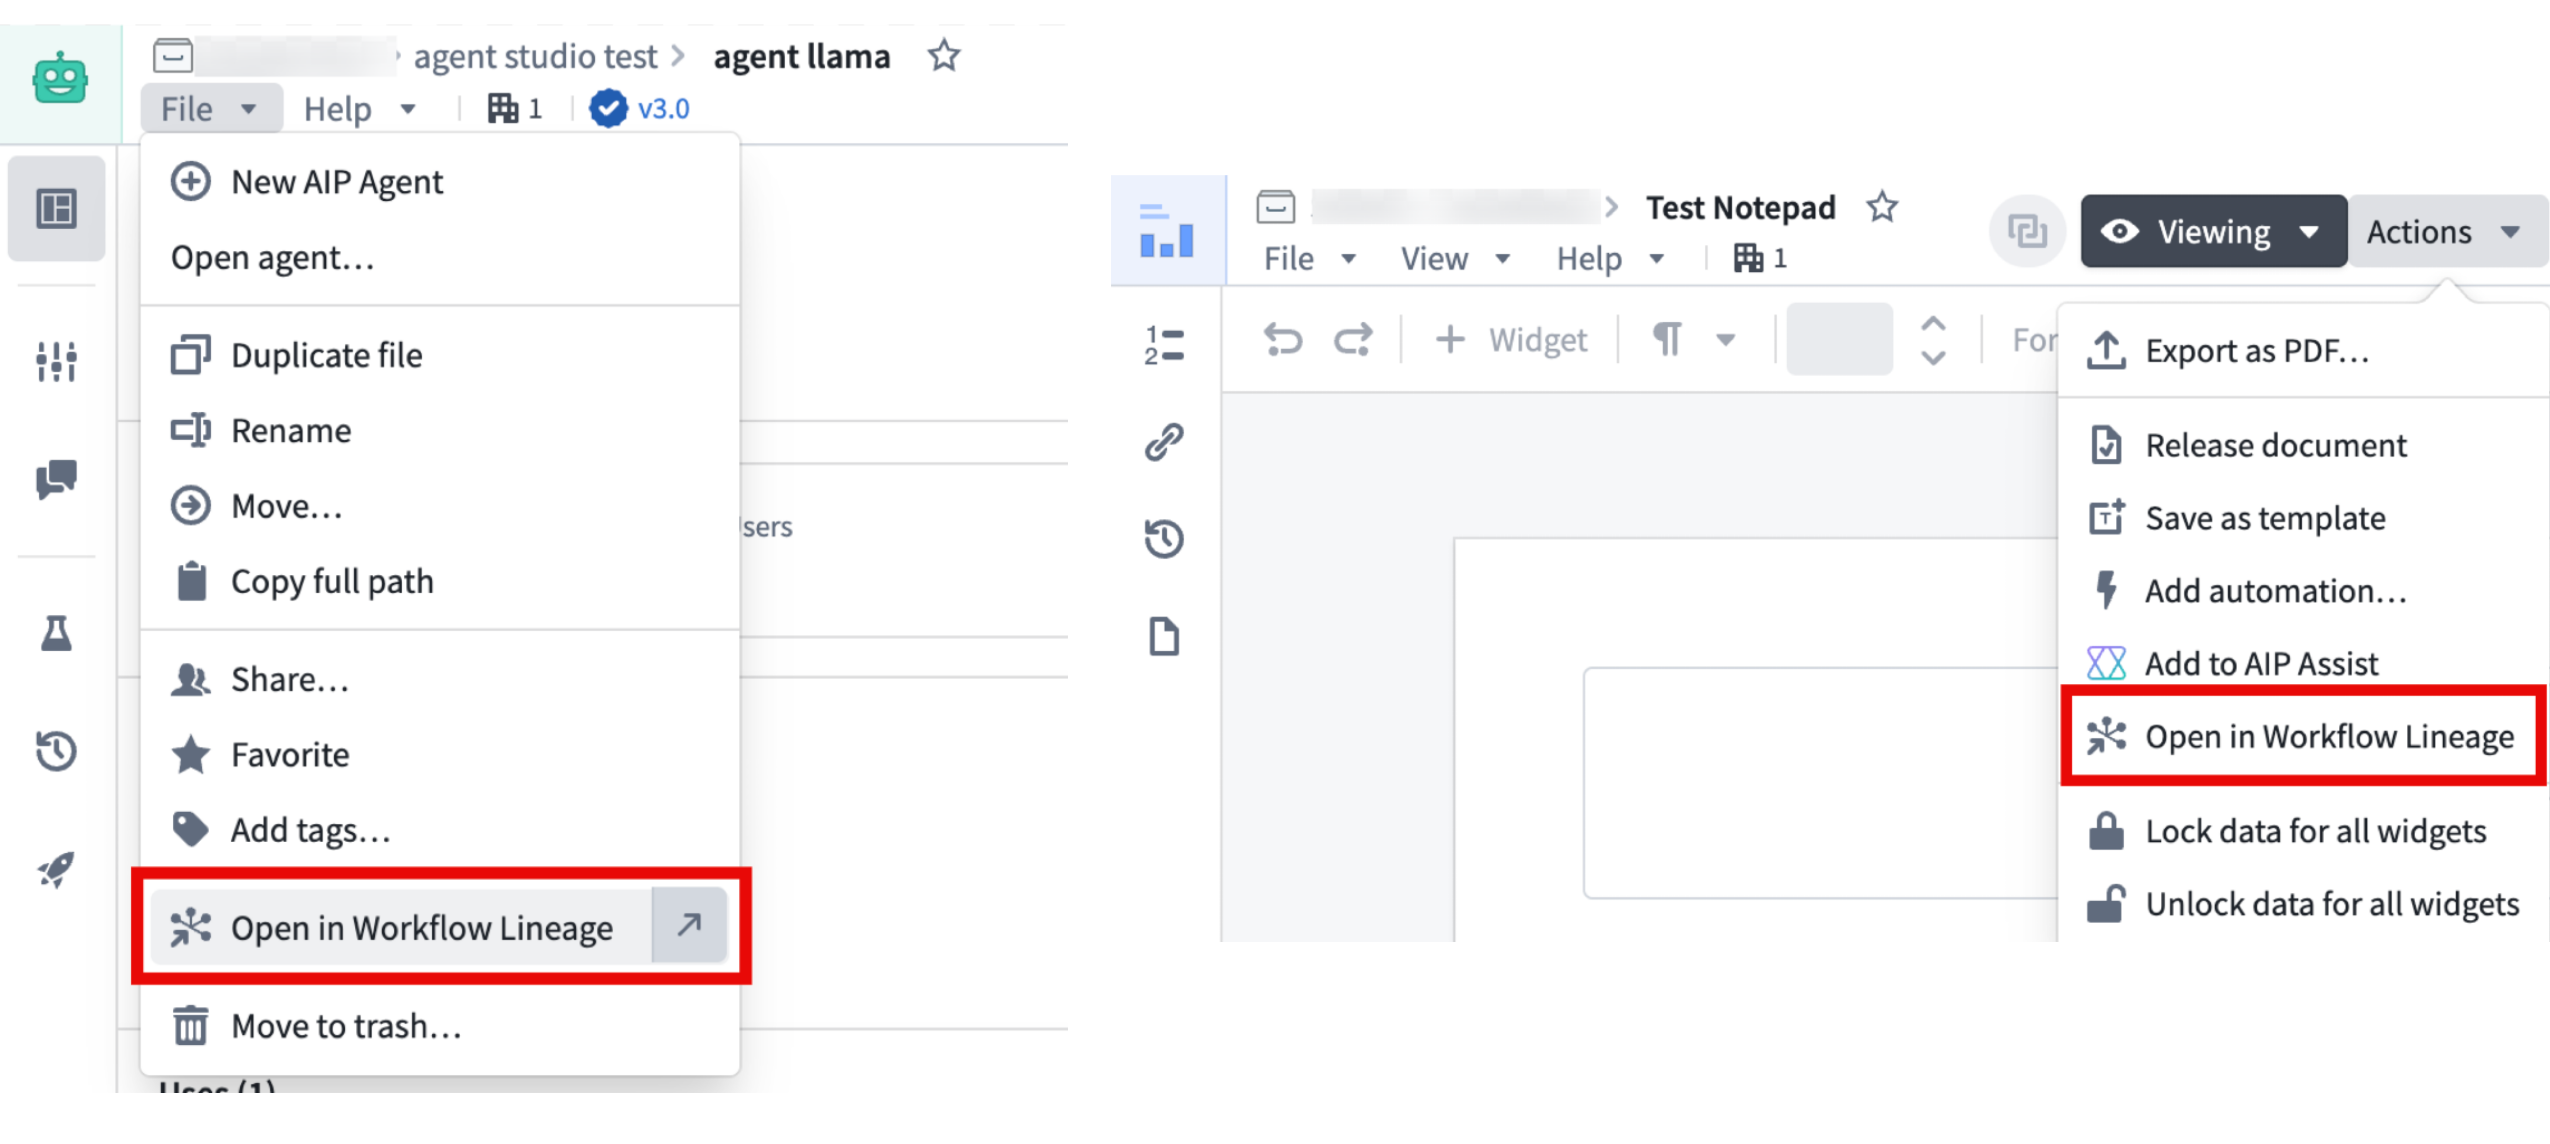
Examples of the Open in Workflow Lineage option in Agent Studio and Notepad, often found under File or Actions in the top navigation bar.
Access Workflow Lineage
- Use the
Cmd+i(macOS) orCtrl+i(Windows) keyboard shortcuts to open Workflow Lineage, or select the Open in Workflow Lineage option on a resource where available. - You will be redirected to the resource's Workflow Lineage graph displaying the selected node, plus any direct upstream and downstream nodes. Note that some resources may not display actions, functions, or objects if those concepts do not apply.
The following applications support these navigation features:
- Workshop
- Objects in Ontology Manager
- Function repositories
- Quiver dashboards
- Machinery
- Slate
- Agent Studio
- Automate
- Third-party applications
- Developer Console (Keyboard shortcut only)
- Marketplace (Keyboard shortcut only, in a draft resource's overview tab.)
- Notepad (Navigation option only)
- Object types in Pipeline Builder (Navigation option only)
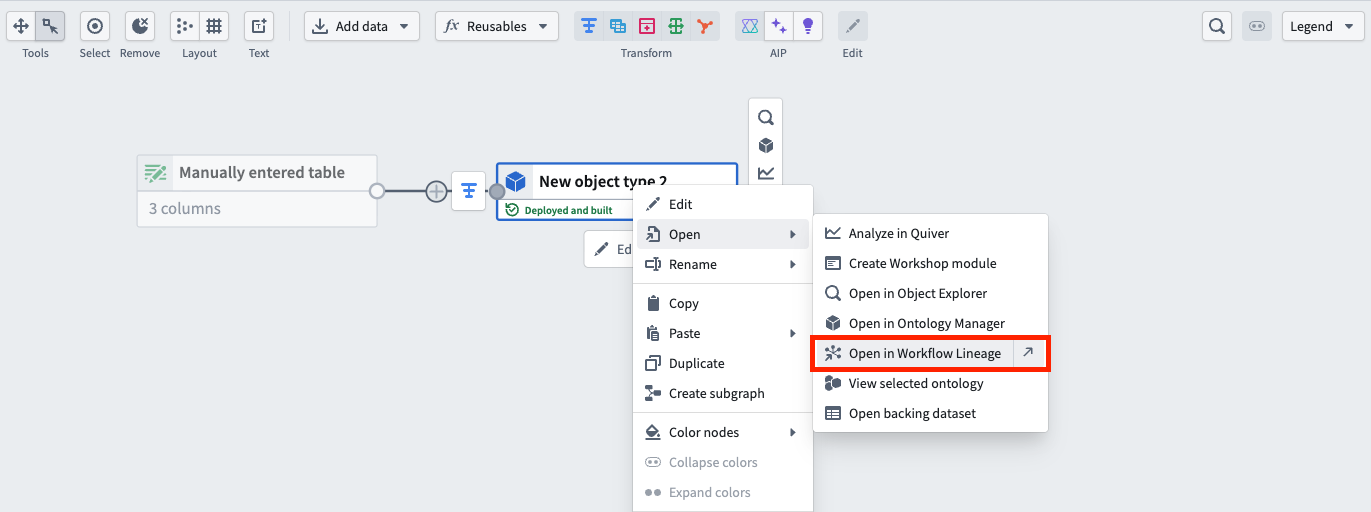
The dedicated navigation option in Pipeline Builder.
Leverage this feature to better explore and understand your workflows from different applications across the Palantir ecosystem.
We want to hear from you
As we continue to develop Workflow Lineage, we want to hear about your experiences and welcome your feedback. Share your thoughts with Palantir Support channels or our Developer Community ↗ using the Workflow-lineage ↗ tag.
Learn more about Workflow Lineage.
中文翻译
公告
提醒: 请注册 Foundry Newsletter(新闻通讯),即可直接在收件箱中接收平台新产品、功能和改进的摘要。有关如何订阅的更多信息,请参阅 Foundry Newsletter 和 Product Feedback 频道公告。
欢迎在我们的 开发者社区论坛 ↗ 分享您对这些公告的看法。
AIP Analyst 正式发布
发布日期:2026-03-31
AIP Analyst 将于 2026 年 4 月 13 日当周面向已启用 AIP 的用户正式发布。AIP Analyst 是一个用于探索本体(ontology)的对话式 AI 界面,使技术和非技术用户都能探索本体数据并生成洞察。使用 AIP Analyst,您可以提出问题、可视化结果,并以完全透明的方式了解分析的每一步。
主要功能
AIP Analyst 可以使用多种工具来遍历和调查您的本体数据:
- 搜索和理解您的本体。
- 使用搜索环绕(search-arounds)和语义搜索(semantic search)过滤对象集。
- 执行分组聚合(group-by aggregations)以进行细分、分析和报告。
- 针对对象集和数据集编写 SQL 查询。
- 使用 Vega 图表和地图创建可视化。
- 直接在对话中执行 Foundry 操作(actions)和函数(functions)。
- 分析手动添加的文件,如图像、PDF 和电子表格。
AIP Analyst 旨在为用户提供透明度和控制权。您可以查看分析的每一步、验证逻辑、在需要时进行手动调整,并在交互式图形视图中查看分析谱系(lineage)。
示例用例
例如,运营经理可以询问 AIP Analyst "我的设施中哪些设备需要注意?"——为了回答这个问题,AIP Analyst 将自动遍历本体,跟踪相关对象(如检查日志和维护记录)之间的关系,生成需要处理的项目的优先级摘要。
在探索本体数据的过程中,AIP Analyst 还可以发现并揭示数据质量问题,例如过时的记录。这有助于团队在开始之前无需等待数据完全清理即可识别差距。然后,AIP Analyst 可以帮助制定改进本体的计划,AI FDE 可以执行该计划。
完全透明的智能分析
AIP Analyst 在回答您的问题时会"展示其工作过程",以提供完全的透明度。
- 每次分析都会创建一个交互式依赖关系图,显示从问题到答案的流程。
- 用户可以准确查看代理如何推理他们的请求,检查中间结果,并手动调整步骤。
- 最终摘要消息包含内联引用,链接到为响应的每个部分提供信息的具体工具结果,这些引用的摘要直接出现在分析图中。
- 摘要中的代码块也可以独立复制。
上面的示例显示了 AIP Analyst 探索有关机场的数据,以了解哪些机场最繁忙。
Workshop 集成
AIP Analyst 可以作为 Workshop 小部件嵌入,直接在 Workshop 模块中提供 AI 驱动的分析能力。该 Workshop 小部件支持在发送消息时触发操作以记录和跟踪用户交互,在用户切换标签或关闭部分时保持对话状态,并提供广泛的配置选项来控制数据访问、工具可用性和用户界面自定义。
设置 AIP Analyst Workshop 小部件的界面。
要求
要使用 AIP Analyst,请确保您的注册(enrollment)已启用 AIP。启用后,您可以在 /workspace/aip-analyst 访问 AIP Analyst,开始询问有关本体的问题。
在我们的文档中了解有关 AIP Analyst 的更多信息。
您的反馈很重要
我们想听听您使用 AIP Analyst 的体验,并欢迎您的反馈。通过 Palantir Support 渠道或使用我们的 开发者社区 ↗ 中的 #aip-analyst 标签分享您的想法。
在 Pipeline Builder 中评论提案中的节点
发布日期:2026-03-31
您现在可以直接在 Pipeline Builder 的提案(proposals)中对单个节点进行评论。以前,评论仅限于管道(pipeline)级别。
节点级评论适用于所有注册,让您可以:
- 在节点级别添加、查看和管理评论: 将您的反馈、问题或标记的问题精确地定位在相关节点上。
- 解决和重新打开评论: 将反馈标记为已处理,或根据需要重新打开讨论。从"评论"面板切换已解决评论的可见性,以专注于活跃的讨论。
- 使用 @提及 标记团队成员: 将合适的人带入对话,精确地定位到需要他们意见的地方。
- 使用富文本格式: 所有节点评论都支持 Markdown:添加 粗体、斜体、链接和
代码块,以实现更清晰的沟通。
提案视图的"更改"部分中的"评论"选项卡。左侧面板显示与提案相关的所有评论,而右侧窗口显示特定节点上的评论。
提案概览页面,底部有一个用于新输入的评论框,顶部有一个"隐藏已解决的评论"切换按钮,用于过滤评论。
如何使用
节点级评论使协作更加高效和有条理,确保反馈始终可操作且与上下文相关。要开始使用:
- 在 Pipeline Builder 中打开您的提案。
- 转到 更改 选项卡。
- 选择一个节点,并使用 评论图标 添加您的反馈。您也可以双击节点并在其中添加评论。
在"更改"选项卡的管道图中选择特定节点时,使用评论图标添加与该节点相关的评论。
分享您的反馈
随着我们继续为 Pipeline Builder 添加功能,我们想听听您的体验并欢迎您的反馈。通过 Palantir Support 渠道或我们的 开发者社区 ↗ 使用 pipeline-builder 标签 ↗ 分享您的想法。
使用 Insight 分析和调查您的本体
发布日期:2026-03-27
Insight 是一个无需编写代码即可探索和分析本体数据的点击式应用程序,将于 3 月 30 日当周面向所有注册正式发布。
一个 Insight 工作簿,显示 Aircraft 对象类型的分析路径。
Insight 让您可以构建逐步分析路径来过滤对象、跟踪对象链接、聚合结果和创建可视化。您的工作保存在 工作簿(workbooks) 中,这些工作簿将分析路径、布局和数据存储在一个地方。工作簿可以保存、与其他用户共享,并用于创建可在整个平台中重复使用的已发布对象集。
Insight 专为需要探索本体数据、深入挖掘对象类型之间的关系并对结果采取行动的操作型用户和分析师设计,无需深厚的技术专业知识。
关键能力
分析路径: 通过在 分析面板 中链接 过滤(Filter)、链接(Link) 和 转换(Transform) 卡片来构建多步分析。每张卡片跟踪该步骤的对象计数,并且可以打开或关闭单个步骤,而无需将其从路径中移除。
对象类型链接: 使用 链接 卡片遍历对象关系,并将分析转向连接的对象类型。例如,从一组过滤后的 Aircraft 开始,跟踪到 Flights 的链接,然后再次跟踪到 Airports 的链接,以仅查看与您的过滤结果相关的机场。
聚合和 SQL: 使用 分组依据(Group by) 操作对对象进行分组并计算指标,或直接在 SQL 沙箱中编写 SQL 查询 以进行高级分析。SQL 在单个对象类型上操作,并支持与其他对象类型的连接,而无需依赖本体链接类型。
Insight 中的 SQL 查询,搜索 City 属性为 El Paso 的对象类型数据。
可视化和地图: 在 图表(Charts) 选项卡中将属性可视化为分布图、直方图和单统计指标。如果对象类型包含地理属性,则 地图(Map) 选项卡可用,以使用绘制的形状和多边形在空间上过滤对象。
Insight 工作簿中的 图表 选项卡,显示 Aircraft 对象类型分析的数据可视化。
数据写回: 使用操作直接从分析结果创建、更新和删除对象,无需离开 Insight。
共享和重用: 将任何分析路径发布为对象集,使其可在其他应用程序中发现和使用,包括 Quiver 和 Vertex。与特定用户共享工作簿,或通过链接共享并配置访问角色。
要开始在 Insight 中构建分析,请查看我们的文档。
您的反馈很重要
我们想听听您使用 Insight 分析本体的体验。通过我们的 Palantir Support ↗ 渠道或 开发者社区 ↗ 分享您的反馈。
函数仓库的 VS Code Workspaces 现已可用
发布日期:2026-03-26
您现在可以在 VS Code Workspaces 中编写函数仓库,将您从 Code Repositories 熟悉的相同 UI 和工具带入更快、功能更强大的环境。
以下是包含的内容:
- 实时预览(Live preview) 直接在 VS Code 中测试更改
- 侧面板(Side panel) 用于导入资源和生成 SDK
- 标签和发布面板(Tag and release panel) 用于选择和发布版本
使用标题中的"在 VS Code 中编辑"按钮在 Code Workspaces 中打开您的仓库,以解锁新体验。
VS Code Workspaces 在重新设计的架构上运行,可提供全面的更快性能。
VS Code Workspaces 旨在成为函数仓库的标准应用程序,因为 Code Repositories 中的支持预计将在 2026 年 6 月左右开始过渡到旧版状态。
我们想听听您的意见
分享反馈或告诉我们您使用 VS Code 的体验,请联系我们的 Palantir Support 渠道或使用 vscode 标签 ↗ 加入我们的 开发者社区 的讨论。
用于 Ontology MCP 的 Microsoft Copilot Studio 集成
发布日期:2026-03-26
Ontology MCP 现在支持与 Microsoft Copilot Studio 集成,使您能够将 Foundry 本体连接到 Microsoft 的 AI 代理平台,并直接在 Teams、Copilot 和 Outlook 中展示结构化的本体数据。
设置此集成时,请将您的 Developer Console 应用程序创建为具有 User's 权限的 Backend 服务。Copilot Studio 仅支持机密客户端(Confidential Client)中的授权码授权(authorization code grant),这需要服务用户代表您的用户颁发令牌。
用于丰富数据显示的 Adaptive Cards
通过此集成,您可以使用 Microsoft Adaptive Cards 将本体数据呈现为格式化的交互式卡片,而不是纯文本。例如,代理可以查询您的本体的客户组合,并将结果显示为具有风险状态、续订日期和操作按钮的结构化卡片。
使用 Copilot Studio 通过 Microsoft Adaptive Cards 显示数据的 Palantir CRM 代理示例。
您还可以在 Adaptive Cards 中使用 Action.OpenUrlDialog 在 Teams 或 Copilot 中打开自定义对话框,允许用户内联与 Ontology MCP 数据进行交互。
开始使用
首先,安装 Microsoft 365 Agents Toolkit 和 Adaptive Card Previewer VS Code 扩展。然后,在 VS Code 中配置您的 Ontology MCP 服务器,并使用 Microsoft 365 Agents Toolkit 创建自适应代理。将带有 response_semantics 的功能块添加到您的代理的工具定义中,以将 Ontology MCP 工具输出映射到 Adaptive Card 模板。
有关逐步指南,请参阅 MCP 工具和代理配置文档。
GPT-5.4 Mini 和 GPT-5.4 Nano 现已在 AIP 中可用
发布日期:2026-03-19
GPT-5.4 mini↗ 和 GPT-5.4 nano↗ 现在可直接从 OpenAI 获取,适用于非地理限制的注册。
模型概述
GPT-5.4 mini 在编码、推理、工具使用、计算机使用和多模态任务方面比 GPT-5 mini 有所增强,同时运行速度提高一倍,性能接近 GPT-5.4。GPT-5.4 nano 是 GPT-5.4 系列中最小且最实惠的变体,非常适合分类、数据提取、排序和轻量级编码任务。在 OpenAI 的公告 ↗ 中了解有关这些模型的更多信息。
- 上下文窗口: 400,000 个令牌
- 知识截止日期: 2025 年 8 月
- 模态: 文本、图像
- 能力: Responses API、结构化输出、函数调用、工具搜索、计算机使用、流式传输
开始使用
要使用这些模型:
分享您的反馈
我们想听听您在 Palantir 平台中使用语言模型的体验,并欢迎您的反馈。通过 Palantir Support 渠道或使用 language-model-service ↗ 标签在我们的 开发者社区 ↗ 上分享您的想法。
在 Pipeline Builder 中强制执行默认预览行为
发布日期:2026-03-19
您现在可以配置 Pipeline Builder,要求运行预览前进行手动确认,防止意外运行并节省计算资源。要启用此设置,请导航至 控制面板 > Pipeline Builder,然后切换 默认启用预览确认 选项。
Pipeline Builder 在控制面板中的 默认启用预览确认 设置。
使用此新选项,注册管理员可以选择预览是自动运行还是需要注册中所有用户手动确认。Pipeline Builder 中的用户偏好设置仍然可用,允许个人用自己的预览行为配置覆盖注册默认值。
Pipeline Builder 用户偏好 菜单中的 自动预览行为 选项。
此更新使组织能够更好地控制和管理数据预览的方式,使其更容易在注册中强制执行最佳实践并优化计算使用。
了解有关 Pipeline Builder 中管道预览的更多信息。
虚拟表和 Iceberg 表现已提供健康检查
发布日期:2026-03-19
您现在可以为 虚拟表(virtual tables) 以及 托管和虚拟 Iceberg 表 配置 健康检查(health checks),以启用对常见问题的监控和警报,例如:
- 确保主键值 100% 唯一且非空
- 验证自上次更新以来的总时间是否满足配置的阈值
- 验证表的模式是否遵守所选的比较类型
- 检查表最近的 构建(build) 或 作业运行(job run) 是否成功
- 检查表列的存在性和类型
此功能扩展到源自 Databricks、Snowflake 和 BigQuery 的虚拟表。
配置和查看表的健康检查
要配置新的健康检查,请从表的 健康 选项卡中选择 添加检查,然后选择要配置的检查。
在表的 健康 选项卡中选择 添加检查 后,选择要配置的健康检查。
在虚拟表或 Iceberg 表上配置一个或多个健康检查后,Foundry 会在同一个 健康 选项卡中显示每个检查,您可以在其中查看其状态、时间、监控视图和历史记录。
使用 健康 选项卡的 检查 面板查看您为虚拟表或 Iceberg 表配置的健康检查。
了解有关何时在 Foundry 中使用 虚拟表 或 Iceberg 表 而不是数据集的更多信息。
使用 Autopilot 可视化、监控和调试自动化工作流
发布日期:2026-03-19
随着团队在 Foundry 中将自动化、逻辑函数和操作链接在一起,理解这些系统的行为变得困难。Autopilot 现已提供测试版,提供了所需的可见性,以了解自动化如何连接、跟踪对象通过工作流,并在一个地方调试故障。作为测试版产品,功能和外观在积极开发过程中可能会发生变化。
Autopilot 工作台的看板视图。
能力
- 交互式流程图: 将您的自动化、逻辑函数和操作如何连接可视化为 依赖关系图。展开节点以查看回退效果和历史对象路径,并使用实时活动指示器监控活动执行。
- 对象级跟踪: 跟踪任何 对象通过工作流的完整旅程,包括哪些自动化运行了、进行了哪些更改以及故障发生在哪里。
- 实时调试: 使用 对象执行 选项卡实时监控自动化事件和故障,跟踪日志、错误消息和时间详细信息直接显示在 Autopilot 中。
- 看板式监控: 观察对象移动 通过工作流状态,实时更新并即时访问对象详细信息。
- 统一资源视图: 从一个工作台浏览和管理所有自动化资源,支持 Workshop、操作和专业代码代理。
Autopilot 中的依赖关系图视图。
开始使用
从应用程序门户打开 Autopilot,或从任何 自动化概览 页面的 操作 菜单中选择 在 Autopilot 中打开。
- 选择您的起点: 选择一个对象类型或自动化。Autopilot 会生成一个初始工作台,并提醒您尚未包含的相关自动化。
- 查看和添加自动化: 按照提示构建完整的系统视图。
- 自定义状态: 在 状态 侧边栏中添加、重新排序或手动定义状态。
- 启用项目范围模式: 允许所有工作台用户查看执行事件并发现自动化依赖关系。请注意,这会扩展项目中的权限。
- 启用编辑历史跟踪: 需要查看对象历史并跟踪对象通过工作流的路径。
配置好工作台后,探索流程图以可视化您的自动化系统,并选择任何对象以跟踪其通过工作流的路径。
从侧边栏组织和定义状态。
有关详细指导,请查看我们的 文档。
下一步计划
以下改进正在积极开发中:
- 增强的调试:更丰富的执行上下文和单对象跟踪,以加速错误调查
- 简化入门:通过引导式配置加快工作台设置
- 自定义工作流组织:状态分组和改进的图形配置
我们想听听您的意见
Autopilot 正在由构建真实世界自动化工作流的团队塑造。要分享反馈或告诉我们您的用例,请联系我们的 Palantir Support 渠道或使用 aip-autopilot 标签 ↗ 加入我们的 开发者社区 的讨论。
推广关键对象类型以提高可发现性
发布日期:2026-03-18
本体管理员现在可以推广对象类型,将其标记为核心关键资源。推广的对象类型将带有紫色"已验证"复选标记,并将在整个平台的应用程序(包括 Object Explorer、Gaia、AIP Logic、Slate 和 Workshop)的搜索结果中显示在更靠前的位置。收藏的对象类型也将在搜索结果中更突出地显示。有关更多详细信息,请参阅 状态文档。
Ontology Manager 中的推广示例以及整个平台中多个提高突出度的示例。
使用 AIP Document Intelligence 中的分块和嵌入提高 RAG 准确性
发布日期:2026-03-17
AIP Document Intelligence 现在支持对所有注册的提取文本进行分块(chunking)和嵌入(embedding)。除了由视觉语言模型和 OCR 驱动的文档提取外,您现在可以直接在平台内端到端地处理文档。分块是文档中心工作流中的关键步骤——它决定了传递给 RAG 系统中模型的文本粒度,直接影响检索准确性和下游生成质量。
新的分块策略针对 Markdown 进行了优化,并处理复杂结构,如项目符号和表格,改进了 Pipeline Builder 和 AIP Logic 中现有的原始文本分块。通过 AIP Document Intelligence 的文本提取工作流访问此功能,或通过 Python 转换(transforms)部署它,并可以选择生成嵌入以支持基于 RAG 的工作流。
主要优势
- 更高质量的嵌入: 将大型文档分解为语义连贯的块,以适应嵌入模型的上下文窗口。为每个块生成向量嵌入。
- 改进的搜索: 每个块更高质量的向量嵌入可实现更准确的语义搜索。
- 针对复杂 Markdown 优化的默认配置: 默认分块配置比以前可用的更全面,用户可以预期其 RAG 工作流的质量会因此得到提高。
有关更多详细信息,请查看有关将提取策略部署到 Python 转换的文档。
让我们知道您的想法
我们想听听您使用 AIP Document Intelligence 的体验。通过 Palantir Support 渠道或使用 aip-document-intelligence 标签 ↗ 在我们的 开发者社区 ↗ 上分享您的想法。
在 Pipeline Builder 中强制执行增量执行
发布日期:2026-03-17
您现在可以使用 Pipeline Builder 中的 要求增量执行 设置来确保管道中的增量执行。启用此设置后,配置为增量运行的作业如果无法增量运行,将自动失败。这有助于防止意外快照输入、输出模式更改导致的强制快照以及其他意外快照场景。
构建设置* 菜单中的 要求增量执行* 设置。
启用必需的增量执行
要配置强制增量执行,请通过选择管道中 部署 按钮右侧的配置图标打开 构建设置。向下滚动到 高级配置,并将 要求增量执行 设置为 True。此设置的默认值为 无值。
为管道启用此设置时,请注意以下注意事项:
- 启用后,给定管道中的 所有 增量输出如果无法增量运行,都将失败,无论作业分组如何。
- 仅当您的管道至少有一个增量输入或输出时,要求增量执行 设置才能设置为 True。如果没有,启用此选项将导致部署错误。
- 配置为要求增量执行的管道可以作为快照运行的唯一情况是,对管道的更改需要 状态中断(state break)。运行前会要求您确认。
此功能以前仅在 PySpark 和轻量级 增量转换(incremental transforms) 中可用,方法是在 @incremental 装饰器中设置 require_incremental=True,现在已在 Pipeline Builder 中提供,以弥合低代码和专业代码工作流之间的差距。
分享您的反馈
随着我们继续为 Pipeline Builder 添加功能,我们想听听您的体验并欢迎您的反馈。通过 Palantir Support 渠道或我们的 开发者社区 ↗ 使用 pipeline-builder 标签 ↗ 分享您的想法。
使用基于角色的安全控制共享分支管理
发布日期:2026-03-17
分支创建者现在可以为用户分配角色,以控制谁可以管理和合并其 Foundry 分支。以前,只有分支创建者才能管理和合并分支。通过基于角色的安全控制,分支创建者可以将所有权委托给其他用户和组,消除瓶颈,同时保持对谁可以访问和管理分支的控制。分支可见性和权限由两种机制共同管理:
- 分支角色 控制用户可以对分支执行的操作。分支创建者自动分配
owner角色,具有完整的管理权限,包括编辑元数据、管理角色和合并提案。分支所有者可以将owner角色授予其他用户和组。空间管理员自动拥有与分支所有者相同的权限。 - 组织 控制谁可以看到分支。用户必须是分支至少一个组织的成员才能访问它。分支上资源的权限保持在单个资源级别进行控制,不受分支可见性的影响。
管理安全设置
分支所有者和空间管理员可以从分支页面上的 安全 选项卡管理角色和组织。
分支安全设置页面,显示 Foundry 分支的角色和组织。
您的反馈很重要
我们想听听您对 Palantir 平台中 Foundry Branching 的体验,并欢迎您的反馈。通过 Palantir Support 渠道或使用 foundry-branching ↗ 标签在我们的 开发者社区 ↗ 上分享您的想法。
AI FDE(前向部署工程师)现已正式发布
发布日期:2026-03-12
AI FDE(AI 前向部署工程师)现已面向 启用 AIP 的注册正式发布。AI FDE 允许您使用自然语言操作 Foundry,通过对话解锁 Palantir 平台的力量。AI FDE 使平台交互对所有用户(无论技术专长如何)更加直观和可访问,同时保持对工具使用和数据访问的完全控制和可见性。
主要功能
使用 AI FDE,您可以执行数据转换、管理代码仓库、构建和维护本体等。AI FDE 可以通过以下功能加速您的工作:
- 上下文管理,允许您控制模型可以访问哪些信息。
- 闭环操作,通过持续反馈实现复杂的多步工作流。
- 完全尊重现有用户权限,确保适当的治理和安全。
- 透明的工具使用,对所有执行的操作具有完全可见性。
- 通过 Foundry Branching 进行沙箱测试,允许用户在合并前验证 AI FDE 的更改。
- 对 Anthropic、OpenAI、Google Gemini 和 xAI 模型的一流支持,具有原生工具 API。
要求
要使用 AI FDE,请确保您的注册已启用 AIP。为获得最佳体验,还应启用 Foundry Branching 以支持本体编辑。启用后,您可以通过提供自然语言请求开始与 AI FDE 交互。
开始使用
AI FDE 使用模式和技能来完成任务,并提供一种简单的方法来管理代理的上下文。模式(Modes) 是手头的广泛任务,例如数据集成或本体编辑,而 技能(Skills) 是可以跨不同模式使用的细粒度能力。要开始,请在输入字段中描述您的任务,并允许代理根据您的任务选择模式,或手动选择模式。对于某些模式,您可以配置其他设置,例如函数语言或是否使用 Python 转换而不是 Pipeline Builder。
AI FDE 模式 菜单,允许用户选择模式,并为某些模式提供额外配置。
模式将代理可用的文档和工具限制为仅与当前任务相关的那些。您可以打开 技能 菜单查看代理当前可用的技能,并通过共享资源或文档来扩展代理的上下文。如果您的任务需要,可以使用输入字段下方的工具图标启用其他工具。
AI FDE 提示输入字段。打开的 技能 菜单显示在给定会话中代理可用的技能。
手动配置上下文和工具或通过选择模式配置后,您可以使用 AI FDE 帮助您在 Foundry 中执行各种强大的操作,包括以下内容:
- 数据集成: 构建或修改数据管道(Python 转换或 Pipeline Builder)。
- 本体编辑: 创建或更新构成本