Create a dataset batch pipeline with Pipeline Builder(使用 Pipeline Builder 创建数据集批处理管道)
In this tutorial, you will use Pipeline Builder to create a simple pipeline with an output of a single dataset with information on flight alerts. You can then analyze this output dataset with tools like Contour or Code Workbook to answer questions such as which flight paths have the greatest risk of disruption.
The datasets used below are searchable by name in the dataset import step; you can find them in your Foundry filesystem.
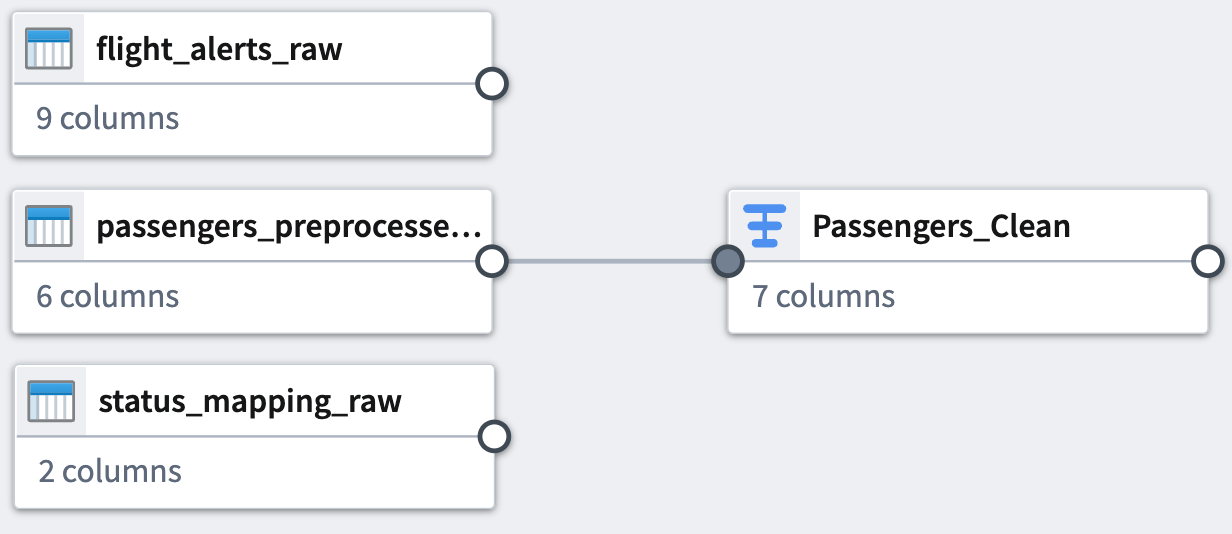
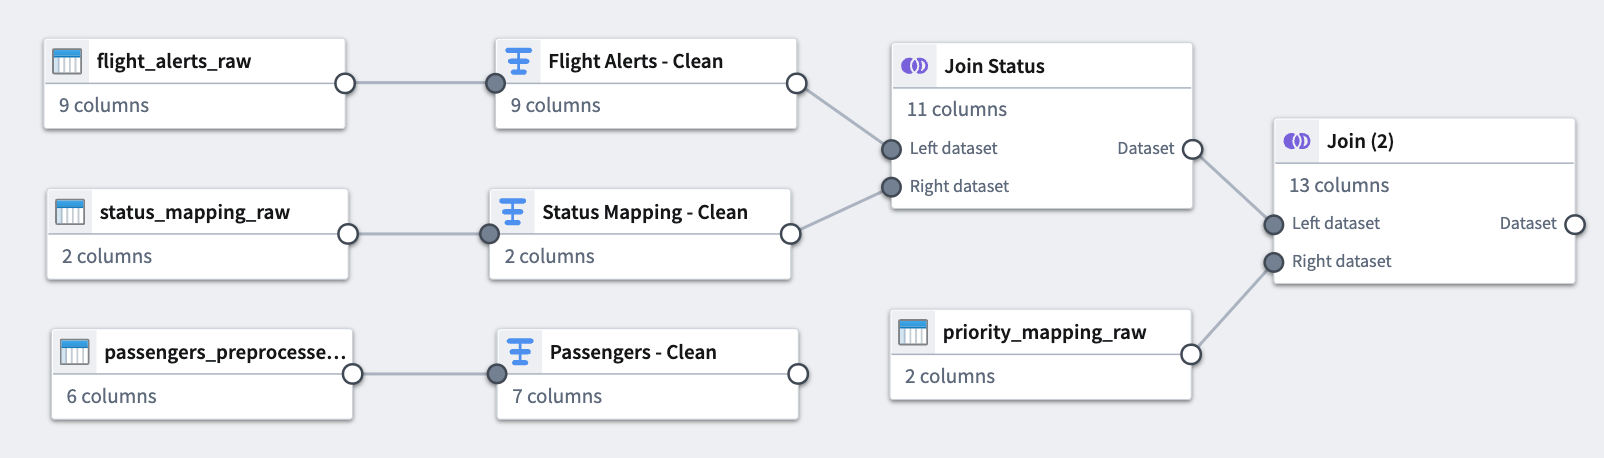
At the end of this tutorial, you will have a pipeline that looks like the following:
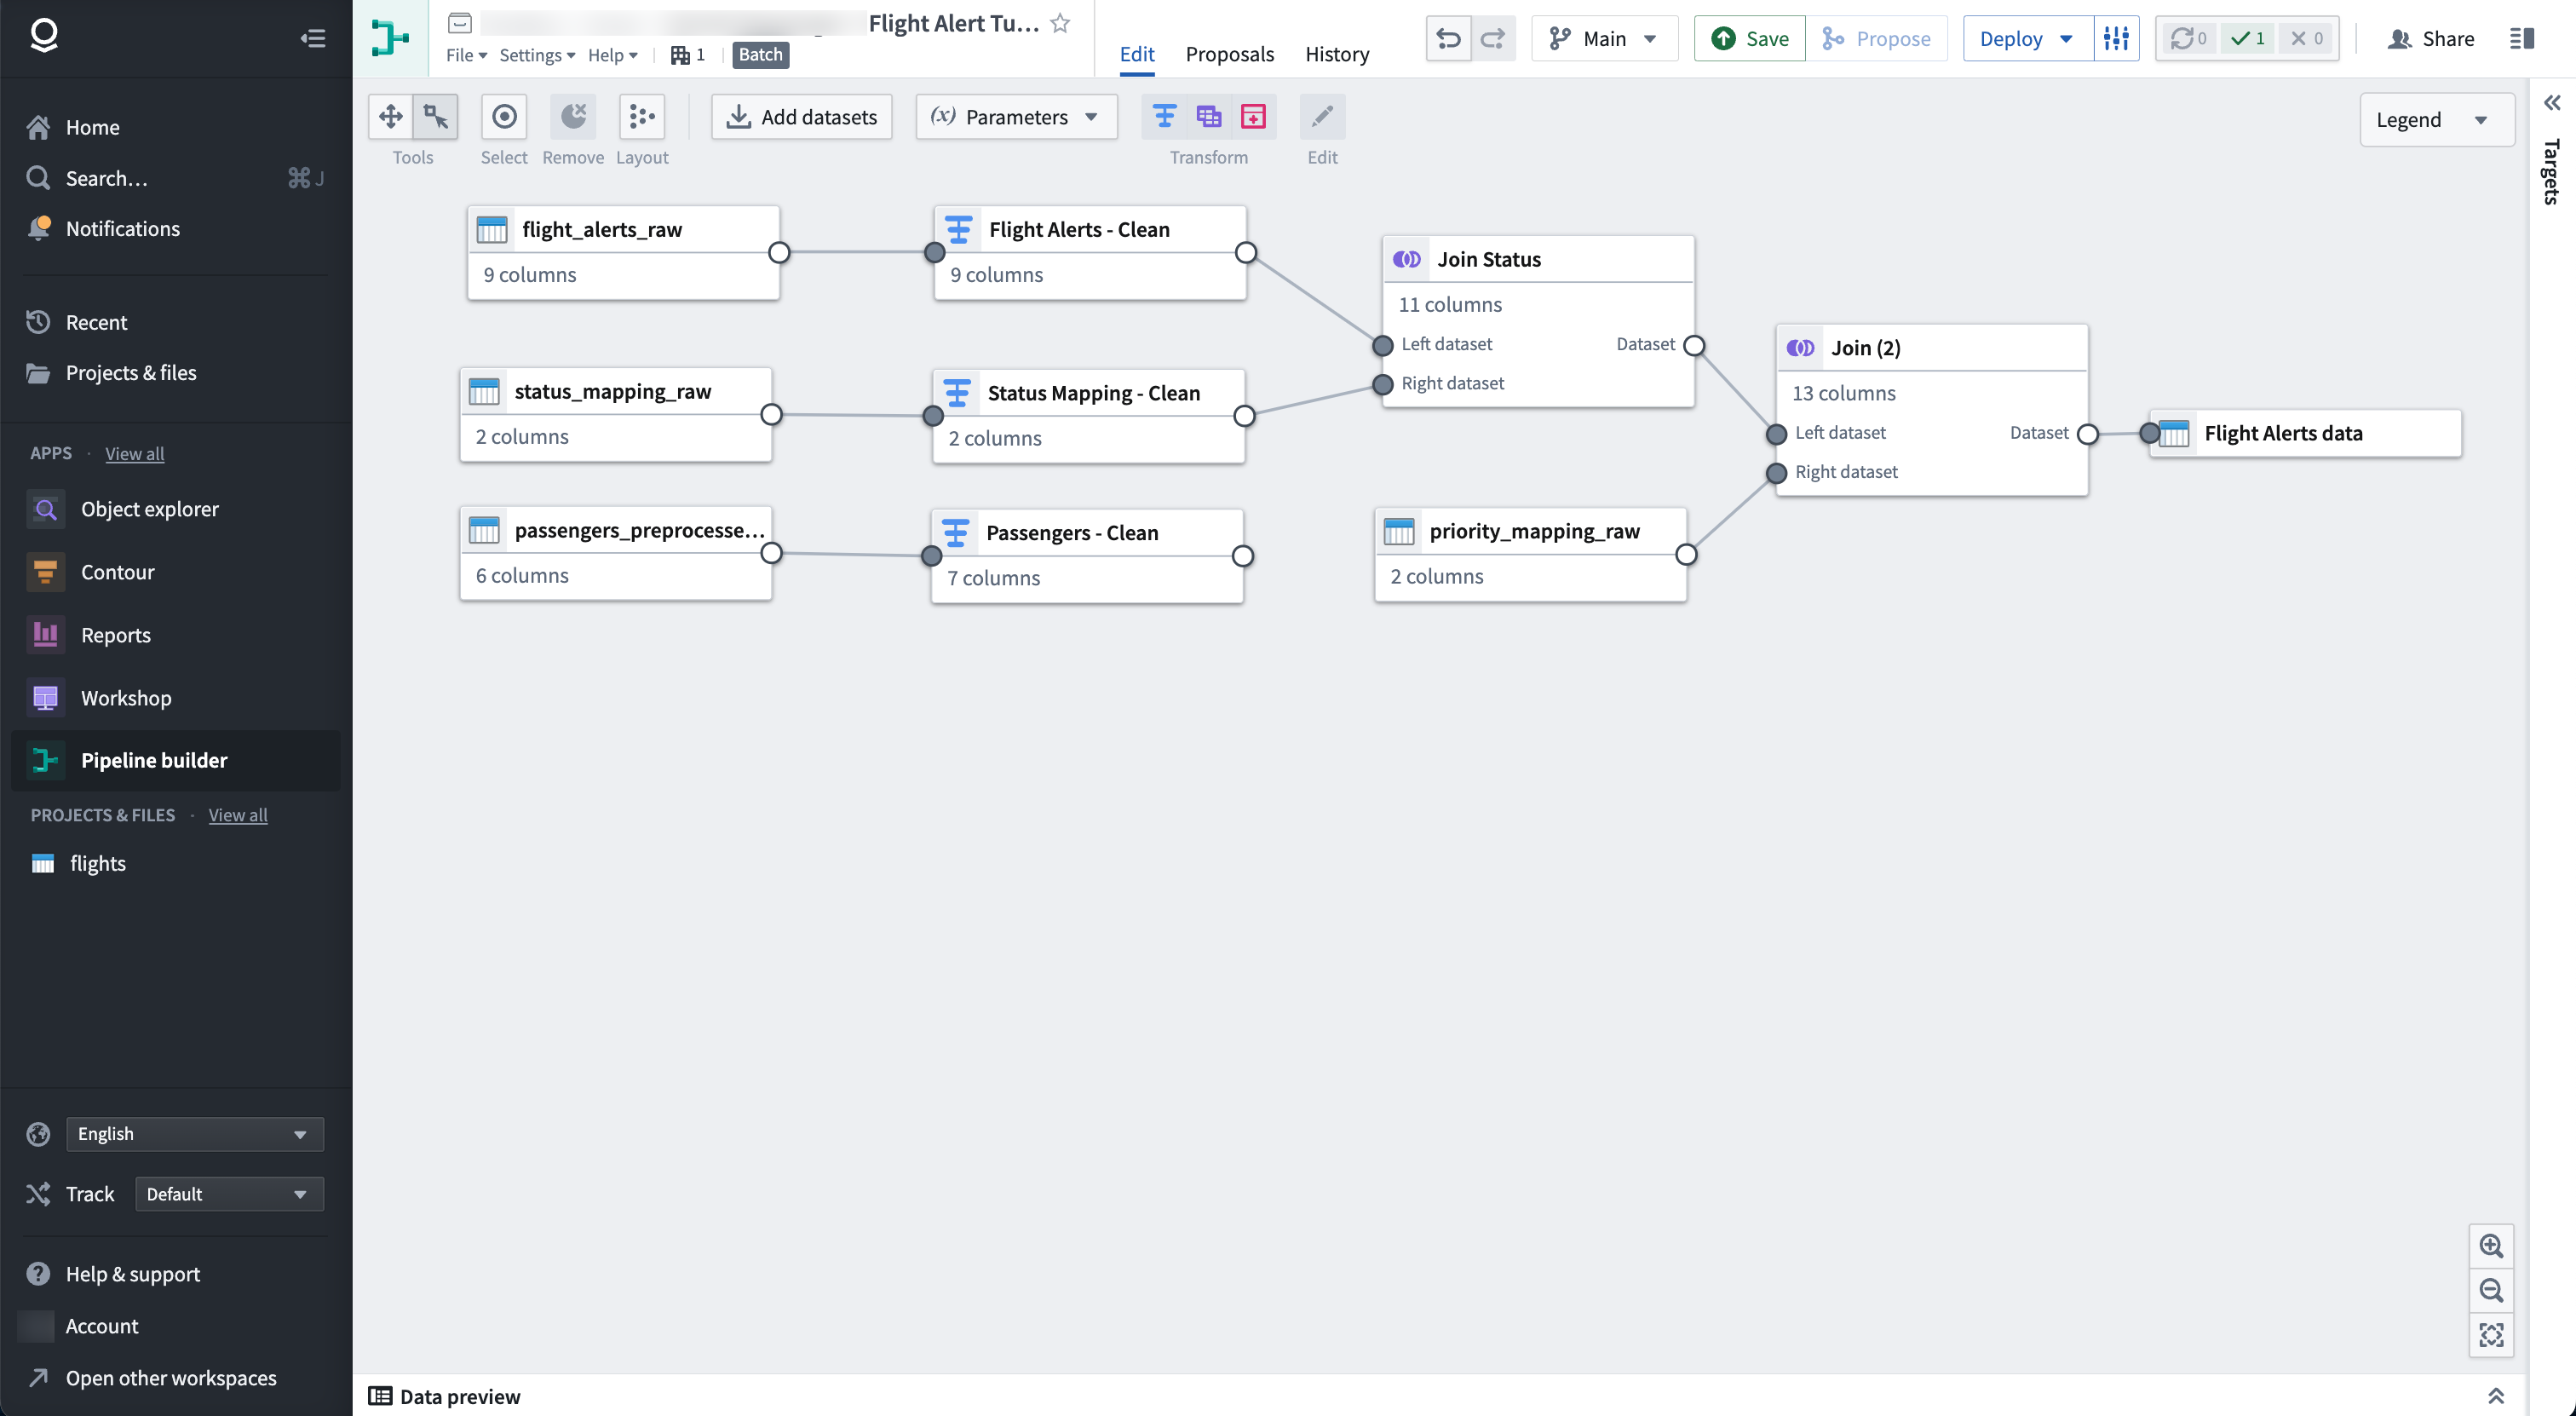
The pipeline will produce a new dataset output of Flight Alerts Data that you can use for further exploration in the platform.
:::callout{theme="success" title="Palantir Learning portal"} You can find a deep dive course on building your first pipeline at learn.palantir.com ↗. :::
Part 1: Initial setup
First, create a new pipeline.
-
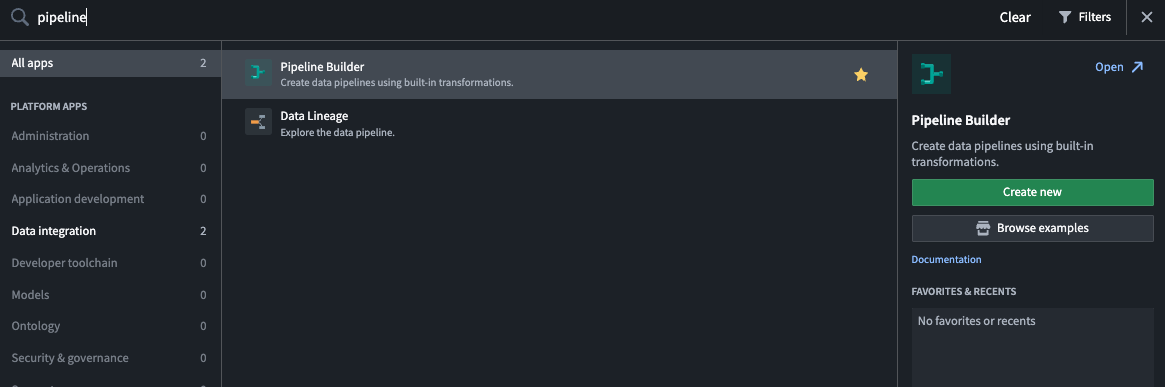
When logged into Foundry, select Applications from the left navigation sidebar to search for and open Pipeline Builder
-
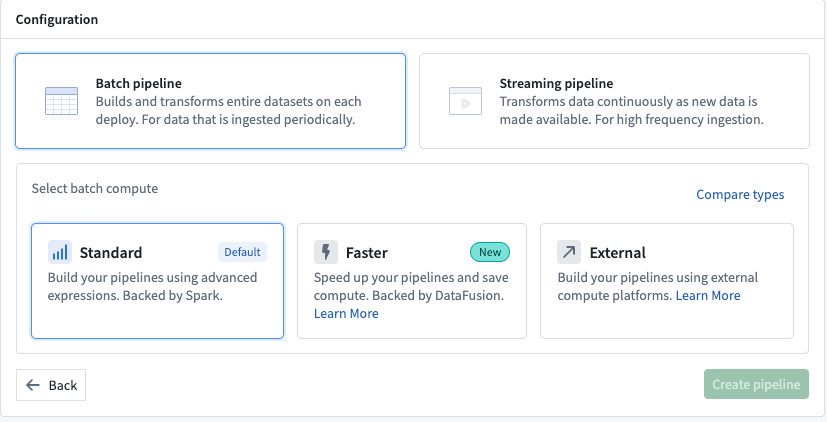
Next, on the Pipeline Builder landing page, create a new pipeline by selecting New pipeline, then choose Batch pipeline. Under Select batch compute, choose Standard.
:::callout{theme="neutral"} The ability to create a streaming pipeline is not available on all Foundry environments. Contact Palantir Support for more information if your use case requires it. :::
-
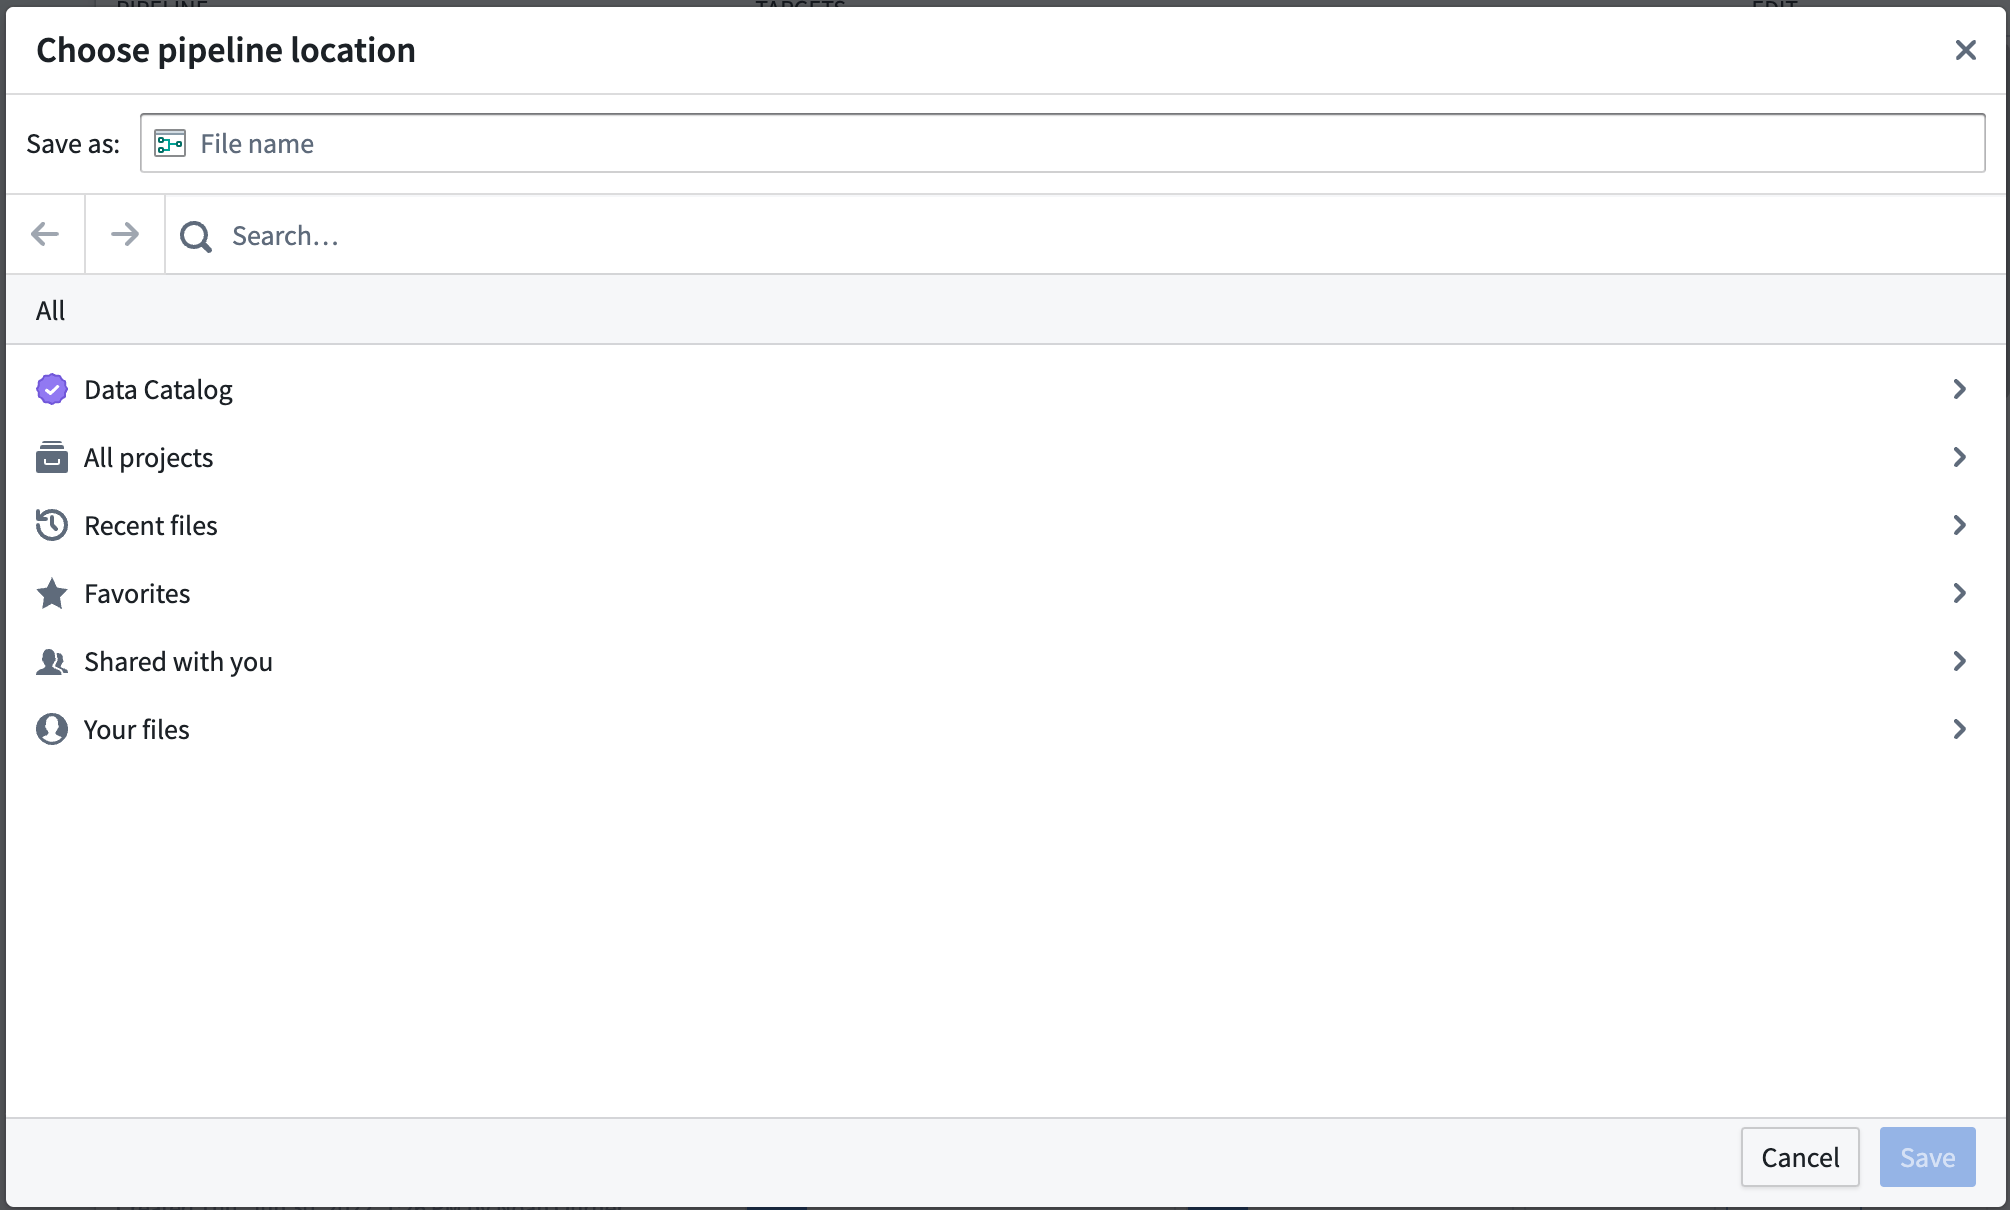
Select a location to save your pipeline. Note that pipelines cannot be saved in personal folders.
-
Select Create pipeline.
Part 2: Add datasets
Now, you can add datasets to your pipeline workflow. Use sample datasets of notional or open-source data.
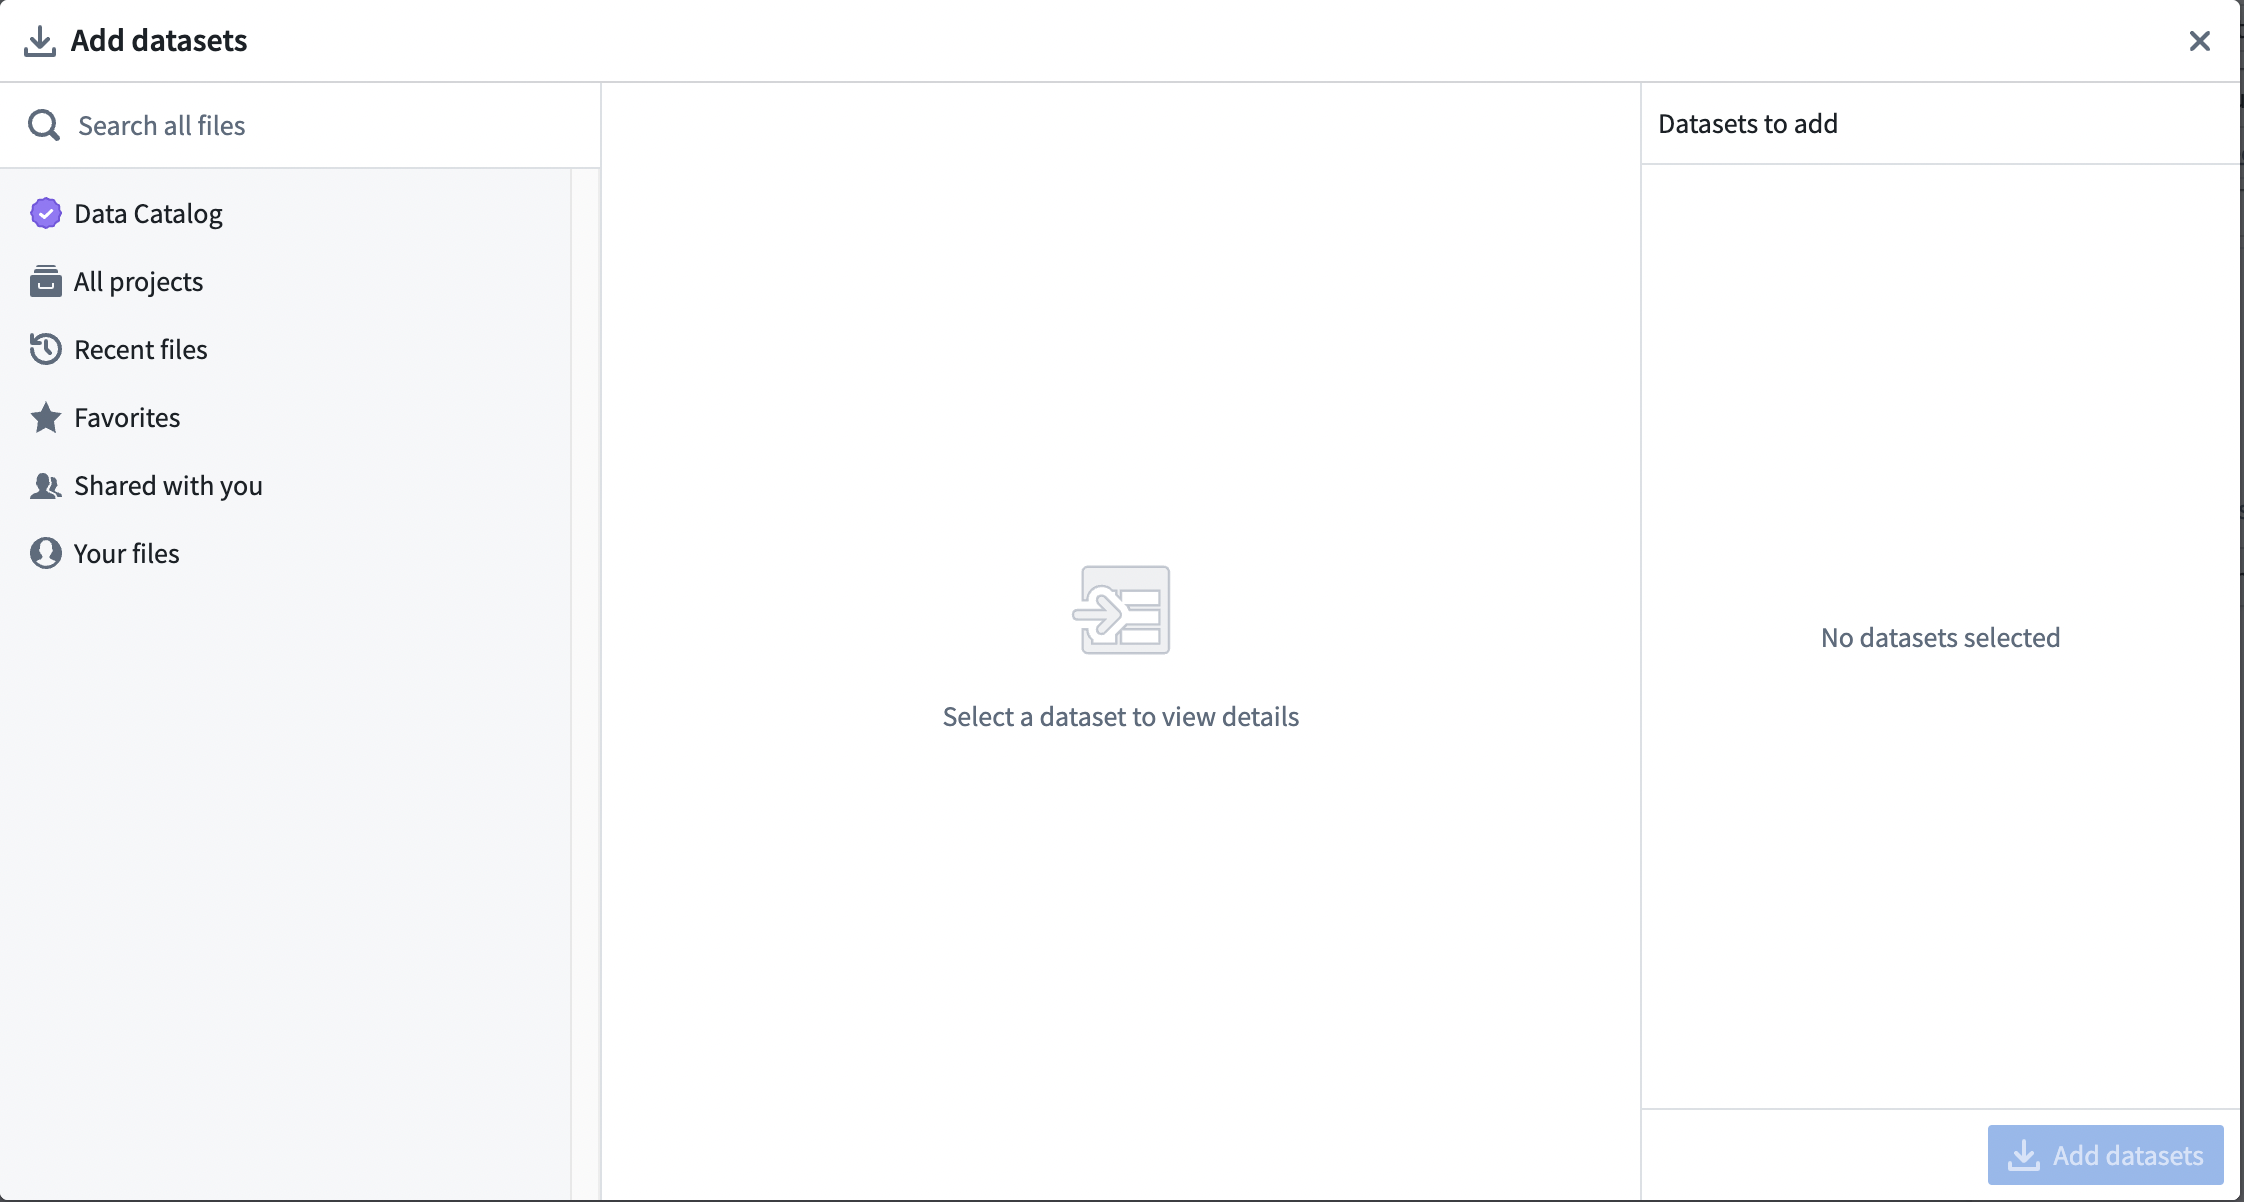
From the Pipeline Builder page, select Add datasets from Foundry.
Alternatively, you can drag and drop a file from your computer to use as your dataset.
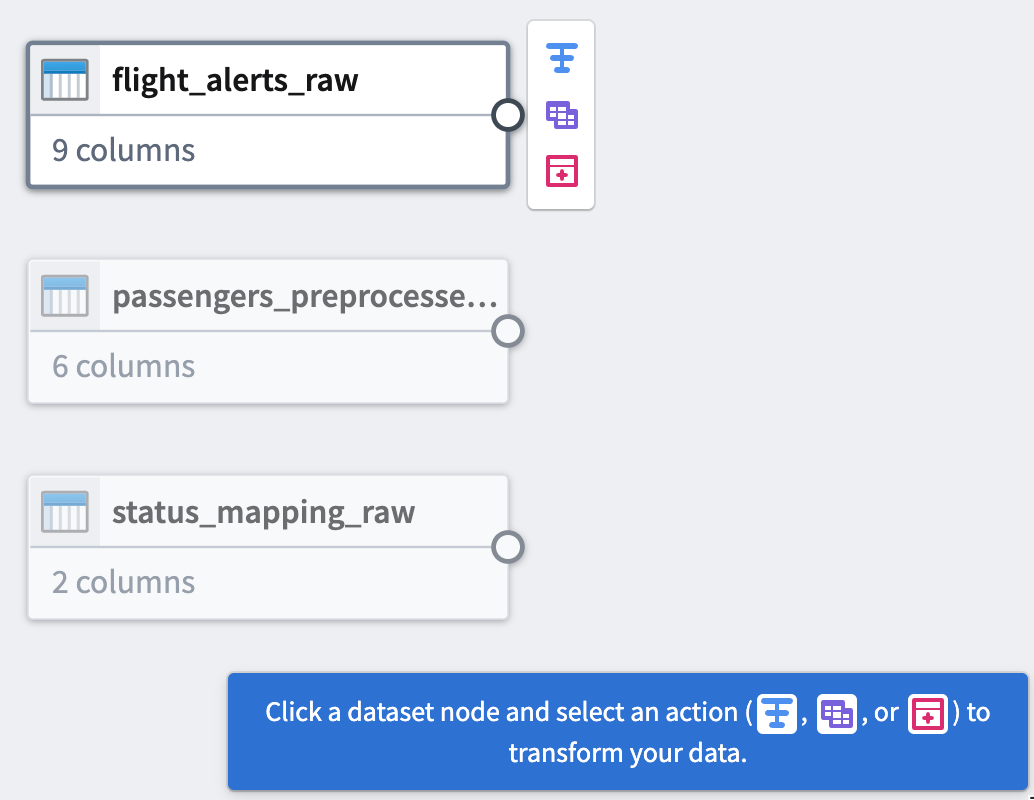
In this walkthrough example, you can add the passengers_preprocessed, flight_alerts_raw, and status_mapping_raw datasets. To add a selection of datasets, select the dataset. Then, choose the inline + icon, or select Add to Selection.
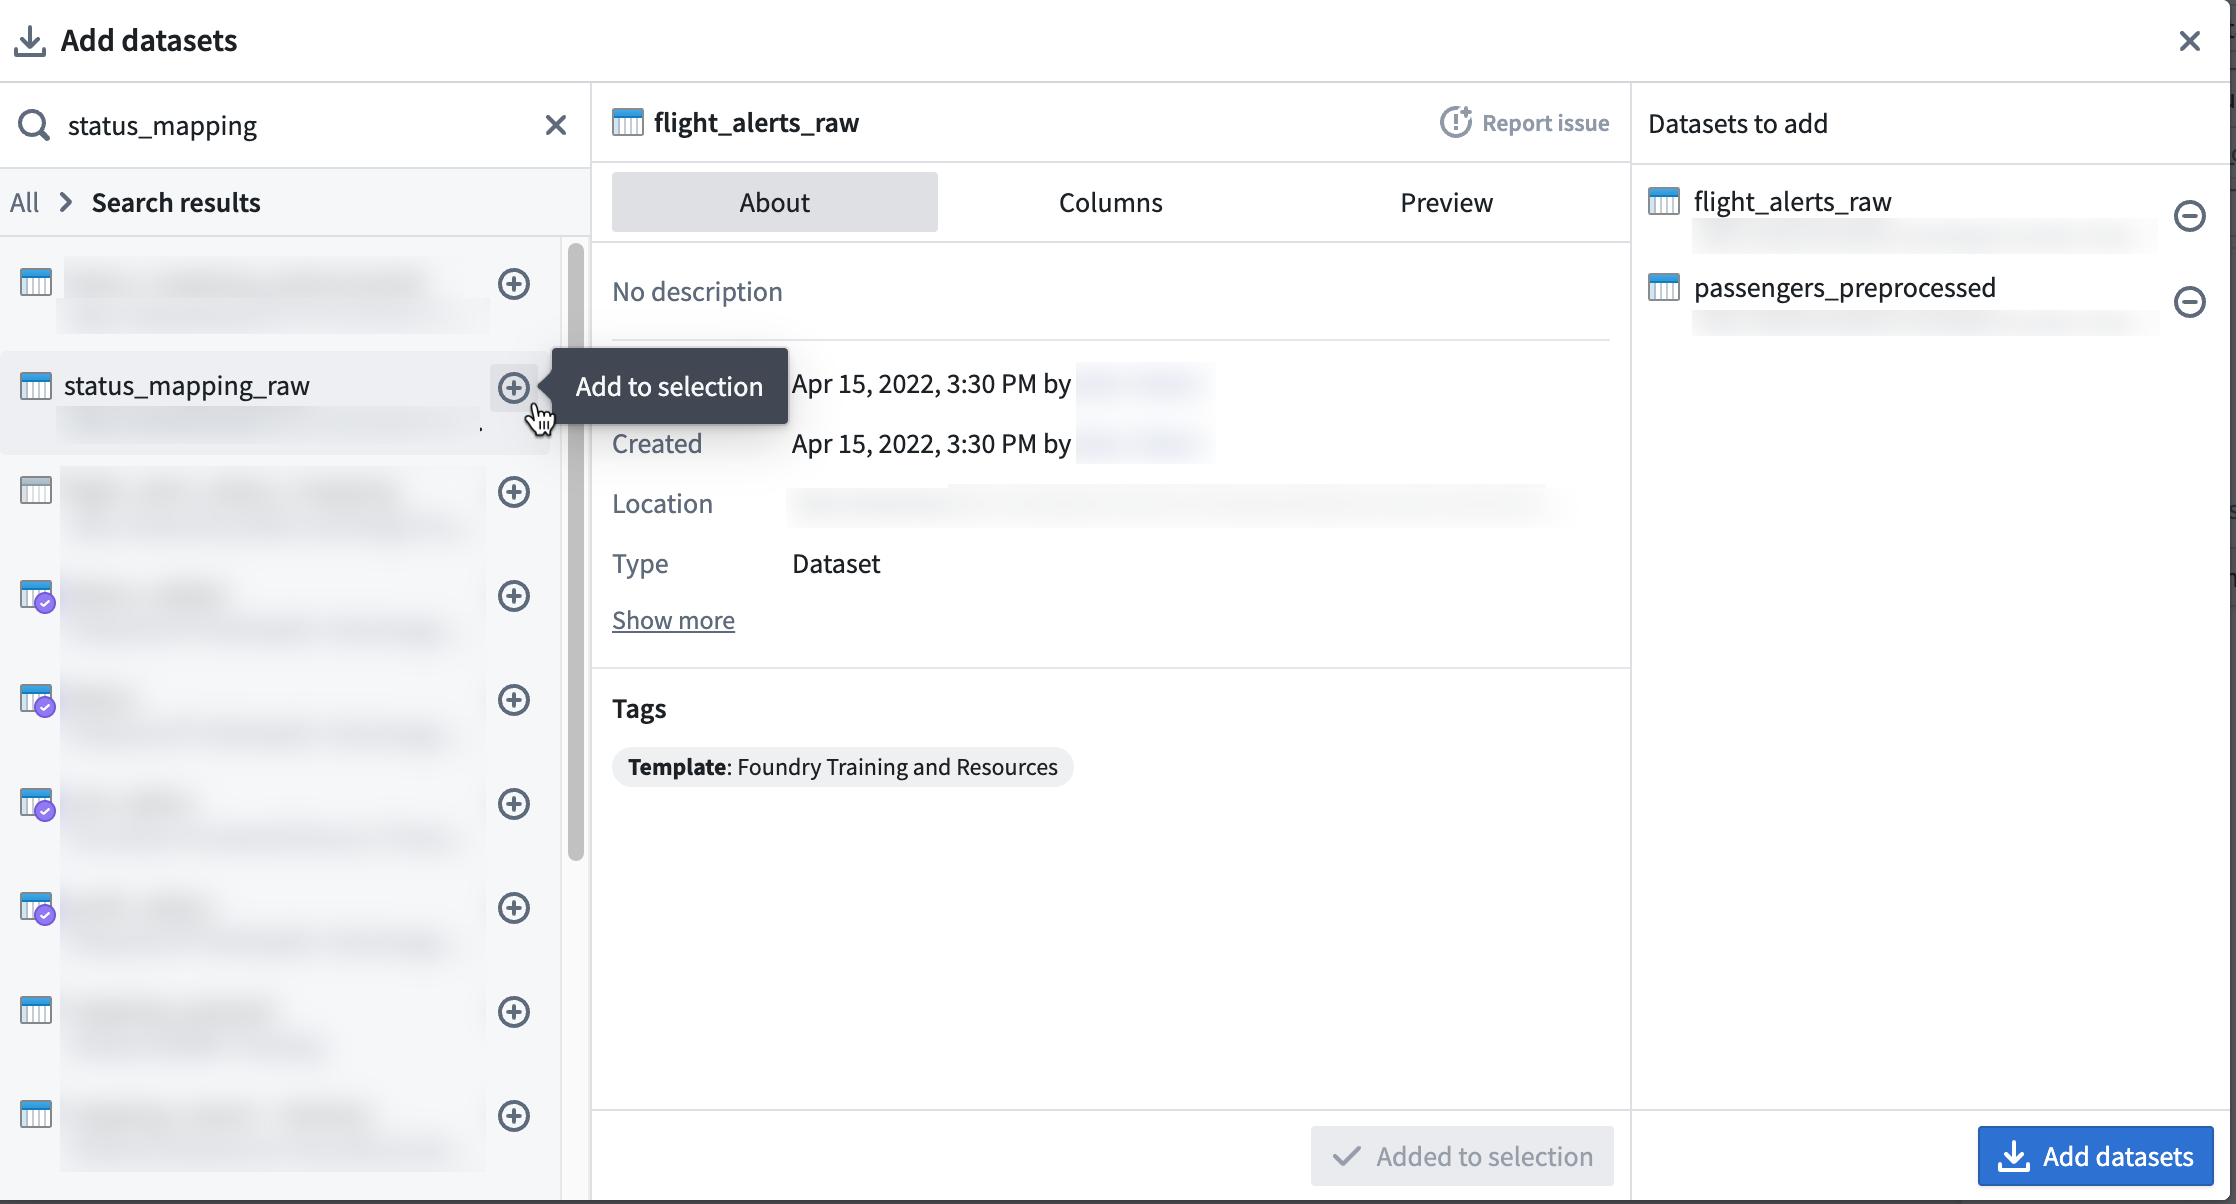
After selecting all required datasets, choose Add datasets.
Part 3: Clean data
After adding raw datasets, you can perform some basic cleaning transforms to continue defining your pipeline. You will transform three of your raw datasets.
Dataset 1
The first step is to clean the passengers_preprocessed dataset. Start by setting up a cast transform to change the dob column name into dob_date while converting the values to the MM/dd/yy format.
Cast transform
-
Select the
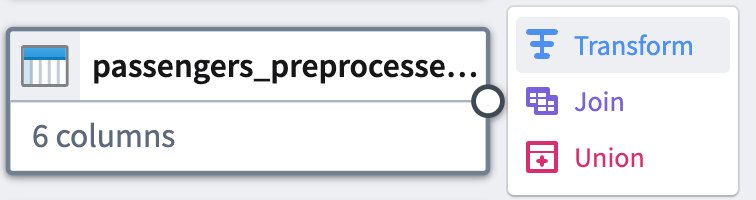
passengers_preprocessednode in your graph. -
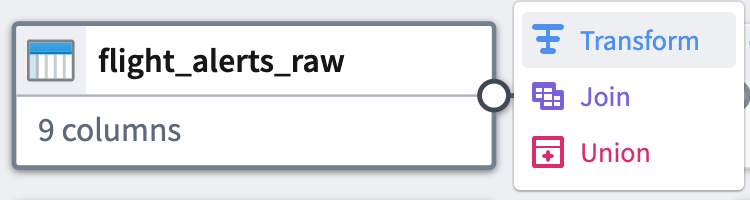
Select Transform.
-
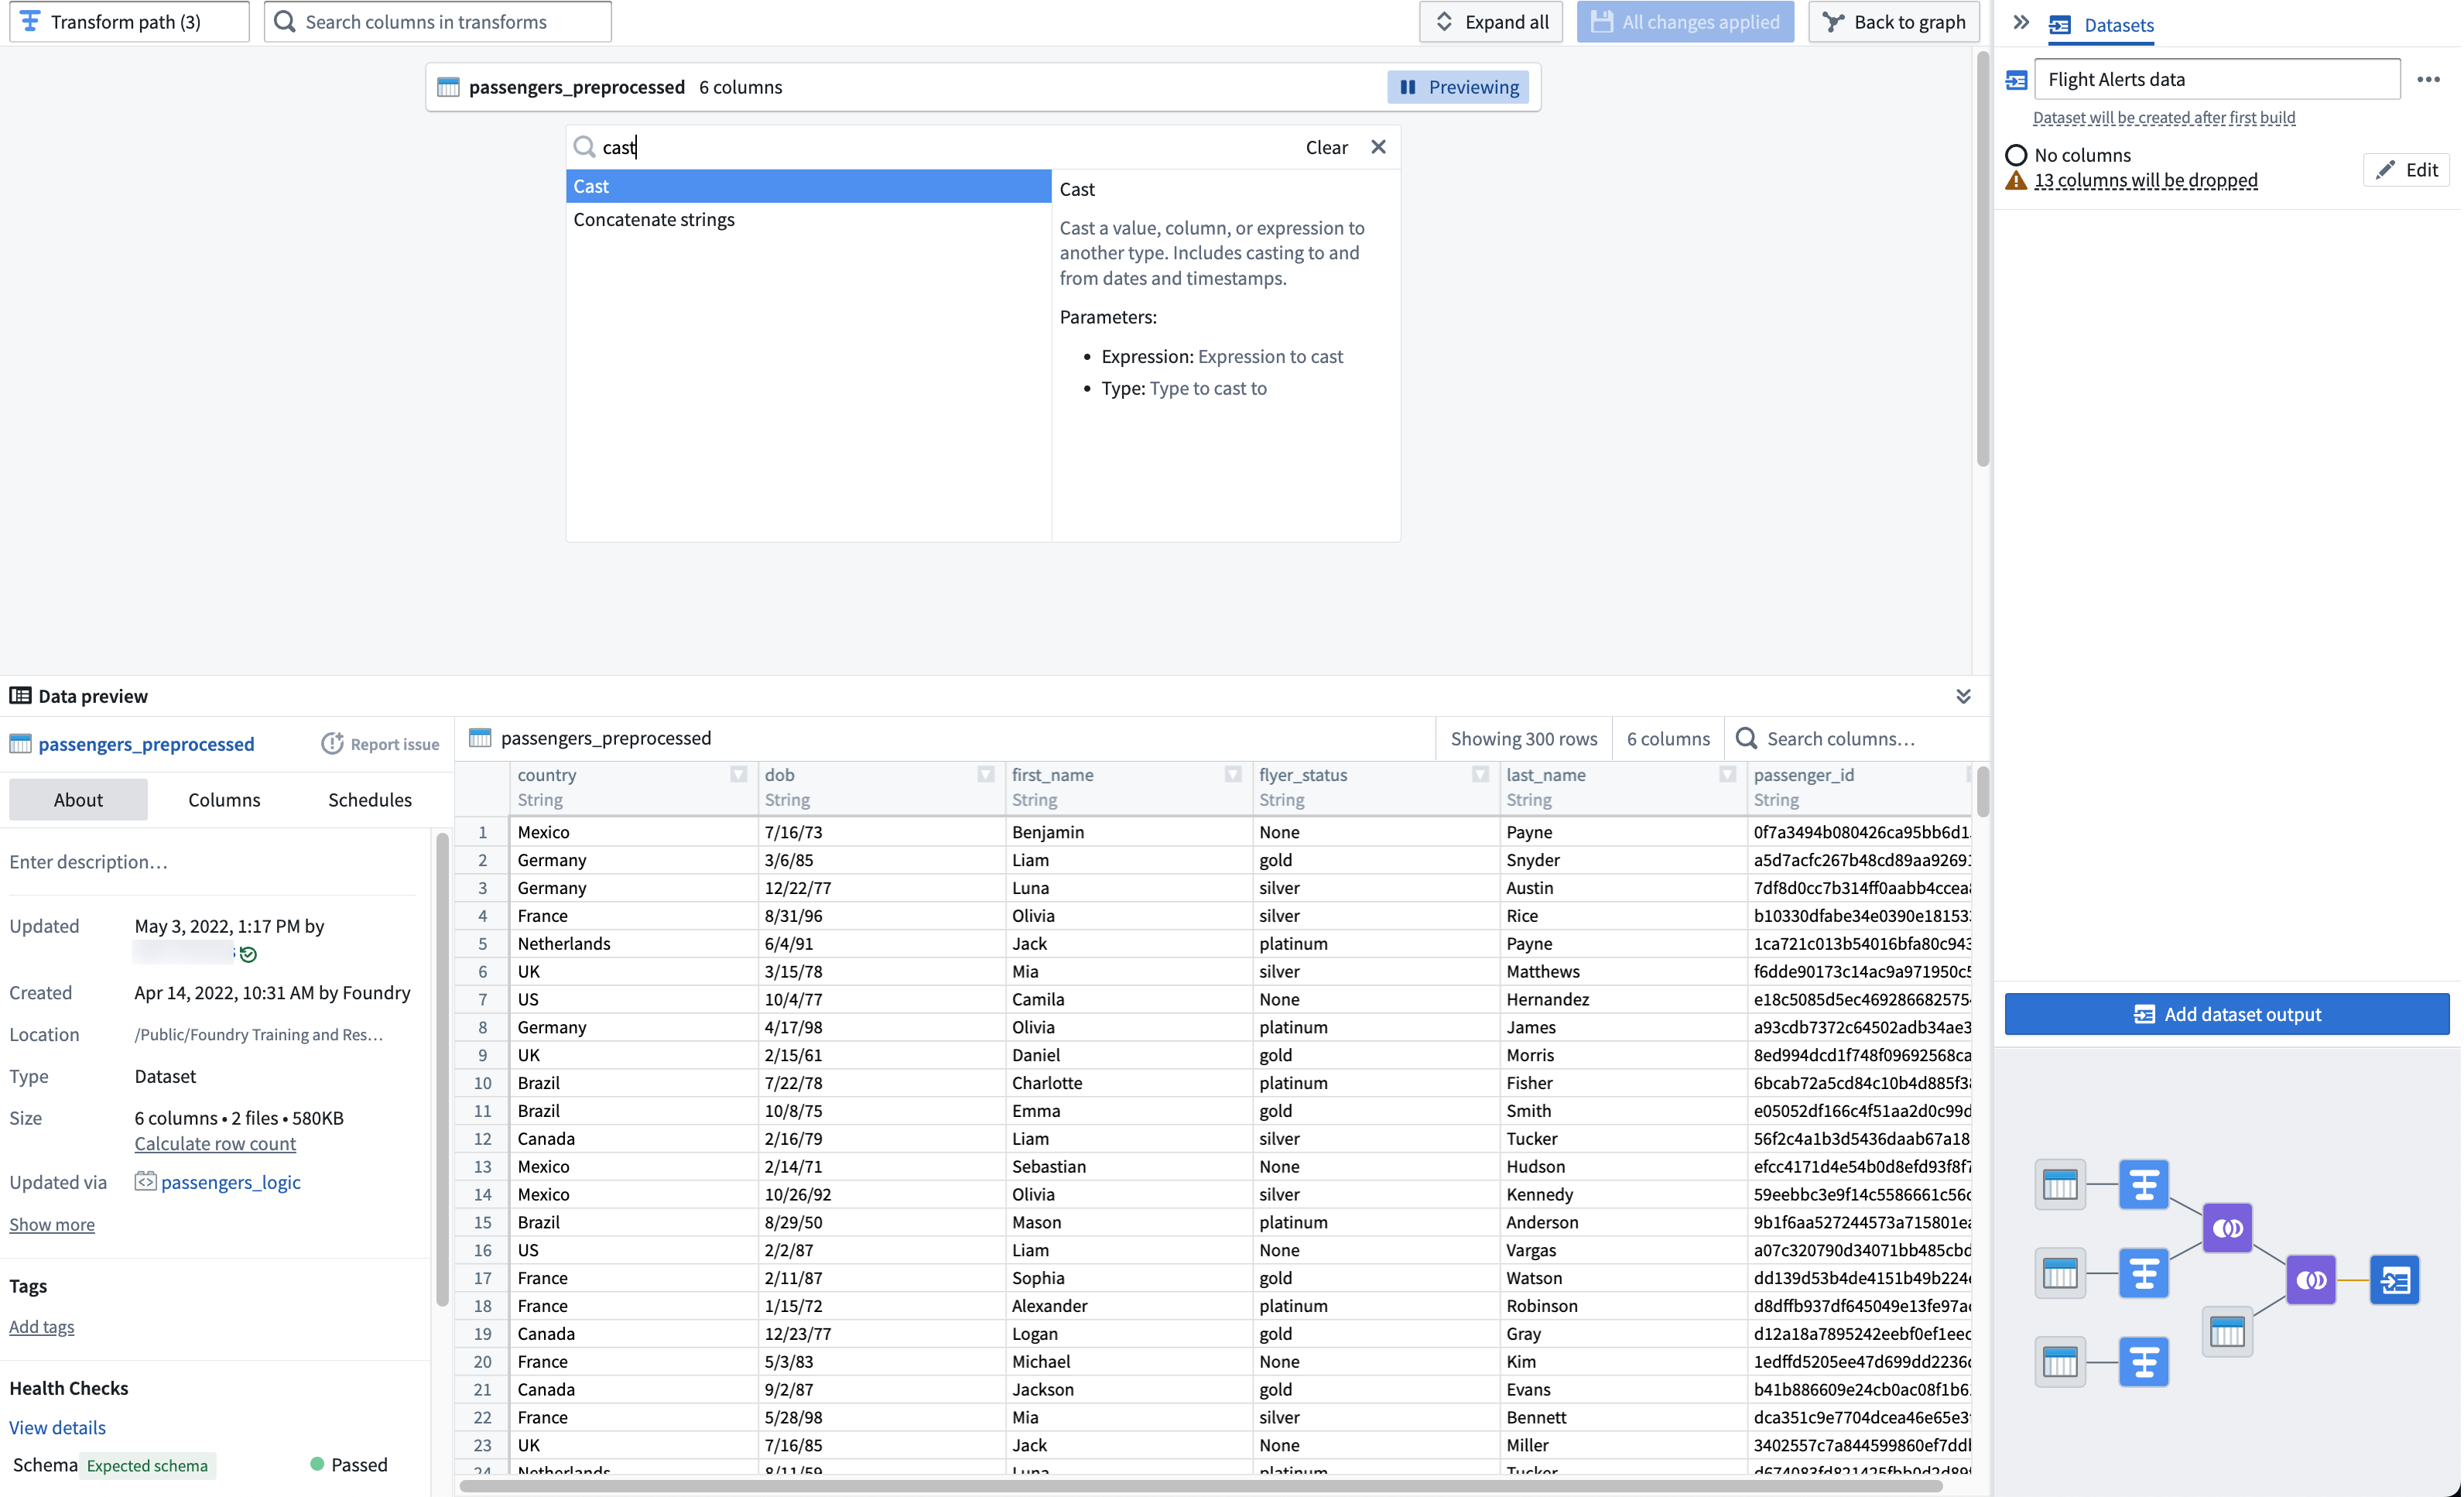
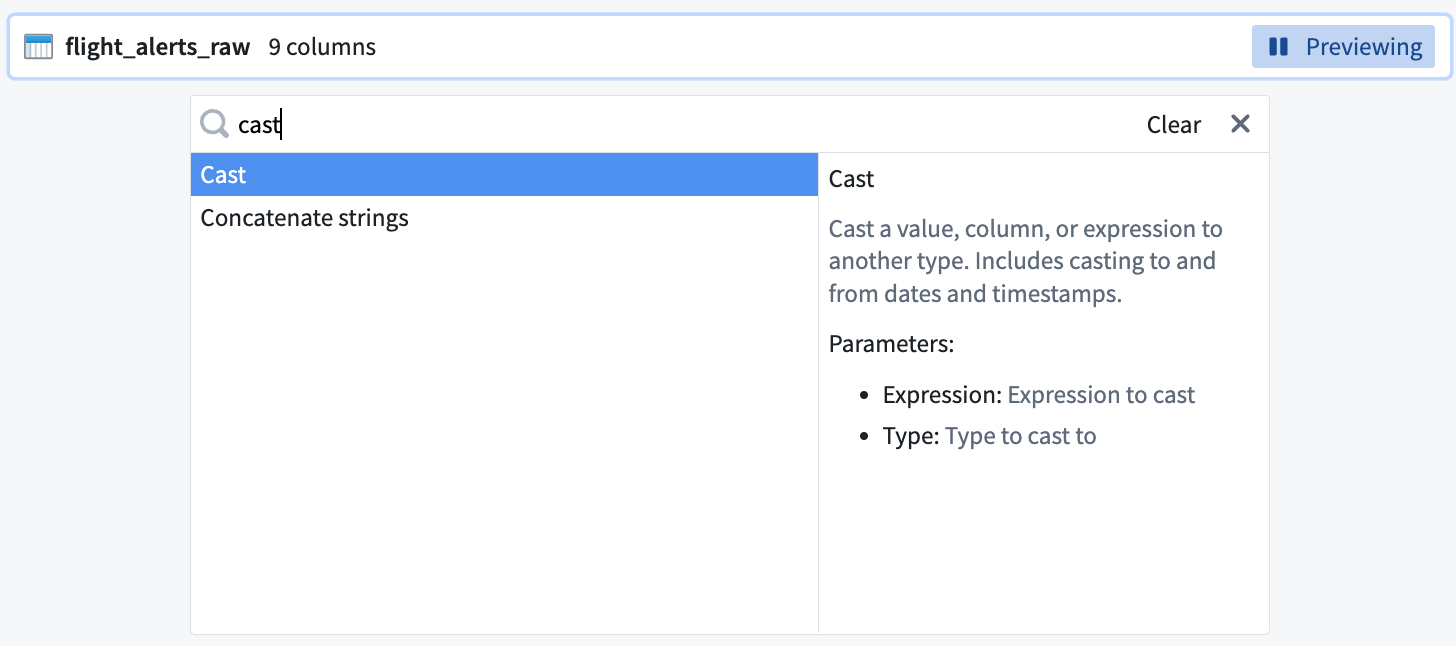
Search for and select the cast transform from the dropdown menu to open the cast configuration board.
-
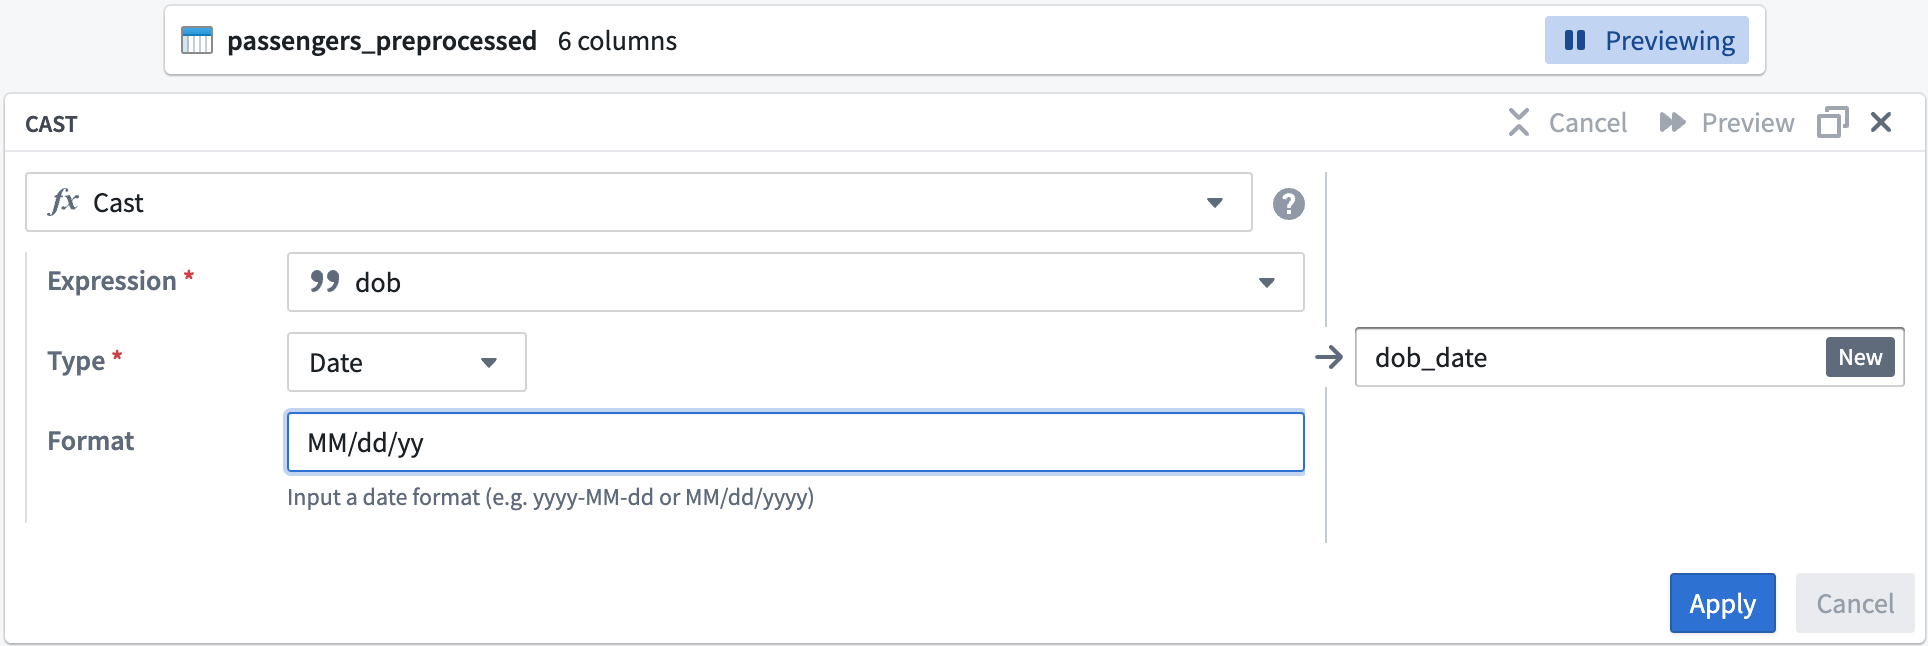
From the Expression field, select
dob; for Type, selectDate. -
Enter
MM/dd/yyfor the Format type. Be sure to use uppercaseMMto ensure a successful cast transform. Change the output column name todob_date.
Your cast board should look like this:
- Select Apply to add the transform to your pipeline.
Title case transform
Now, you can format the flyer_status column values to start with an uppercase letter.
-
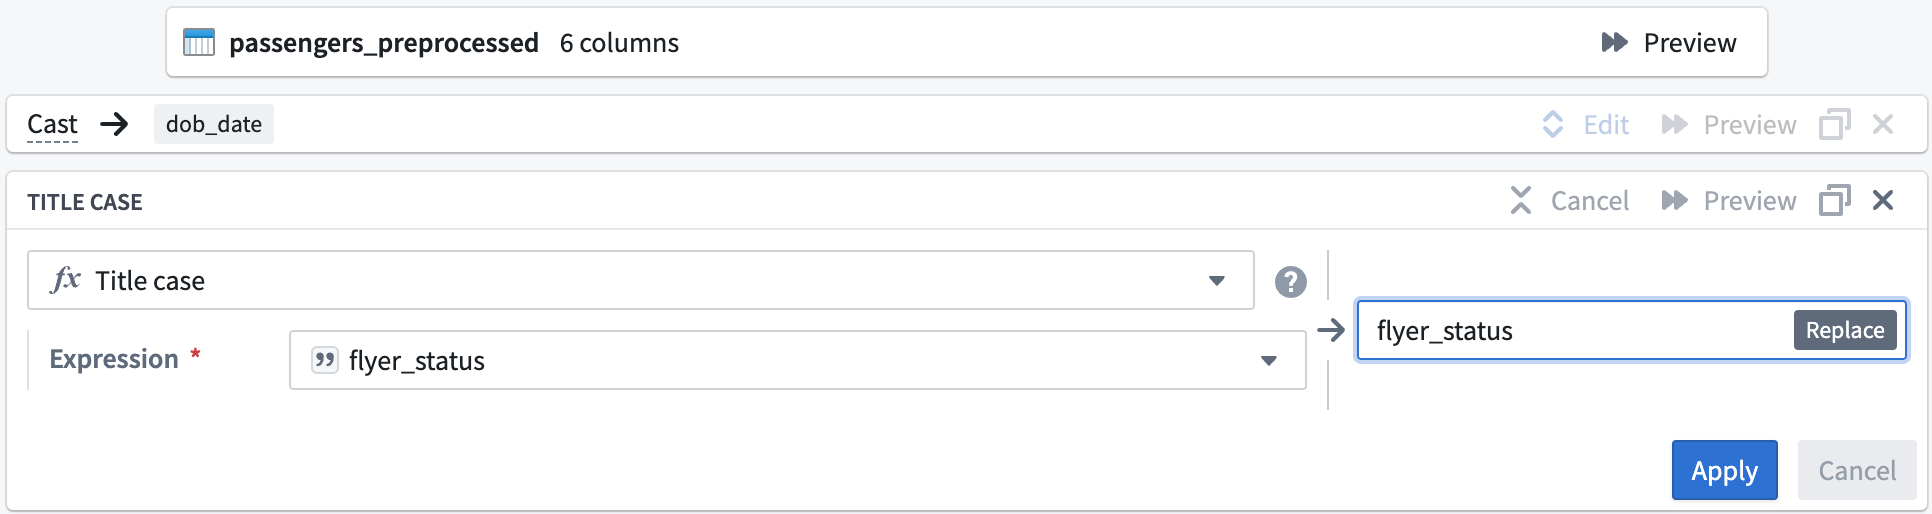
In the transform search field, search for and select the Title case transform to open the title case configuration board.
-
In the Expression field, select the
flyer_statuscolumn from the dropdown.
Your title case board should look like this:
-
Select Apply to add the transform to your pipeline.
-
In the top left corner of the transform configuration window, rename the transform
Passengers_Clean.
-
Select Back to graph at the top right of the screen to return to your pipeline graph.
Dataset 2
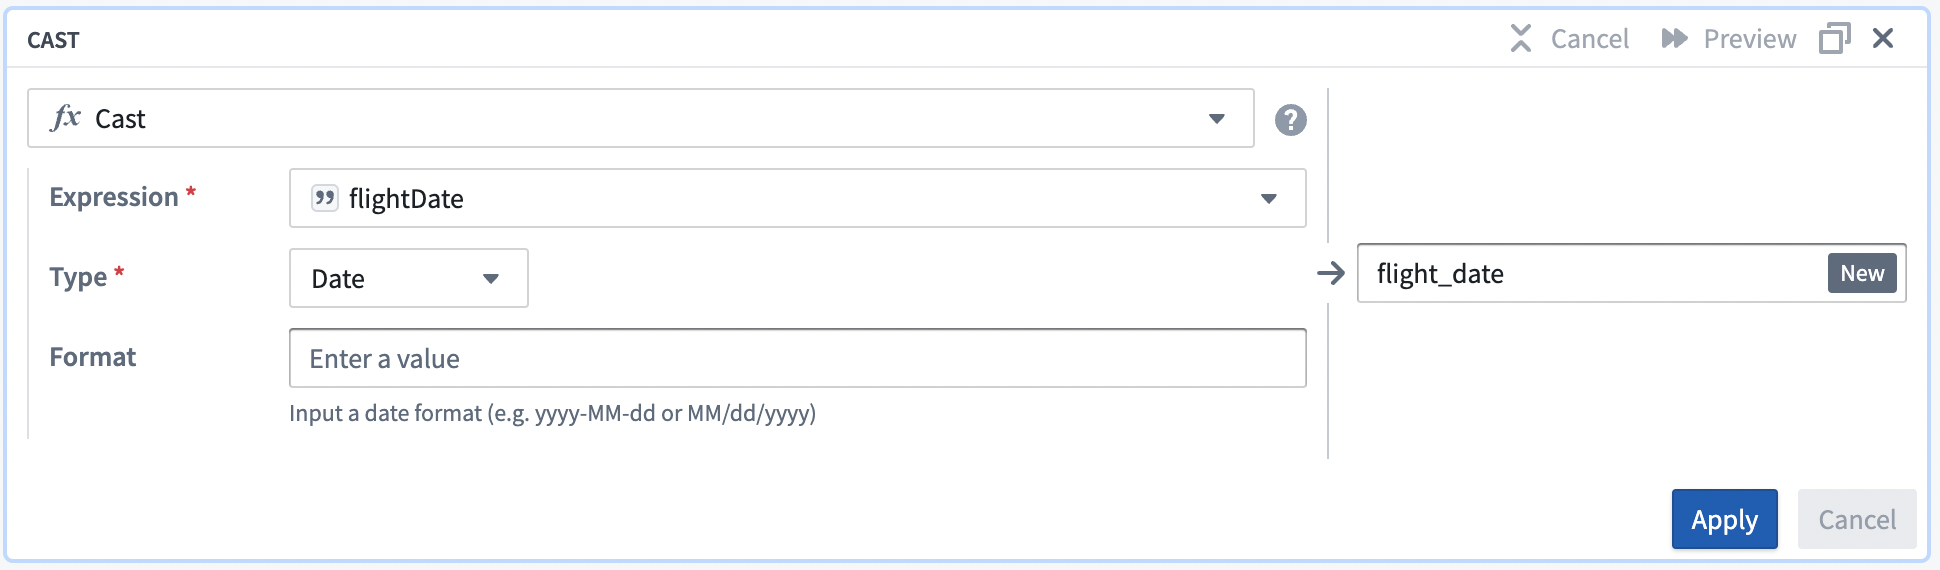
Now, clean the flight_alerts_raw dataset. The first step is to set up another cast transform to convert the flight-date column values into a MM/dd/yy format.
Cast transform
-
Select the
flight_alerts_rawdataset node in your graph. -
Select Transform.
-
Search for and select the cast transform from the dropdown menu to open the cast configuration board. You can read the function definition listed on the right side of the selection box to learn more about the function.
-
In the Expression field, select the
flight_datecolumn from the dropdown. -
Choose
Datefrom the Type field dropdown menu. -
Enter
MM/dd/yyfor the Format type. Be sure to use uppercaseMMto ensure a successful cast transform.
Your cast board should look like this:
- Select Apply to add the transform to your pipeline.
Clean string transform
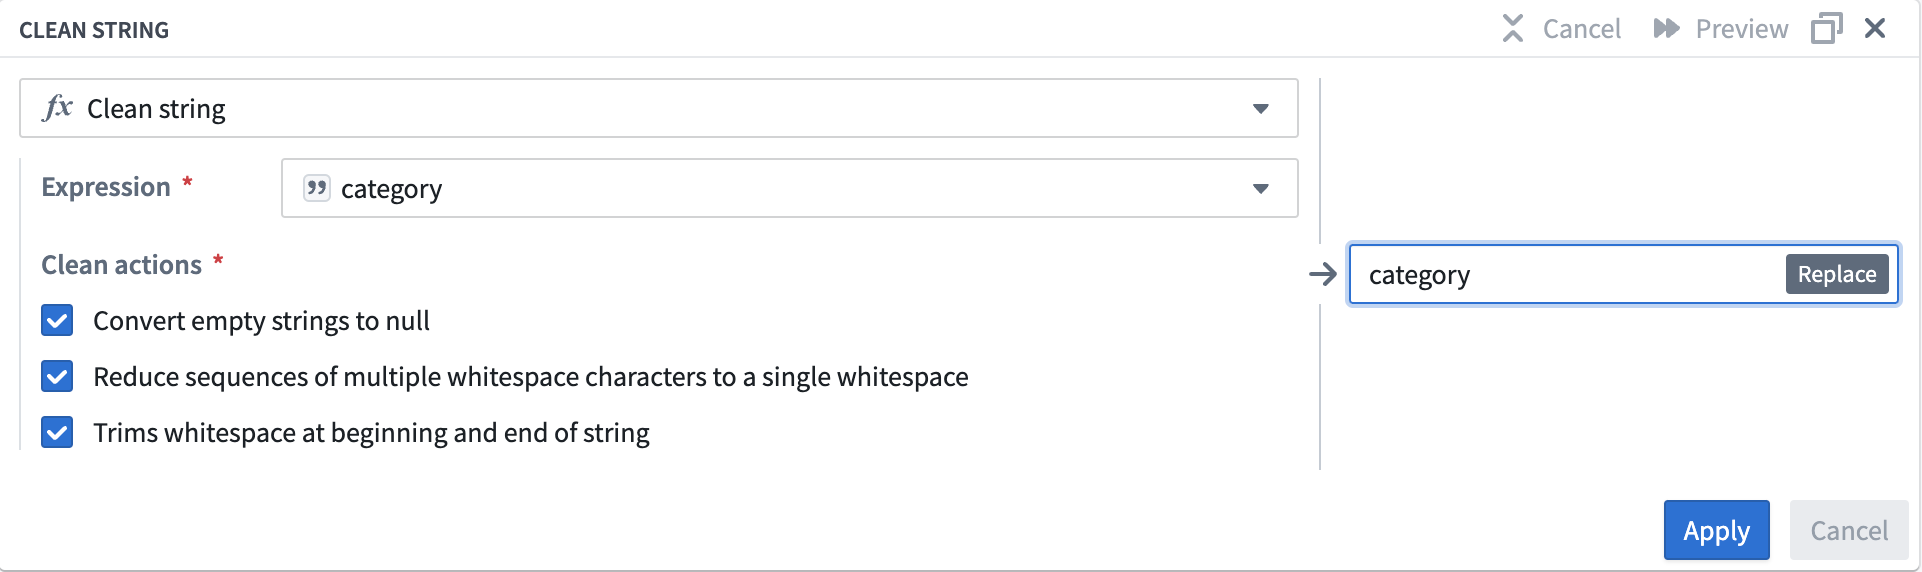
Now, add a Clean string transform that will remove whitespace from category column values. For example, the transform will convert delay··· string values to delay.
-
Search for and select the clean string transform from the dropdown to open the clean string configuration board.
-
In the Expression field, select the
categorycolumn from the dropdown menu. -
Check the boxes for all three of the Clean actions options:
-
Converts empty strings to null
- Reduce sequences of multiple whitespace characters to a single whitespace
- Trims whitespace at beginning and end of string
Your clean string board should look like this:
-
Select Apply to add the transform to your pipeline.
-
In the top left corner of the transform configuration window, rename the transform
Flight Alerts - Clean. -
Select Back to graph at the top right to return to your pipeline graph.
Dataset 3
Finally, clean the status_mapping_raw dataset.
Clean string transform
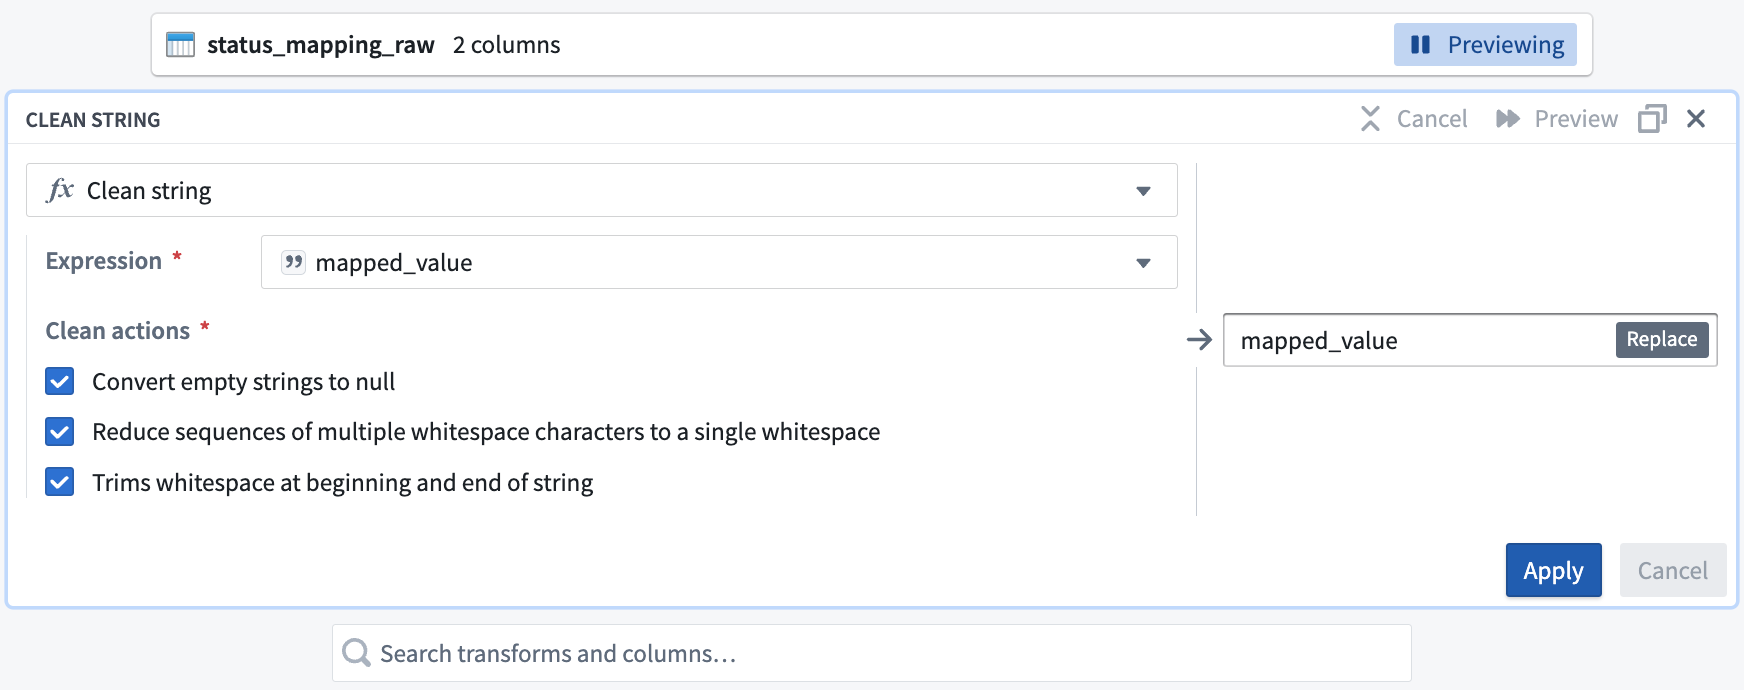
You will only apply a Clean string transform to this dataset.
-
Select the
status_mapping_rawdataset node in your graph. -
Select Transform.
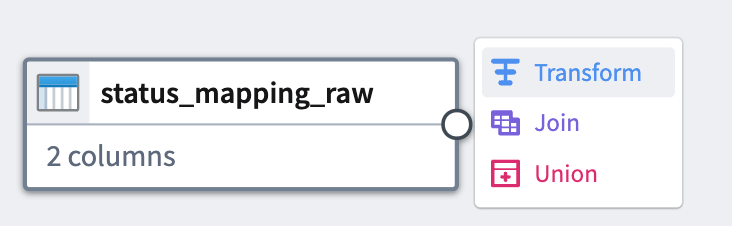
-
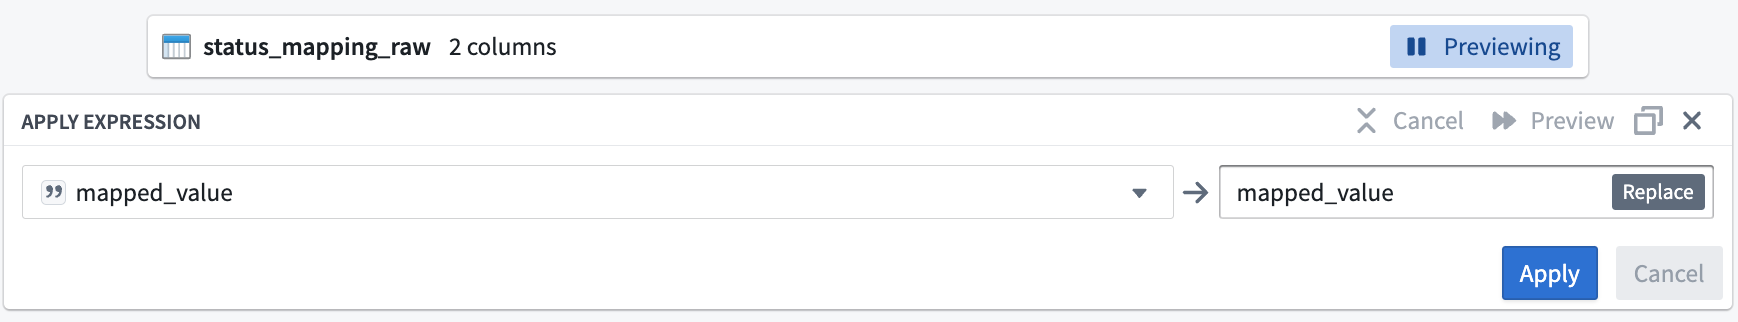
In the Search transforms and columns... field, select the
mapped_valuecolumn from the dropdown menu.
-
In the same field, search and select the clean string transform from the dropdown.
-
Check the boxes for all three of the Clean actions options:
-
Converts empty strings to null
- Reduce sequences of multiple whitespace characters to a single whitespace
- Trims whitespace at beginning and end of string
Your clean string board should look like this:
- Select Apply to add the transform to your pipeline.
- In the top left corner of the transform configuration window, rename the transform
Status Mapping - Clean. - Select Back to graph at the top right to return to your pipeline graph.
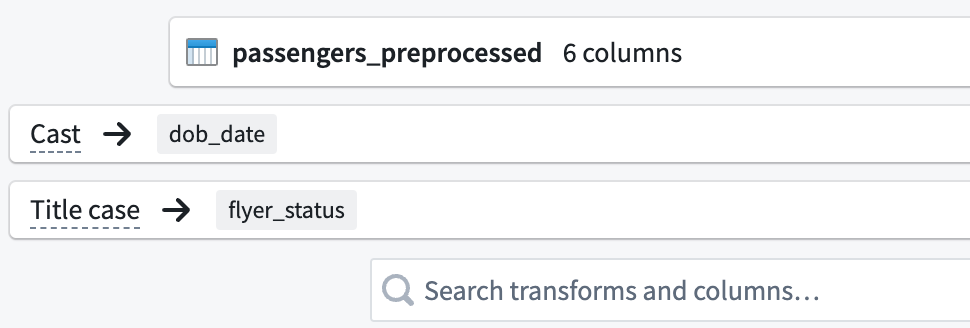
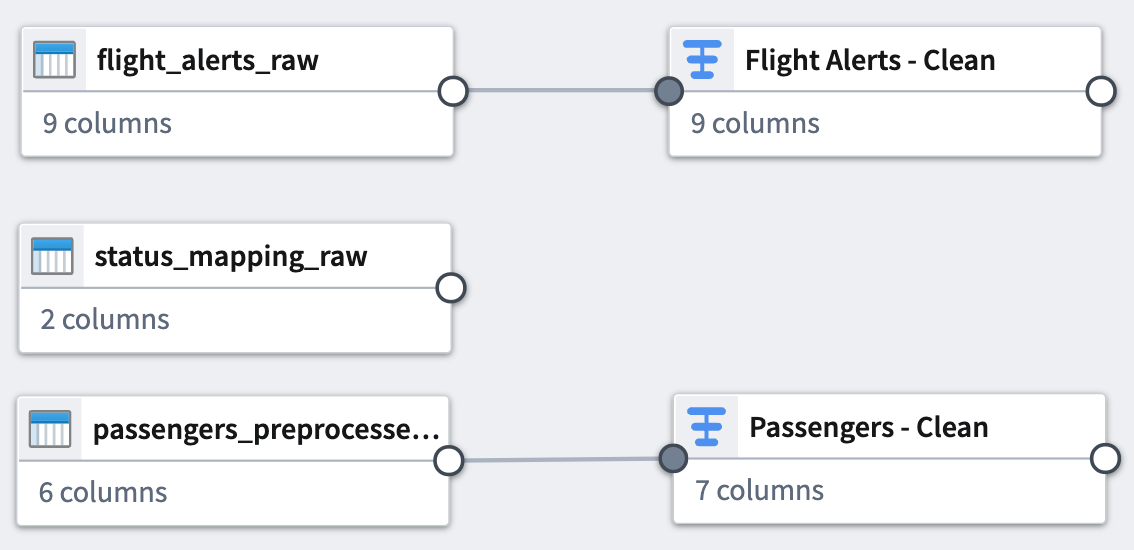
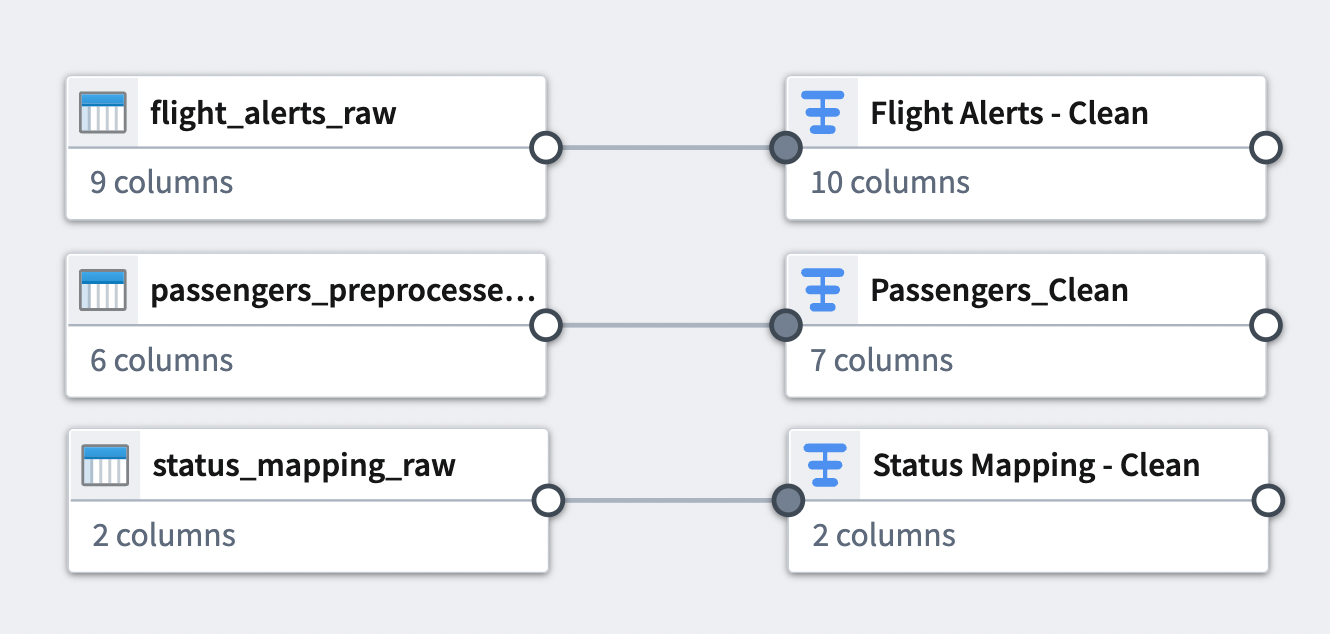
You can see the connection between the transforms you just added and the datasets to which you applied them.
Part 4: Join datasets
Now, you can combine some of the cleaned datasets with joins. A join allows you to combine datasets with at least one matching column. You will add two joins to your pipeline workflow.
Join 1
Your first join will combine two of the cleaned datasets.
-
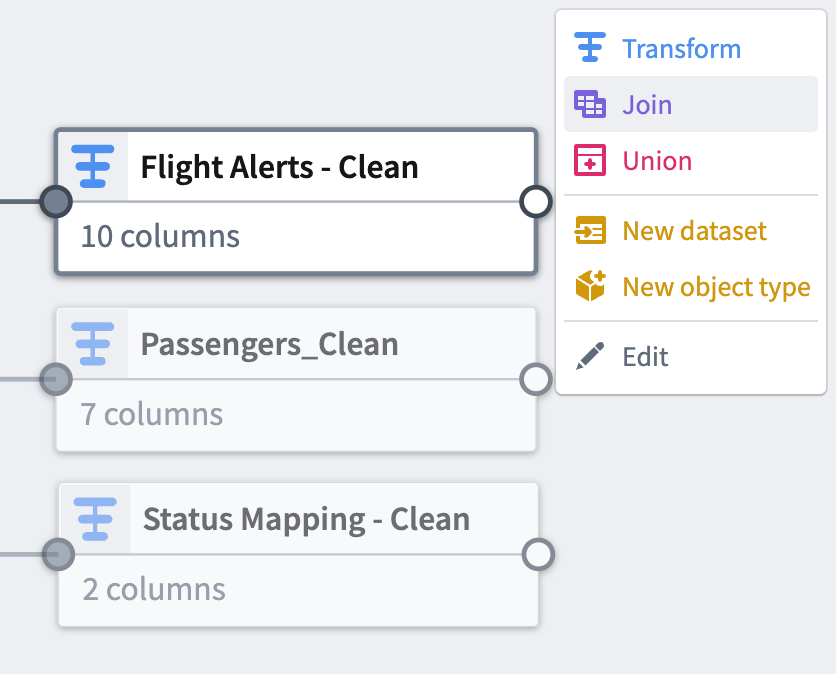
Select the
Flight Alerts - Cleantransform node. This will be the left side of the join. -
Select Join.
-
Choose the
Status Mapping - Cleannode to add it as the right side of the join. -
Select Start to open the join configuration board.

-
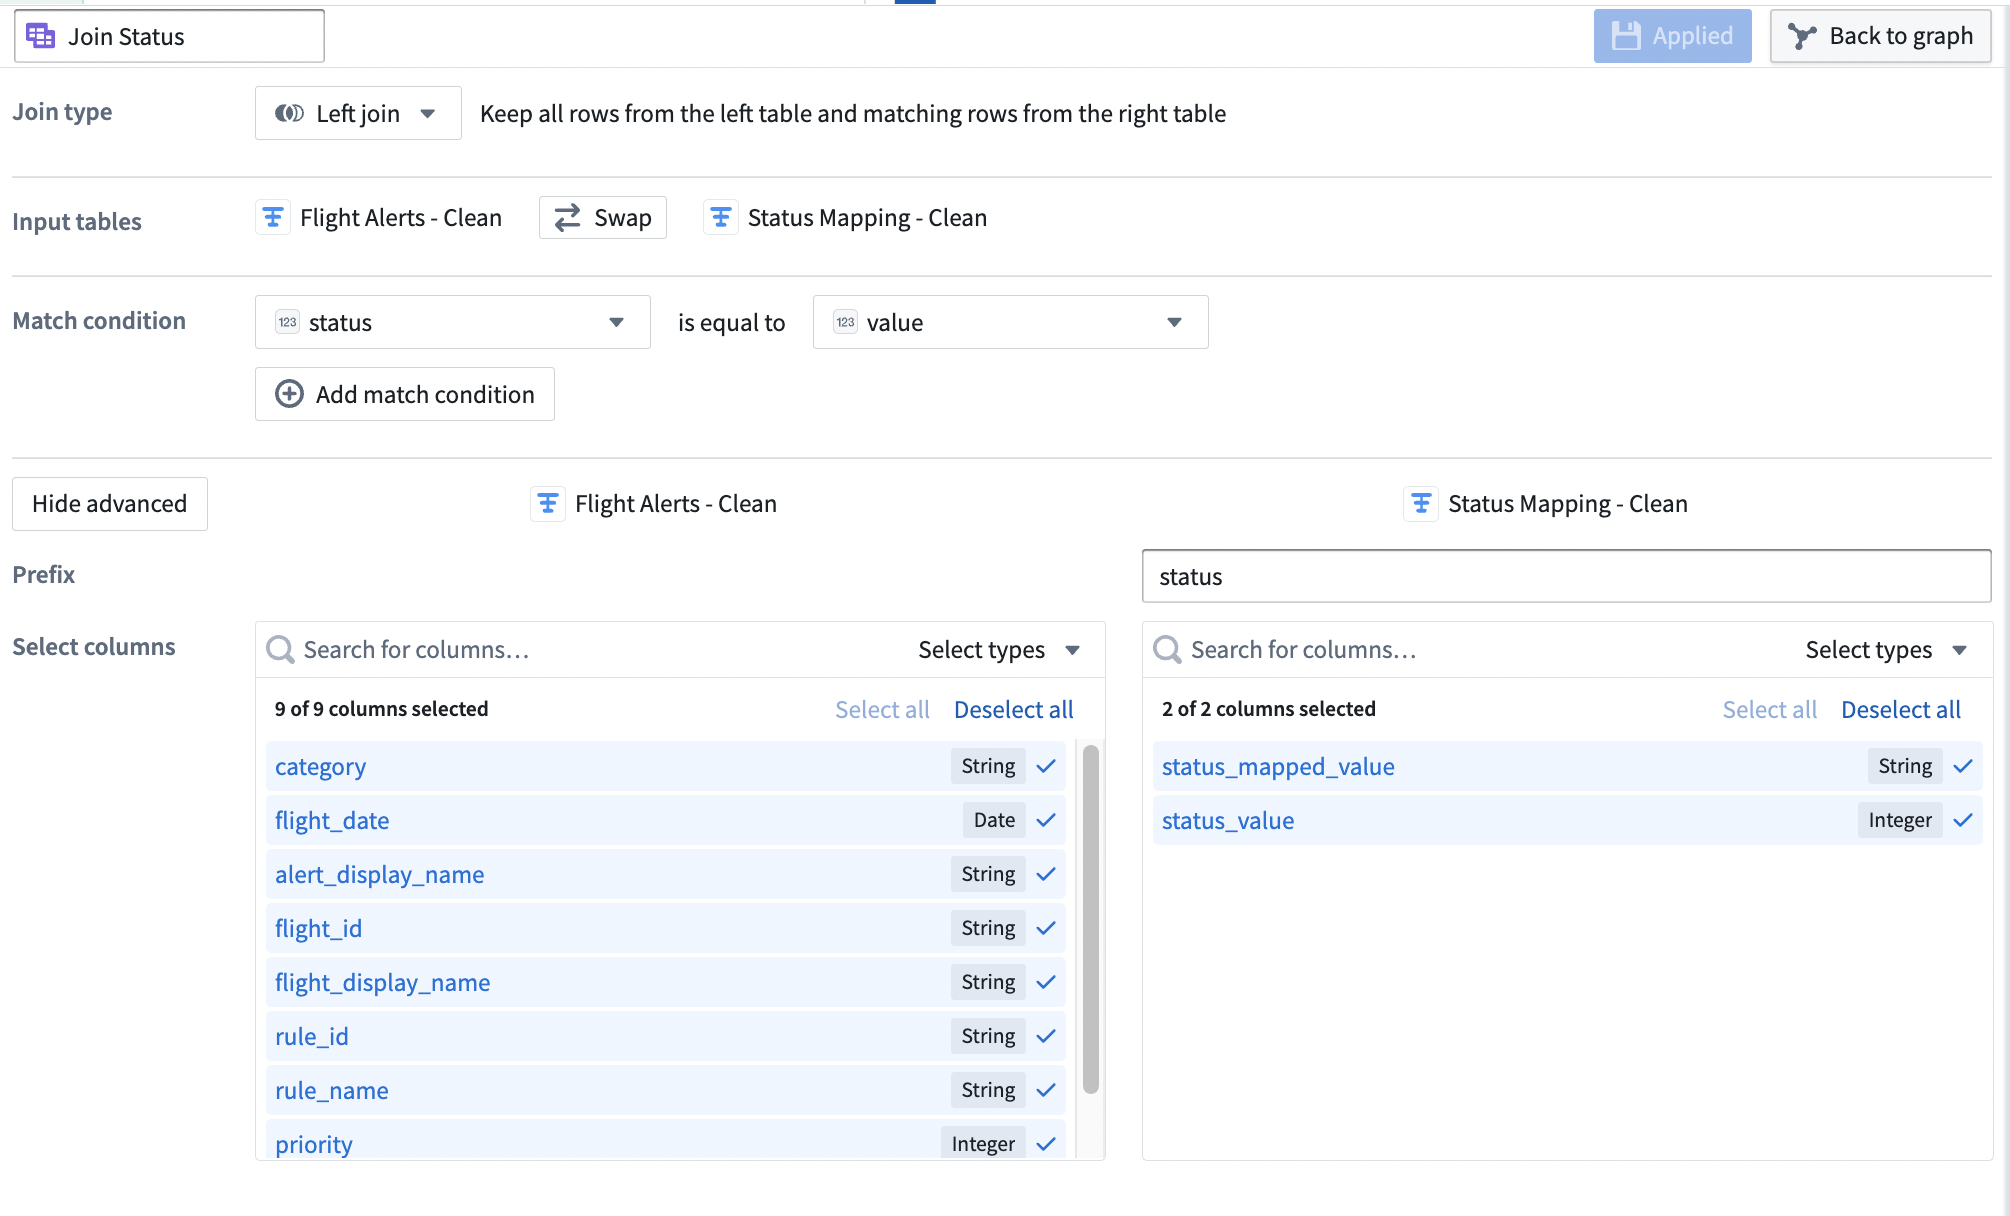
Verify that the Join type is set to
Left join. -
Set the Match condition columns to
statusis equal tovalue. -
Select Show advanced to view additional configuration options.
-
Set the Prefix of the right
Status Mapping - Cleandataset tostatus.
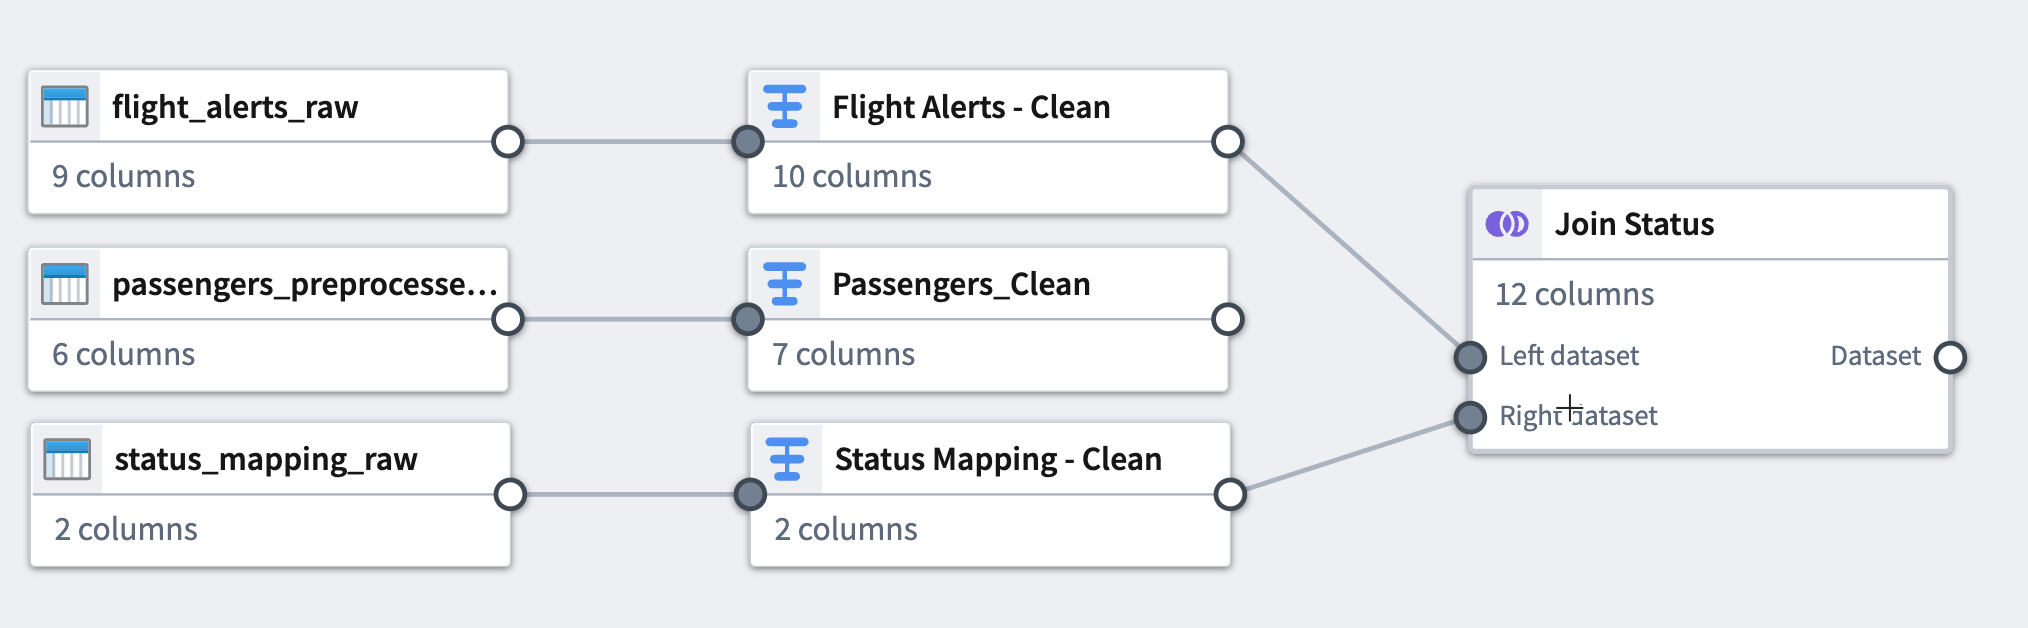
Your join configuration board should look like this:
-
Select Apply to add the join to your pipeline.
-
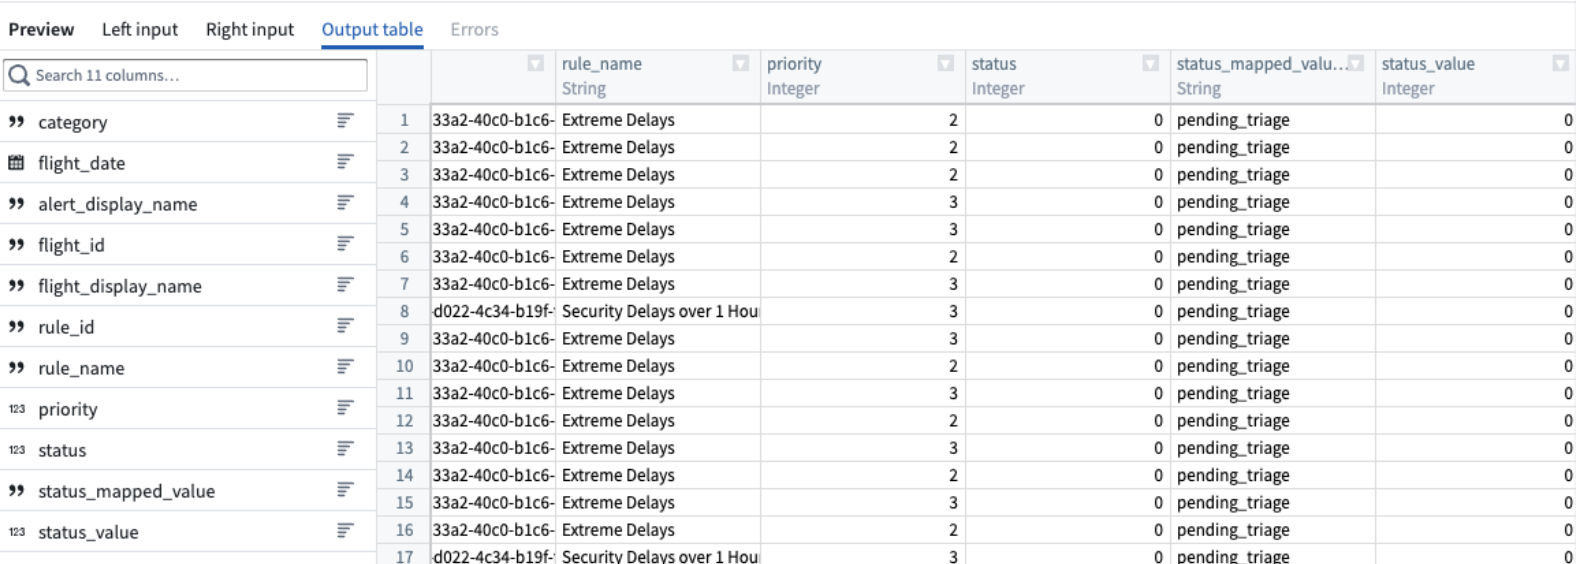
View a preview of the join output table in the Preview pane at the bottom of the configuration window.
-
In the top left corner of the join configuration window, rename the join
Join Status. -
Select Back to graph at the top right to return to your pipeline graph.
-
To make the graph easier to read, select the Layout icon to automatically arrange the datasets, or manually drag the two connected datasets next to each other.
Join 2
For your second join, combine your first join output table with another raw dataset.
-
Add the
priority_mapping_rawdataset to the graph by selecting Add datasets. -
Select the
Join Statusnode you just added to the graph. This will be the left side of the join. -
Select Join.
-
Select the
priority_mapping_rawdataset node to add it as the right side of your join. -
Select Start to open the configuration board.

-
Verify that the Join type is set to
Left join. -
Set the Match condition columns to
priorityis equal tovalue. -
Select Show advanced to view additional configuration options.
-
Set the Prefix of the right
priority_mapping_rawdataset topriority.
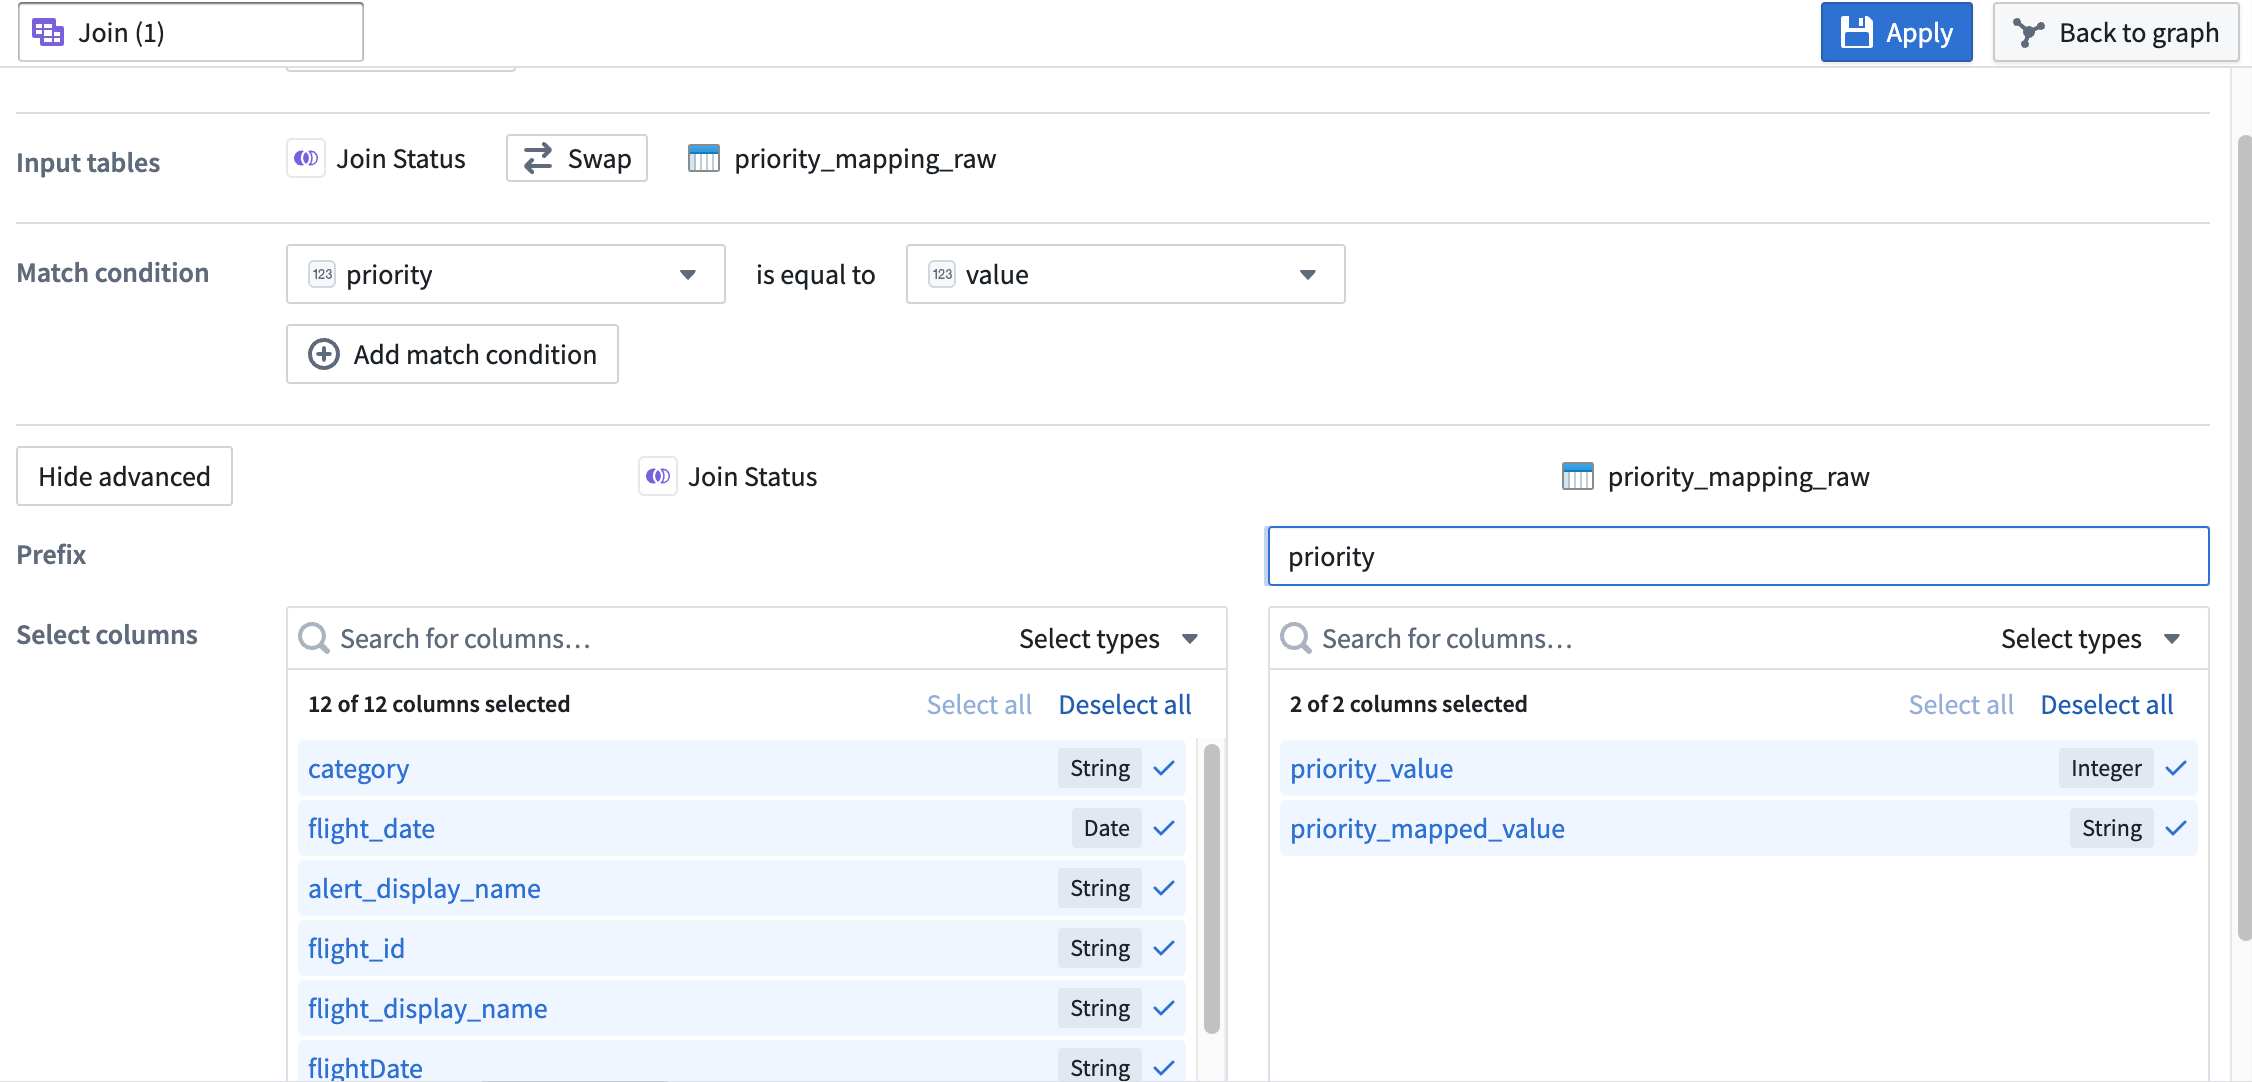
Your join configuration board should look like this:
-
Select Apply to add the join to your pipeline.
-
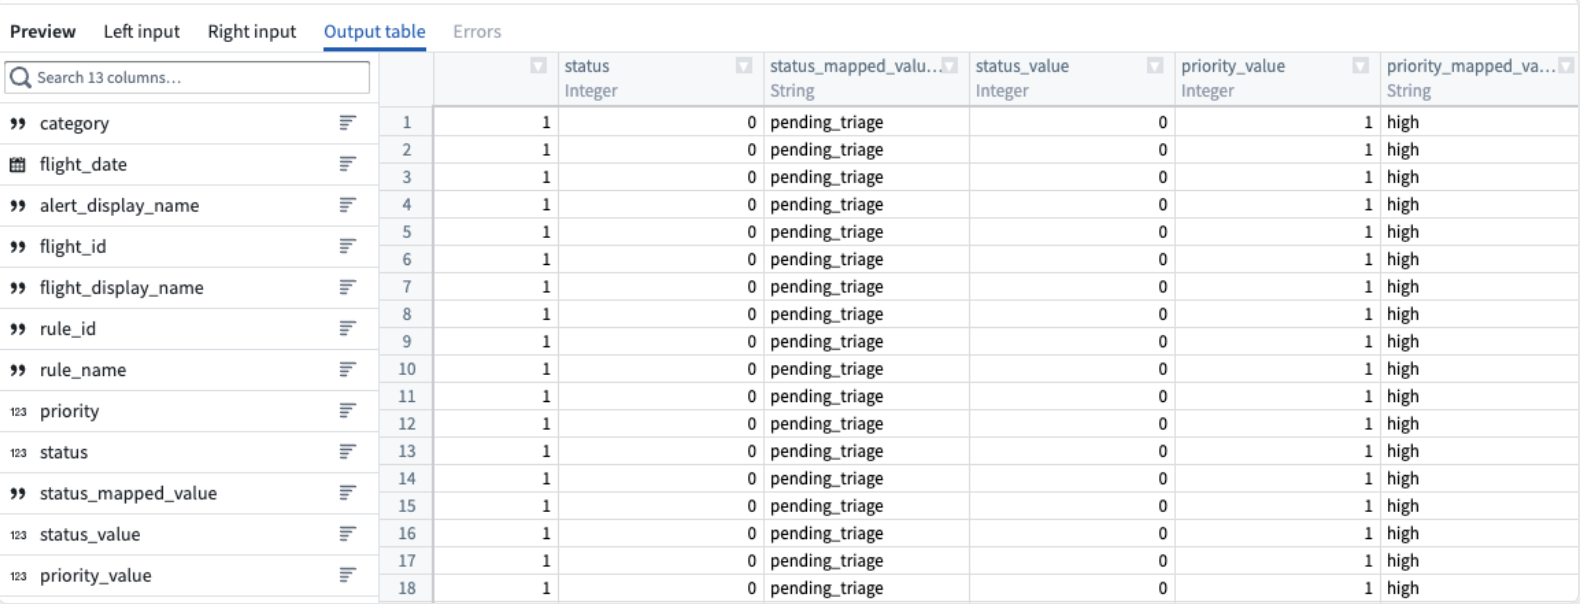
View a preview of the join output table in the Preview pane at the bottom of the configuration window.
-
In the upper left corner of the join configuration window, rename the join
Join (2). -
Select Back to graph at the top right to return to your pipeline graph.
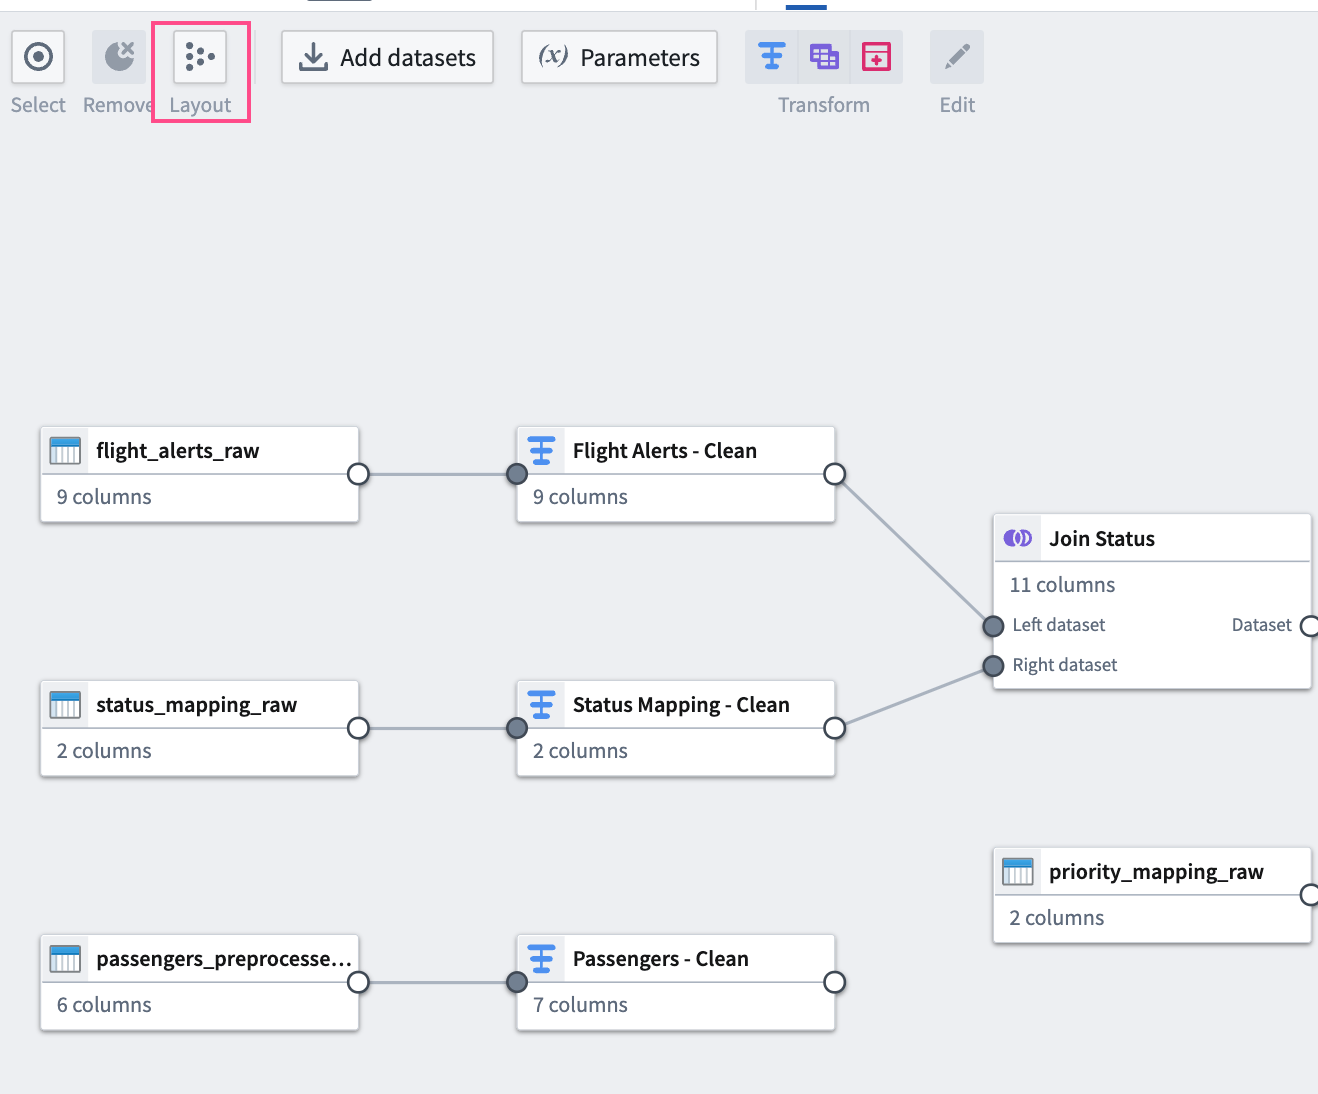
You can now see the connection between the joins you just added and the datasets to which you applied them.
Part 5: Add an output
Now that you have finished transforming and structuring your data, you can add an output. For this tutorial, you will add a dataset output.
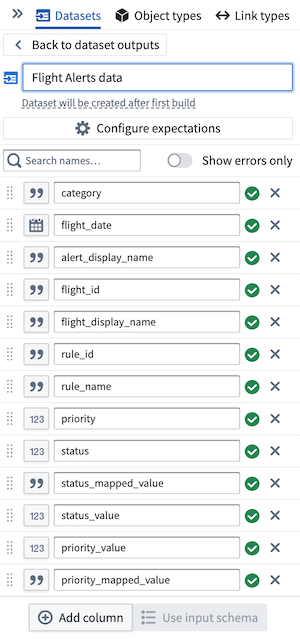
- In the Pipeline outputs sidebar to the right of the Pipeline Builder graph, name the output
Flight Alerts data. Then select Add dataset output. - Link
Join (2)to the output by selecting the white circle to the right of the join node and connecting it to theFlight Alerts datadataset. - Select Use input schema to use existing schema.
- From here, select the columns of data to keep. In this case, keep all the data together.
Part 6: Build the pipeline
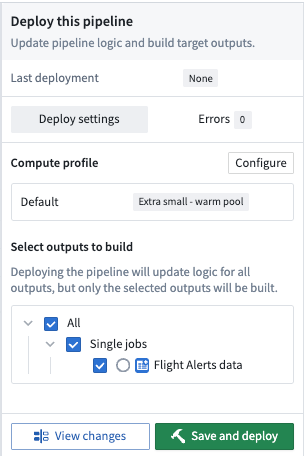
To build your pipeline, select Deploy in the top right of your graph. Then, choose Save and deploy.
You should see a small alert indicating the deploy was successful. Select View in the alert box to open the Build progress page.
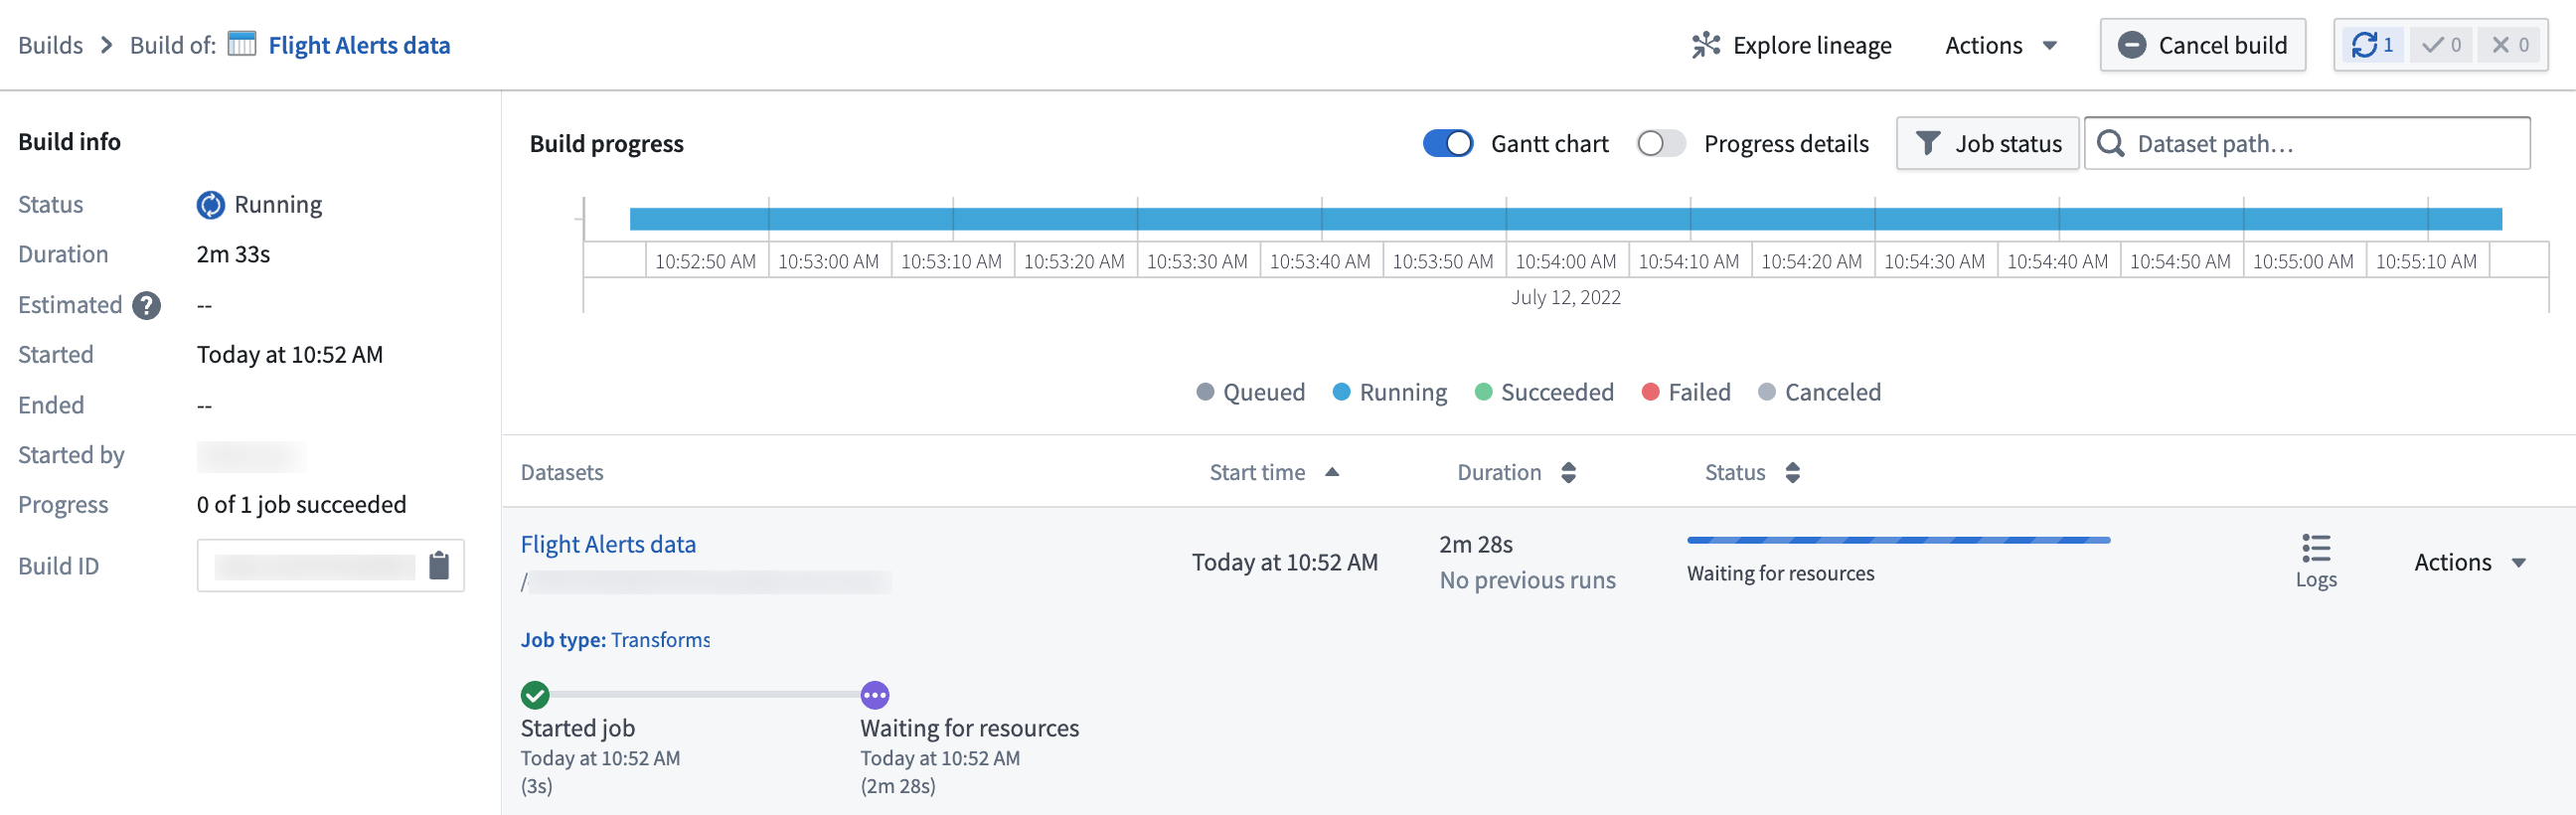
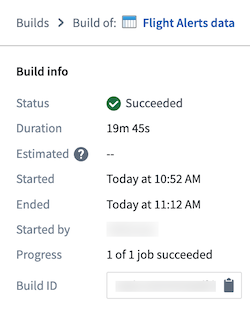
From this page, you can monitor the progress of your build until the dataset output is ready.
You can now access your dataset by selecting Actions > Open.
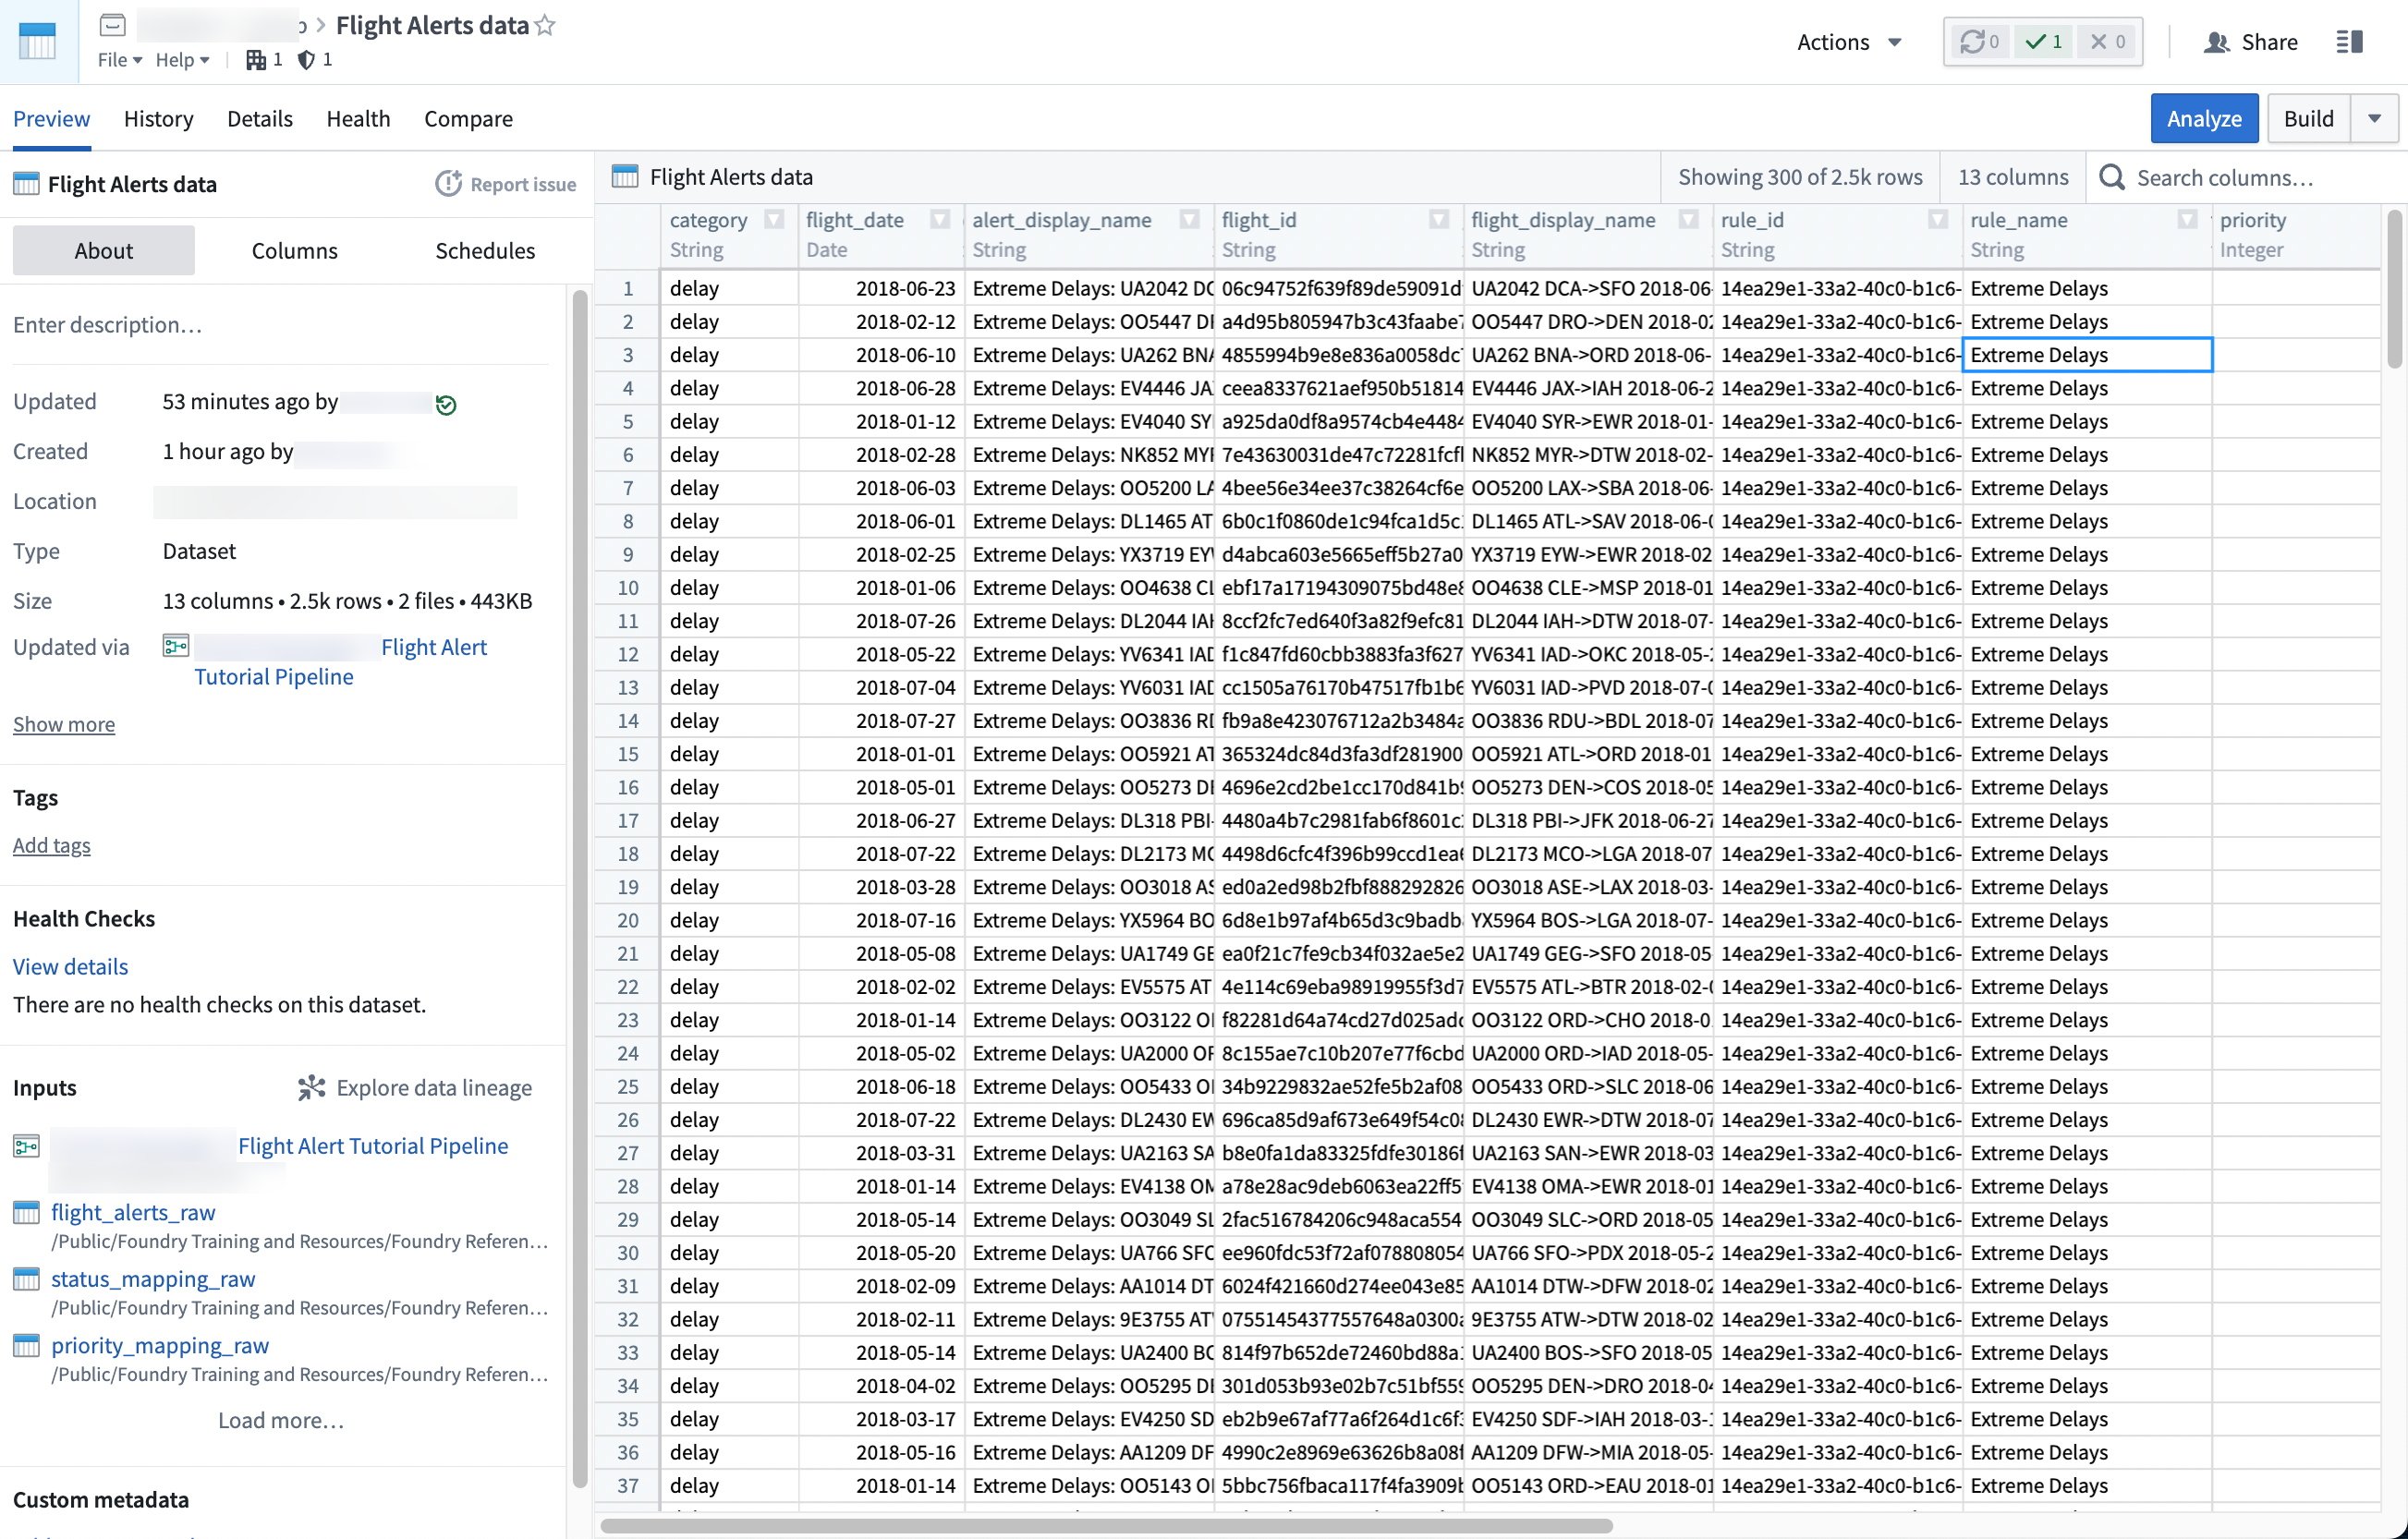
With this last step, you generated your pipeline output. This output is a dataset that can be further explored in other applications in Foundry, such as Contour or Code Workbook.
中文翻译
使用 Pipeline Builder 创建数据集批处理管道
在本教程中,您将使用 Pipeline Builder 创建一个简单的管道,输出包含航班警报信息的单一数据集。之后,您可以使用 Contour 或 Code Workbook 等工具分析该输出数据集,以回答诸如哪些航线面临最大中断风险等问题。
在数据集导入步骤中,您可以通过名称搜索下面使用的数据集;您可以在 Foundry 文件系统中找到它们。
本教程结束时,您将拥有一个如下图所示管道:
该管道将生成一个新的 Flight Alerts Data 数据集输出,供您在平台上进一步探索。
:::callout{theme="success" title="Palantir 学习门户"} 您可以在 learn.palantir.com ↗ 找到关于构建第一个管道的深度课程。 :::
第一部分:初始设置
首先,创建一个新管道。
-
登录 Foundry 后,从左侧导航栏中选择 Applications,搜索并打开 Pipeline Builder
-
接下来,在 Pipeline Builder 的登录页面上,选择 New pipeline 创建新管道,然后选择 Batch pipeline。在 Select batch compute 下,选择 Standard。
:::callout{theme="neutral"} 并非所有 Foundry 环境都支持创建流式管道。如果您的用例需要此功能,请联系 Palantir 支持以获取更多信息。 :::
-
选择保存管道的位置。请注意,管道不能保存在个人文件夹中。
-
选择 Create pipeline。
第二部分:添加数据集
现在,您可以将数据集添加到管道工作流中。使用虚构或开源数据的示例数据集。
在 Pipeline Builder 页面中,选择 Add datasets 从 Foundry 添加数据集。
或者,您也可以从计算机拖放文件作为数据集使用。
在本示例中,您可以添加 passengers_preprocessed、flight_alerts_raw 和 status_mapping_raw 数据集。要添加选定的数据集,请选择该数据集,然后选择内联的 + 图标,或选择 Add to Selection。
选择所有所需数据集后,选择 Add datasets。
第三部分:清洗数据
添加原始数据集后,您可以执行一些基本的清洗转换来继续定义管道。您将转换三个原始数据集。
数据集 1
第一步是清洗 passengers_preprocessed 数据集。首先设置一个类型转换(Cast transform),将 dob 列名改为 dob_date,同时将值转换为 MM/dd/yy 格式。
类型转换(Cast transform)
-
在图表中选择
passengers_preprocessed节点。 -
选择 Transform。
-
从下拉菜单中搜索并选择 cast 转换,打开类型转换配置面板。
-
在 Expression 字段中,选择
dob;对于 Type,选择Date。 -
在 Format 类型中输入
MM/dd/yy。请务必使用大写MM以确保类型转换成功。将输出列名改为dob_date。
您的类型转换面板应如下所示:
- 选择 Apply 将转换添加到管道中。
首字母大写转换(Title case transform)
现在,您可以格式化 flyer_status 列的值,使其以大写字母开头。
-
在转换搜索字段中,搜索并选择 Title case 转换,打开首字母大写配置面板。
-
在 Expression 字段中,从下拉菜单中选择
flyer_status列。
您的首字母大写面板应如下所示:
-
选择 Apply 将转换添加到管道中。
-
在转换配置窗口的左上角,将转换重命名为
Passengers_Clean。
-
选择屏幕右上角的 Back to graph 返回管道图表。
数据集 2
现在,清洗 flight_alerts_raw 数据集。第一步是设置另一个类型转换(Cast transform),将 flight-date 列的值转换为 MM/dd/yy 格式。
类型转换(Cast transform)
-
在图表中选择
flight_alerts_raw数据集节点。 -
选择 Transform。
-
从下拉菜单中搜索并选择 cast 转换,打开类型转换配置面板。您可以阅读选择框右侧列出的函数定义,以了解更多关于该函数的信息。
-
在 Expression 字段中,从下拉菜单中选择
flight_date列。 -
从 Type 字段下拉菜单中选择
Date。 -
在 Format 类型中输入
MM/dd/yy。请务必使用大写MM以确保类型转换成功。
您的类型转换面板应如下所示:
- 选择 Apply 将转换添加到管道中。
清理字符串转换(Clean string transform)
现在,添加一个 Clean string 转换,该转换将删除 category 列值中的空白字符。例如,该转换会将 delay··· 字符串值转换为 delay。
-
从下拉菜单中搜索并选择清理字符串转换,打开清理字符串配置面板。
-
在 Expression 字段中,从下拉菜单中选择
category列。 -
勾选所有三个 Clean actions 选项的复选框:
-
将空字符串转换为 null
- 将多个连续空白字符缩减为单个空白字符
- 修剪字符串开头和结尾的空白字符
您的清理字符串面板应如下所示:
-
选择 Apply 将转换添加到管道中。
-
在转换配置窗口的左上角,将转换重命名为
Flight Alerts - Clean。 -
选择右上角的 Back to graph 返回管道图表。
数据集 3
最后,清洗 status_mapping_raw 数据集。
清理字符串转换(Clean string transform)
您只需对此数据集应用一个 Clean string 转换。
-
在图表中选择
status_mapping_raw数据集节点。 -
选择 Transform。
-
在 Search transforms and columns... 字段中,从下拉菜单中选择
mapped_value列。
-
在同一字段中,从下拉菜单中搜索并选择清理字符串转换。
-
勾选所有三个 Clean actions 选项的复选框:
-
将空字符串转换为 null
- 将多个连续空白字符缩减为单个空白字符
- 修剪字符串开头和结尾的空白字符
您的清理字符串面板应如下所示:
- 选择 Apply 将转换添加到管道中。
- 在转换配置窗口的左上角,将转换重命名为
Status Mapping - Clean。 - 选择右上角的 Back to graph 返回管道图表。
您可以看到刚刚添加的转换与所应用数据集之间的连接。
第四部分:连接数据集
现在,您可以使用连接(Join)将一些清洗后的数据集组合起来。连接允许您将至少有一个匹配列的数据集合并。您将在管道工作流中添加两个连接。
连接 1
您的第一个连接将组合两个清洗后的数据集。
-
选择
Flight Alerts - Clean转换节点。这将是连接的左侧。 -
选择 Join。
-
选择
Status Mapping - Clean节点,将其添加为连接的右侧。 -
选择 Start 打开连接配置面板。
-
确认 Join type 设置为
Left join。 -
将 Match condition 列设置为
status等于value。 -
选择 Show advanced 查看其他配置选项。
-
将右侧
Status Mapping - Clean数据集的 Prefix 设置为status。
您的连接配置面板应如下所示:
-
选择 Apply 将连接添加到管道中。
-
在配置窗口底部的 Preview 窗格中预览连接输出表。
-
在连接配置窗口的左上角,将连接重命名为
Join Status。 -
选择右上角的 Back to graph 返回管道图表。
-
为使图表更易读,选择 Layout 图标自动排列数据集,或手动将两个连接的数据集拖到彼此旁边。
连接 2
对于第二个连接,将第一个连接的输出表与另一个原始数据集组合。
-
选择 Add datasets,将
priority_mapping_raw数据集添加到图表中。 -
选择刚刚添加到图表中的
Join Status节点。这将是连接的左侧。 -
选择 Join。
-
选择
priority_mapping_raw数据集节点,将其添加为连接的右侧。 -
选择 Start 打开配置面板。
-
确认 Join type 设置为
Left join。 -
将 Match condition 列设置为
priority等于value。 -
选择 Show advanced 查看其他配置选项。
-
将右侧
priority_mapping_raw数据集的 Prefix 设置为priority。
您的连接配置面板应如下所示:
-
选择 Apply 将连接添加到管道中。
-
在配置窗口底部的 Preview 窗格中预览连接输出表。
-
在连接配置窗口的左上角,将连接重命名为
Join (2)。 -
选择右上角的 Back to graph 返回管道图表。
您现在可以看到刚刚添加的连接与所应用数据集之间的连接。
第五部分:添加输出
现在您已完成数据的转换和结构化,可以添加输出了。在本教程中,您将添加一个数据集输出。
- 在 Pipeline Builder 图表右侧的 Pipeline outputs 侧边栏中,将输出命名为
Flight Alerts data。然后选择 Add dataset output。 - 通过选择连接节点右侧的白色圆圈并将其连接到
Flight Alerts data数据集,将Join (2)链接到输出。 - 选择 Use input schema 使用现有模式。
- 在此处,选择要保留的数据列。在本例中,将所有数据保留在一起。
第六部分:构建管道
要构建管道,请选择图表右上角的 Deploy。然后,选择 Save and deploy。
您应该会看到一个小提示,表明部署成功。在提示框中选择 View 打开 Build progress 页面。
在此页面中,您可以监控构建进度,直到数据集输出准备就绪。
您现在可以通过选择 Actions > Open 来访问您的数据集。
通过最后一步,您生成了管道输出。该输出是一个数据集,可以在 Foundry 中的其他应用程序中进一步探索,例如 Contour 或 Code Workbook。