Troubleshooting reference(故障排查参考)
This page describes common scheduling issues with steps to debug.
Scheduled build issues
Schedule metrics page
One of the best ways to begin troubleshooting a schedule issue is by looking at the schedule metrics page. The metrics page can tell you the source of your failure. Common failures include:
- The scheduled builds are failing. You will see evidence of failed builds in the Run History tab. Selecting these builds will navigate to the Build Report in the Builds application for full logs.
- The scheduled builds were ignored. The Run History tab will show
Ignoredin the Status column for any builds that were triggered, but not built. - The schedule was not triggered at the expected time or cadence. For this case, the Run History tab may not show a build was triggered when you expected it to have.
Another useful tab is the Versions tab that shows past schedule versions and edits. If your schedule suddenly begins behaving differently than expected, check for any changes to the schedule version that align with this change, and consider reverting your schedule to a previously working state.
Scheduled builds are failing
You can verify if a schedule was triggered at the expected time by checking the Run History tab on the schedule metrics page.
If the schedule was triggered, but the build subsequently failed, you can debug this build in the Builds application similar to any other build.
A schedule will also fail to build if the appropriate permissions are not set. The permissions of a schedule depends on the token mode the schedule is in. Learn more about Project-scoped schedules.
Scheduled builds were ignored
You can verify if a schedule was triggered at the expected time by checking the Run History tab on the schedule metrics page. This information will usually give the reason that the schedule was ignored.
All datasets are up to date
A schedule run will be ignored if all the target datasets are up-to-date (i.e. if their inputs have not updated since the last build on that dataset). If this is the case, you will see this reason in the Run History tab. In the schedule editor, navigate to the schedules list. You will then have the option to color the Data Lineage graph by Out-of-date, which will give you an overview of which job specs are considered stale.
This behavior can be overridden in special circumstances using the Force Build option in advanced settings, though this is computationally wasteful outside these circumstances. If any of the target datasets build by Object Storage V1 (Phonograph) syncs, transforms with API calls, or Data Connection syncs, they may not show up as stale and may require the Force Build option to be enabled for the schedule to run.
Schedule builds a subset of job specs
If the schedule only triggers a subset of job specs, you will see evidence of this in the Run History tab on the schedule metrics page.
One cause of this behavior is that only a subset of the job specs were stale. The schedule will only build the stale job specs, and those that are up-to-date will be ignored during the build. See all datasets are up-to-date for more troubleshooting details. The case where the build is Ignored happens if all of these job specs are up to date.
Another cause could be that the job spec was not included in the job spec graph of the build. When a given schedule is selected in the schedule editor, the job specs to be built are highlighted in the Data Lineage graph. The job spec selection depends on the build type. If using a Connecting build, be sure to verify if a connecting job spec is present for schedules using the same datasets on multiple branches.
Schedule was not triggered
You can verify if a schedule was triggered at the expected time by checking the Run History tab on the schedule metrics page. Some common debugging steps are:
- Check that the schedule is not paused. Paused schedules will not trigger until they are unpaused.
- Check the schedule trigger configuration. If the schedule was previously triggered successfully, check the schedule history to see if there was a recent change to the trigger.
- If the schedule is using an
Eventtrigger, verify that the expected event actually happened. - For example, if the build should be triggered when the input updates, check that the last build on the input ran successfully and transactions on this build were successfully committed in the Dataset Preview history view.
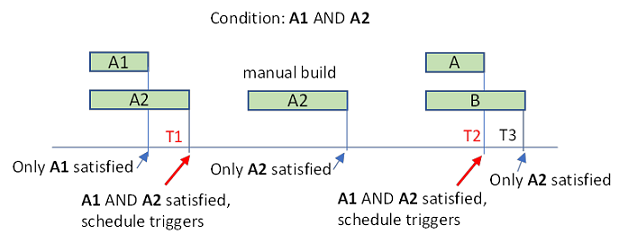
- If the build should be triggered after multiple inputs update, check builds and timing on all inputs. For example, consider a schedule with input triggers A1 and A2, and "Wait until all these datasets update" is turned on. Say this schedule was previously ran at time T1. For this schedule to run again at time T2, A1 and A2 would need to both be updated in the time period between (T1, T2).
Schedule retries differ from configured
Not all types of failure are able to be retried. The number of retries when the schedule runs will be capped to a maximum configured by your administrator. Learn more about advanced schedule settings.
The retriable error codes are:
INTERNALTIMEOUTCUSTOM_SERVERFAILED_PRECONDITION
Schedule is failing with JobSpecInputsTrashed or JobSpecOutputsTrashed, or Data Lineage warns that some datasets are trashed
This error means that the schedule contains or reads from a trashed resource. You can do one of the following to resolve:
- Restore the deleted dataset from trash.
- Exclude the deleted dataset from the schedule. If this dataset is used as an input to another downstream dataset in the schedule, you will also need to do one of the following:
- Exclude the downstream dataset along with the trashed one.
- Modify the logic of the downstream dataset so that it no longer takes the trashed dataset as input.
Schedule editor issues
Schedule permissions
To edit a schedule in Project-scoped mode, you must have Editor permissions on the target datasets, Viewer permissions on the trigger datasets, and Editor permissions on the Project to which the schedule is scoped. If you lost permissions for one dataset, remove this dataset from the schedule before you save your changes.
To edit, delete, or pause a schedule, you need to have Editor permissions on the target dataset and Editor permissions on the Project to which the schedule is scoped. To view a schedule, you need to have Viewer permissions on the target dataset.
Schedule compute information is unavailable
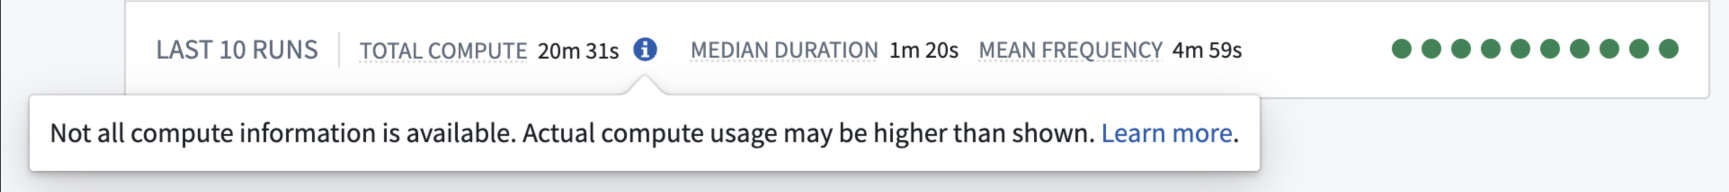
A message stating "Not all compute information is available. Actual compute usage may be higher than shown." may appear when viewing a schedule for either of the following reasons:
- One or more scheduled builds are still in progress, and the total compute usage is not yet finalized.
- Information is missing about the resources used by at least one scheduled build.
When this message is displayed, no user action is required. The purpose of this message is to show that the total compute usage shown may be inaccurate at a given time.
中文翻译
故障排查参考
本页面介绍常见的调度(Schedule)问题及对应的调试步骤。
调度构建问题
调度指标页面(Schedule metrics page)
排查调度问题的最佳入手点之一是查看调度指标页面,该页面可以告知故障来源,常见故障包括:
* 调度构建失败:你可以在运行历史(Run History)标签页中看到构建失败的记录,选中这些失败构建会跳转至构建应用(Builds application)中的构建报告页面,可查看完整日志。
* 调度构建被忽略:对于已触发但未执行的构建,运行历史标签页的状态列会显示Ignored。
* 调度未按预期触发:即未在预期的时间或周期触发,这种情况下,运行历史标签页不会显示你预期应该触发的构建记录。
另一个实用的标签页是版本(Versions)标签页,展示了历史的调度版本和编辑记录。如果你的调度突然出现不符合预期的行为,可以检查调度版本是否有和该变化时间吻合的变更,也可以考虑将调度回滚到之前正常运行的版本。
调度构建失败(Scheduled builds are failing)
你可以通过查看调度指标页面的运行历史标签页,确认调度是否在预期时间被触发。
如果调度已触发,但后续构建失败,你可以像调试其他构建一样,在构建应用中调试该构建。
如果未配置合适的权限,调度也会构建失败。调度的权限取决于其使用的令牌模式,你可以了解更多关于项目范围调度(Project-scoped schedules)的信息。
调度构建被忽略(Scheduled builds were ignored)
你可以通过查看调度指标页面的运行历史标签页,确认调度是否在预期时间被触发,页面信息通常会给出调度被忽略的原因。
所有数据集均为最新状态(All datasets are up to date)
如果所有目标数据集都是最新的(即自该数据集上次构建以来,其输入没有更新),调度运行会被忽略。如果是这种情况,你会在运行历史标签页看到对应的原因。在调度编辑器(Schedule editor)中,导航至调度列表,你可以选择按Out-of-date为数据血缘(Data Lineage)图配色,从而直观查看哪些作业规范(Job spec)被判定为过时。
特殊情况下,你可以通过高级设置(Advanced settings)中的强制构建(Force Build)选项覆盖该行为,但非特殊场景下这么做会浪费计算资源。如果目标数据集的构建依赖Object Storage V1 (Phonograph)同步、含API调用的转换作业或数据连接(Data Connection)同步,这些数据集可能不会被标记为过时,需要开启强制构建选项才能让调度运行。
调度仅构建部分作业规范(Schedule builds a subset of job specs)
如果调度仅触发了部分作业规范,你可以在调度指标页面的运行历史标签页看到对应的记录。
导致该行为的原因之一是只有部分作业规范过时,调度仅会构建过时的作业规范,最新的作业规范会在构建过程中被忽略。更多排查细节请参考所有数据集均为最新状态。如果所有作业规范都为最新状态,构建就会被标记为Ignored。
另一个可能的原因是该作业规范未被纳入构建的作业规范图中。在调度编辑器中选中某一调度时,待构建的作业规范会在数据血缘图中高亮显示。作业规范的选择取决于构建类型(Build type)。如果使用的是连接构建(Connecting build),请确认跨多个分支使用相同数据集的调度是否存在对应的连接作业规范。
调度未触发(Schedule was not triggered)
你可以通过查看调度指标页面的运行历史标签页,确认调度是否在预期时间被触发。常见的调试步骤包括:
* 检查调度是否处于暂停状态。暂停的调度在取消暂停前不会触发。
* 检查调度触发器配置(Schedule trigger configuration)。如果该调度之前可以成功触发,请查看调度历史确认近期是否有触发器的变更。
* 如果调度使用的是Event触发器,请确认预期的事件确实已发生。
* 例如,如果构建应该在输入更新时触发,请检查输入的上次构建是否成功运行,且该构建的事务已在数据集预览历史视图(Dataset Preview history view)中成功提交。
* 如果构建应该在多个输入更新后触发,请检查所有输入的构建情况和时间。例如,某个调度配置了输入触发器A1和A2,且开启了「等待所有这些数据集更新」选项,假设该调度上次运行时间为T1,要让该调度在T2时间再次运行,A1和A2都需要在(T1, T2)的时间段内完成更新。
调度重试次数与配置不符(Schedule retries differ from configured)
并非所有故障类型都支持重试,调度运行时的重试次数上限由平台管理员配置。你可以了解更多关于高级调度设置的信息。
可重试的错误码包括:
* INTERNAL
* TIMEOUT
* CUSTOM_SERVER
* FAILED_PRECONDITION
调度因JobSpecInputsTrashed或JobSpecOutputsTrashed报错失败,或数据血缘提示部分数据集已被删除
该错误表示调度包含或读取了已被移入回收站的资源,你可以通过以下方式解决: * 从回收站恢复已删除的数据集。 * 将已删除的数据集从调度中移除。如果该数据集是调度中其他下游数据集的输入,你还需要执行以下任一操作: * 将下游数据集和已删除的数据集一同排除。 * 修改下游数据集的逻辑,使其不再以已删除的数据集作为输入。
调度编辑器问题(Schedule editor issues)
调度权限(Schedule permissions)
要编辑处于项目范围模式的调度,你需要拥有目标数据集的Editor权限、触发器数据集的Viewer权限,以及调度所属项目的Editor权限。如果你失去了某个数据集的权限,请在保存修改前将该数据集从调度中移除。
要编辑、删除或暂停调度,你需要拥有目标数据集的Editor权限,以及调度所属项目的Editor权限。要查看调度,你需要拥有目标数据集的Viewer权限。
调度计算信息不可用(Schedule compute information is unavailable)
查看调度时可能会出现“无法获取全部计算信息,实际计算用量可能高于展示值”的提示,原因可能是以下两种之一: * 一个或多个调度构建仍在运行中,总计算用量尚未最终确定。 * 至少有一个调度构建的资源使用信息缺失。