Configure data health checks(配置数据健康检查(Data Health Checks))
You can configure a dataset health check in Pipeline Builder by accessing the data preview panel within the graph, or by opening the Dataset Preview app.
- Open the preview panel by double-clicking a dataset node in the graph.
- Open the Dataset Preview app by right-clicking on a dataset node and selecting Open.
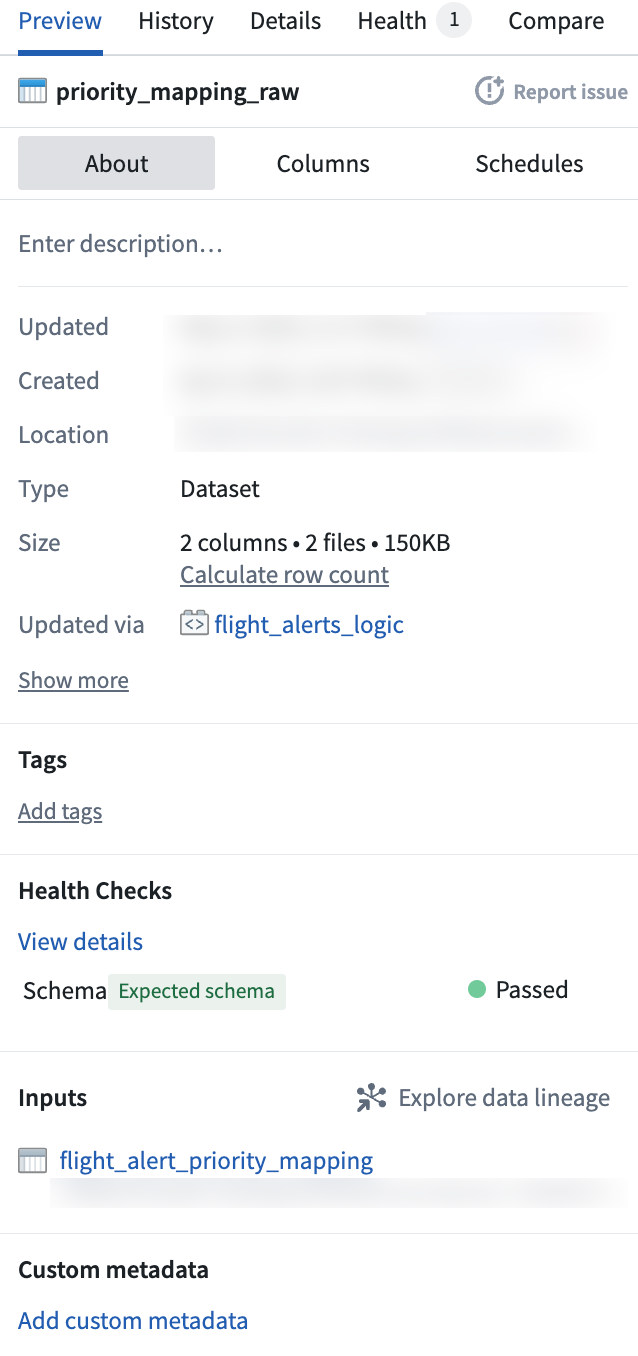
In the About tab of the preview, you will find the Health Checks section. This section shows any active health checks configured for the dataset. Choose View details to learn more about active health checks or to configure a new check. This will open the Health tab in the Dataset Preview app.
To add a new health check, first search for an available check. Use the search bar to find a check by name, or use the various tabs to search for checks based on status, time, size, content, or schema. For a list of available checks, descriptions, and example options, view Checks reference.
Health check types include:
- Job-level status checks: Validate that the job corresponding to an output dataset is completing successfully.
- Build-level checks: Validate that builds are completing successfully within an expected duration.
- Freshness checks: Validate that data is being kept up-to-date.
If you want to add a Build status check, for instance, search for Build status in the search bar or within the Status tab. Select the check to open a configuration side panel. Use this panel to configure the health check rule, group, notes, and issue prompt.
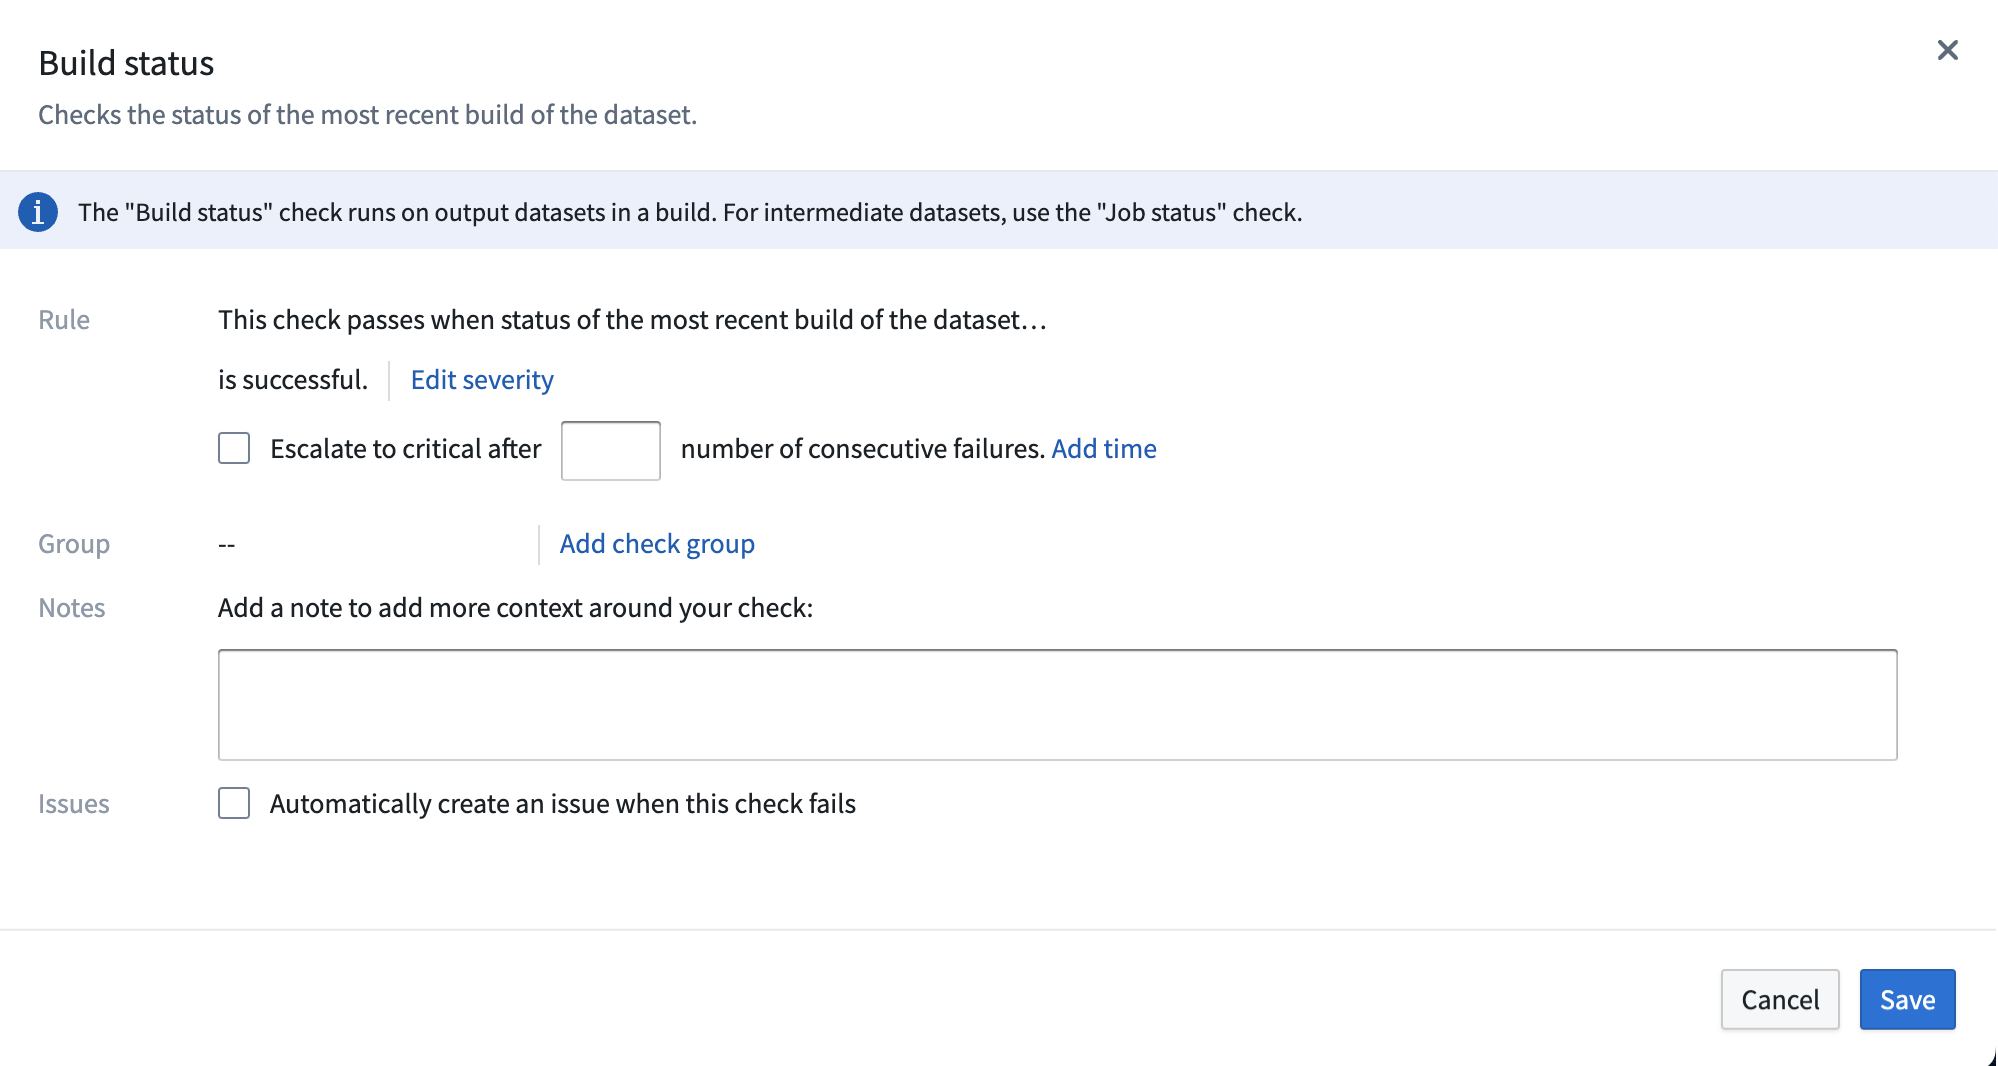
- Rule: Describes the rule of the check you are configuring.
-
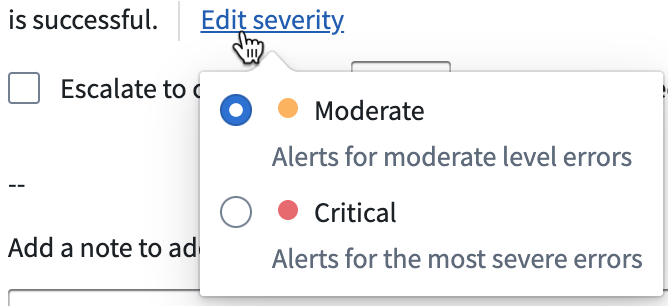
Choose Edit severity to mark the check as Moderate or Severe.
-
Decide whether to escalate the check to critical after a set number of consecutive failures. Select Add time to set a time parameter of consecutive failures.
-
Group: Shows the monitoring view to which this health check will belong. Select Add group to search for available monitoring views.
-
Learn more about monitoring views.
-
Notes: Add context to your new health check by including a note with your configuration.
-
Issues: Check the box to prompt an issue creation when the check fails.
Select Save in the bottom right of the configuration panel to save your new health check to the dataset.
Learn more about recommended health checks and Data Health.
中文翻译
配置数据健康检查(Data Health Checks)
您可以通过访问管道构建器(Pipeline Builder)图形中的数据预览面板,或打开数据集预览(Dataset Preview)应用来配置数据集健康检查。
- 双击图形中的数据集节点即可打开预览面板。
- 右键单击数据集节点并选择打开,即可打开数据集预览应用。
在预览的关于(About)选项卡中,您会找到健康检查(Health Checks)部分。该部分显示为该数据集配置的所有活跃健康检查。选择查看详情可了解更多关于活跃健康检查的信息,或配置新的检查。这将打开数据集预览应用中的健康(Health)选项卡。
要添加新的健康检查,首先搜索可用的检查项。使用搜索栏按名称查找检查,或使用不同选项卡根据状态、时间、大小、内容或模式(Schema)进行搜索。有关可用检查项、描述及示例选项的列表,请查看检查参考文档。
健康检查类型包括:
- 作业级状态检查(Job-level status checks): 验证输出数据集对应的作业是否成功完成。
- 构建级检查(Build-level checks): 验证构建是否在预期时间内成功完成。
- 时效性检查(Freshness checks): 验证数据是否保持最新。
例如,如果您想添加构建状态(Build status)检查,请在搜索栏或状态(Status)选项卡中搜索构建状态。选择该检查项以打开配置侧面板。使用此面板配置健康检查规则、分组、备注和问题提示。
- 规则(Rule): 描述您正在配置的检查规则。
-
选择编辑严重性(Edit severity)可将检查标记为中等(Moderate)或严重(Severe)。
-
决定是否在连续失败达到设定次数后将检查升级为严重。选择添加时间(Add time)可设置连续失败的时间参数。
-
分组(Group): 显示此健康检查所属的监控视图(Monitoring View)。选择添加分组(Add group)可搜索可用的监控视图。
-
了解更多关于监控视图的信息。
-
备注(Notes): 通过添加备注为新的健康检查提供上下文信息。
-
问题(Issues): 勾选复选框可在检查失败时提示创建问题。
选择配置面板右下角的保存(Save),将新的健康检查保存到数据集中。
了解更多关于推荐的健康检查和数据健康(Data Health)的信息。