Color groups(颜色分组)
You can use node color groups in Pipeline Builder to better organize and manage your pipelines. Color groups can help identify nodes and improve the readability of your graph. Color groups can also be collapsed or hidden to simplify the graph view and clean up your pipeline visualizations.
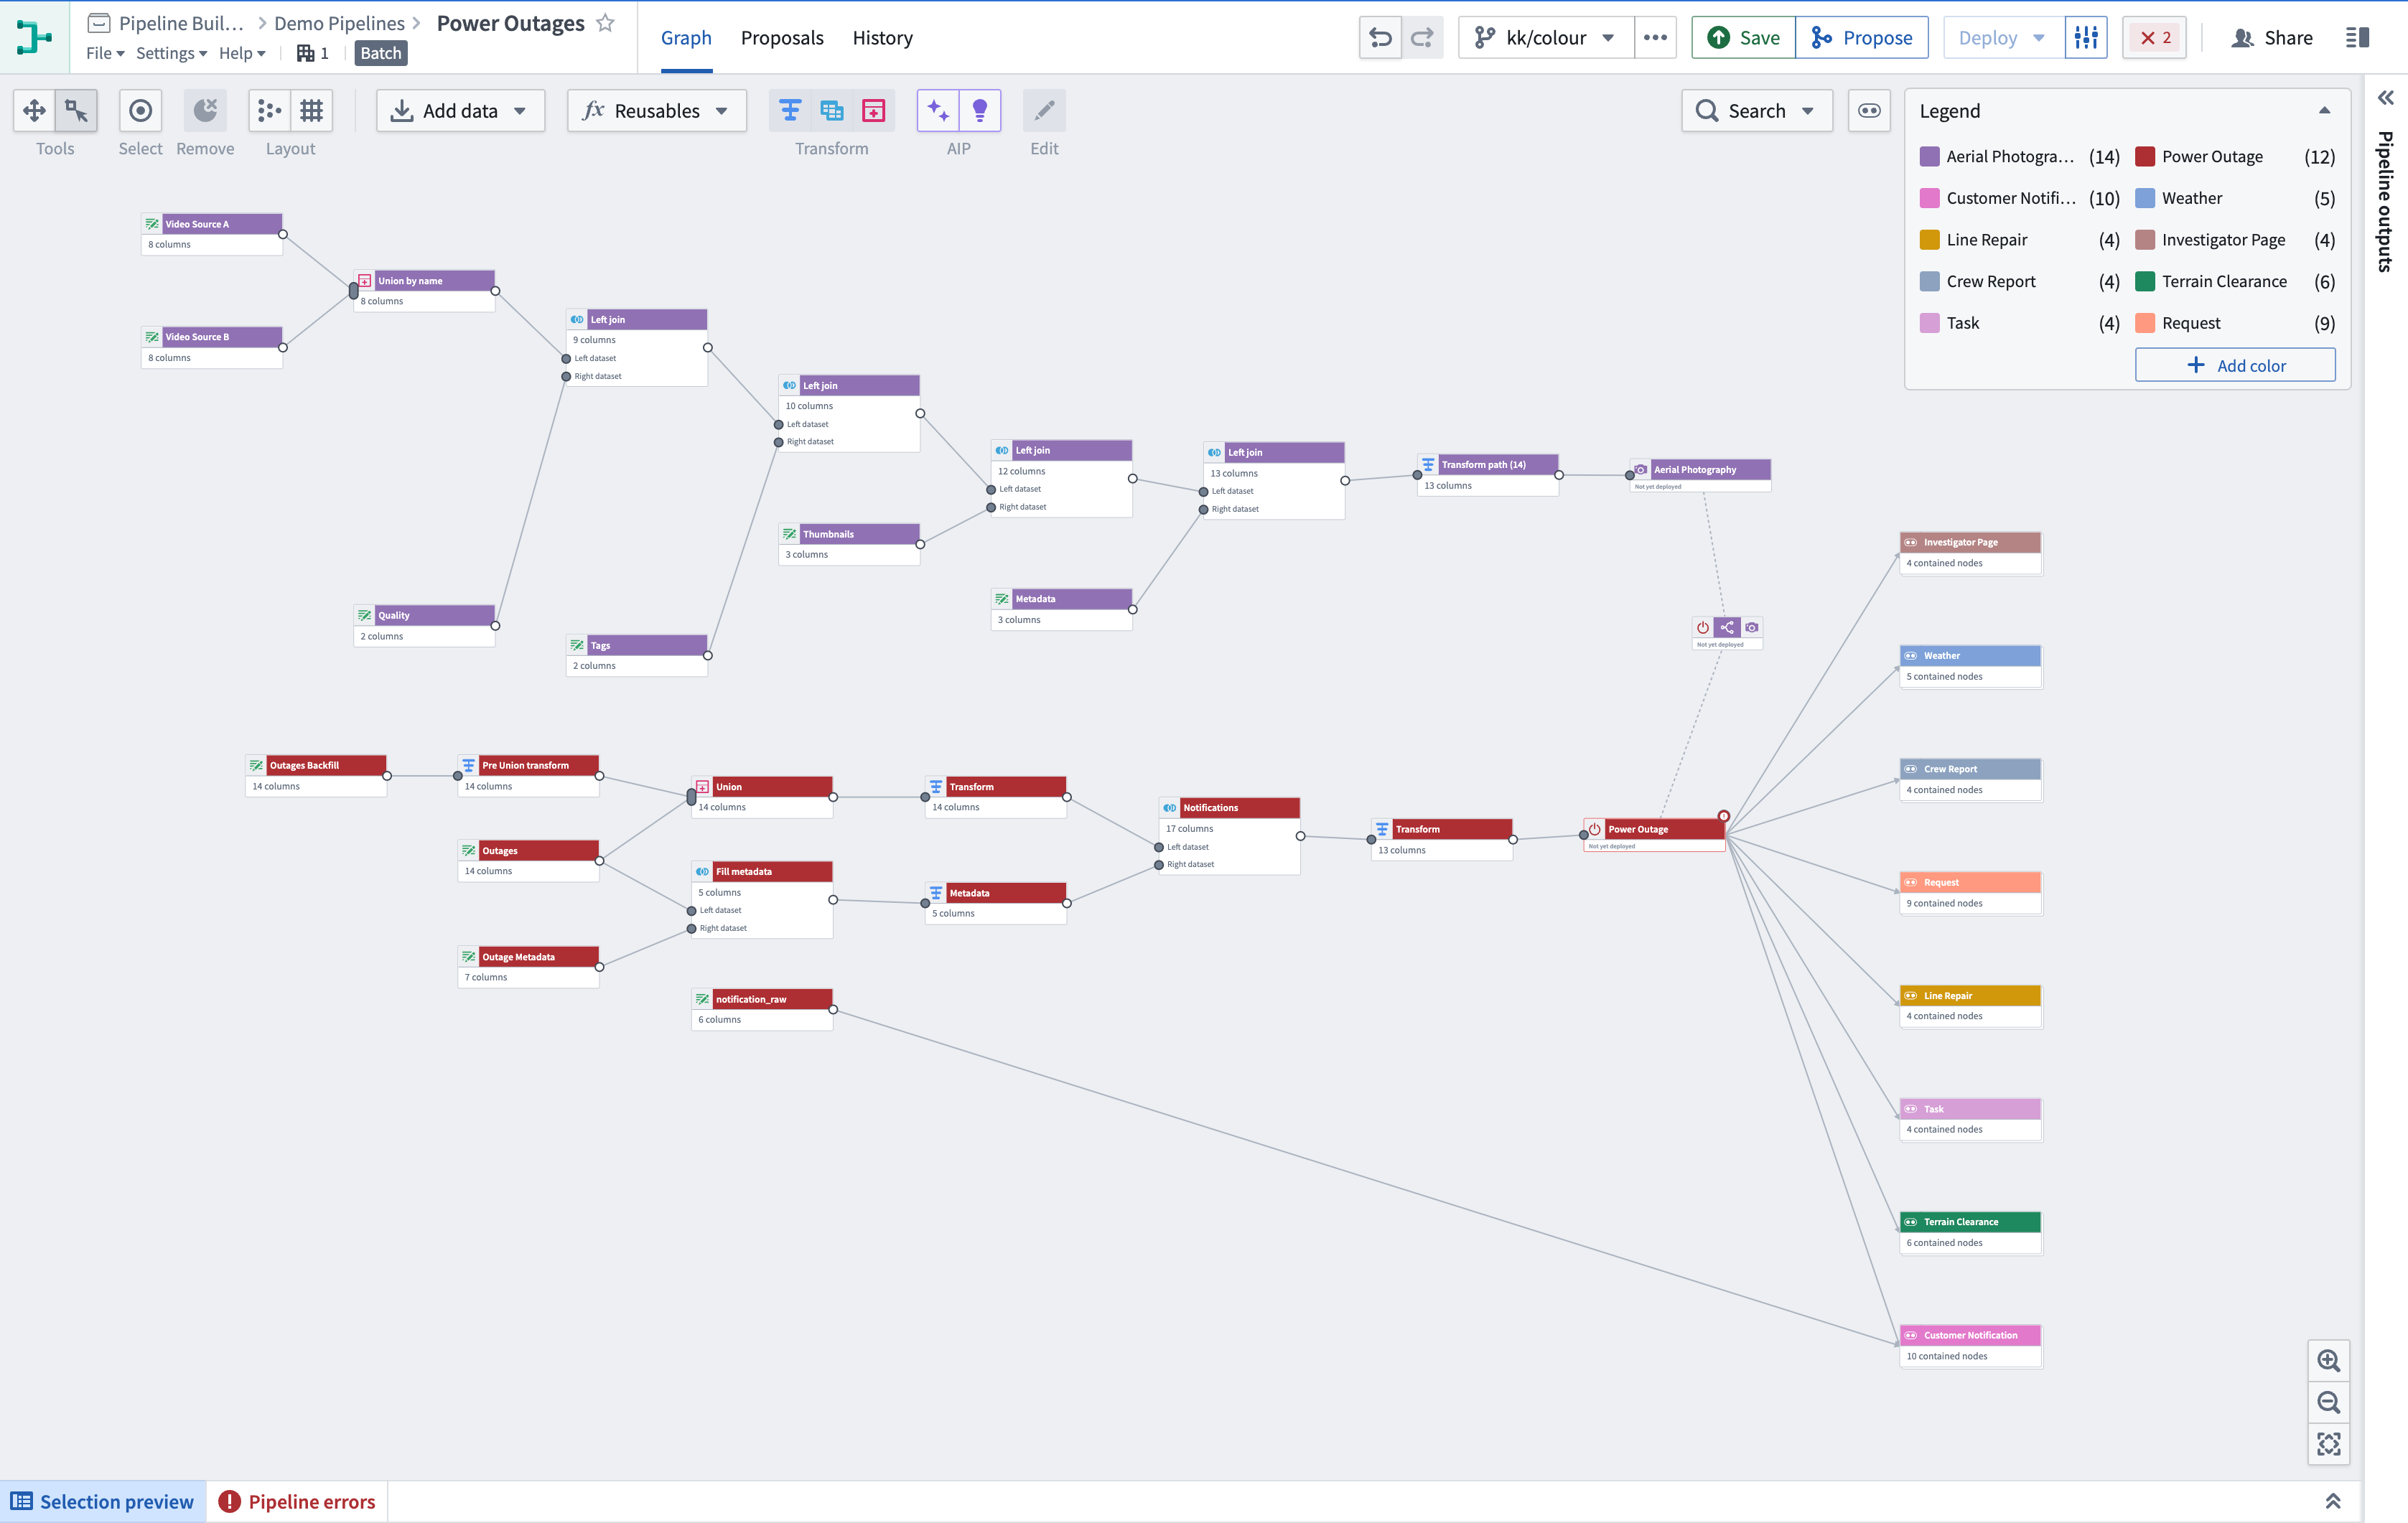
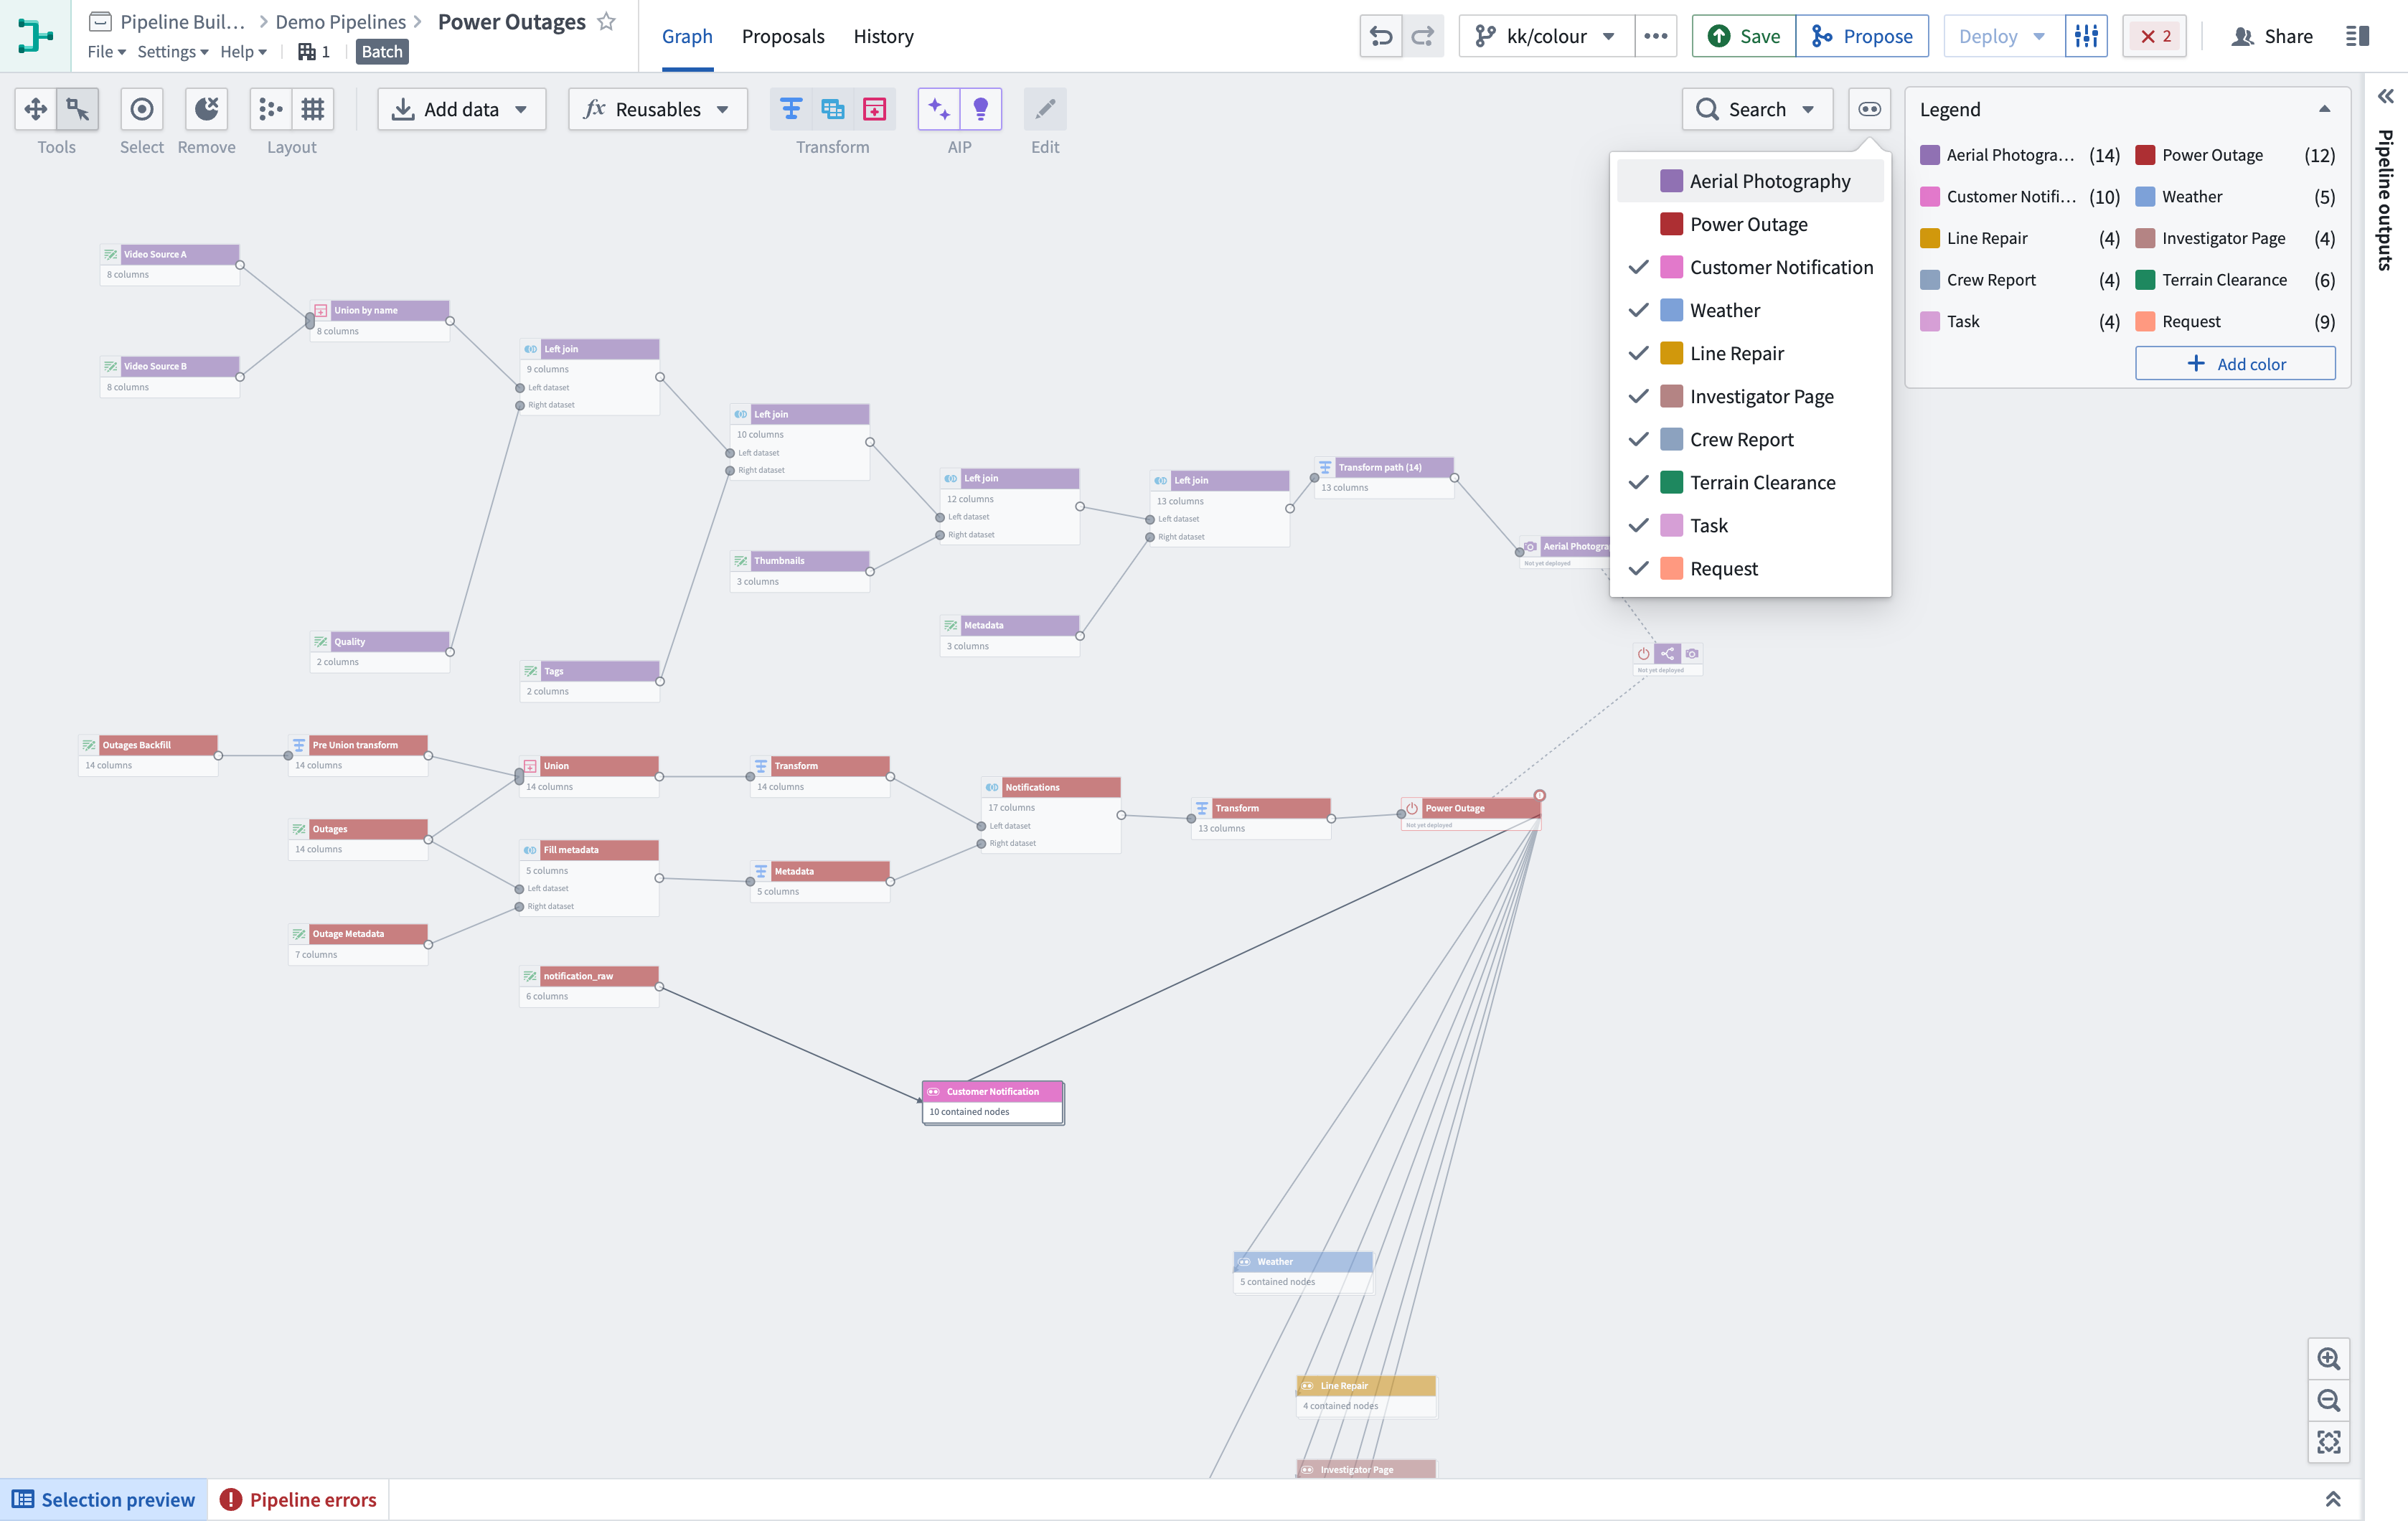
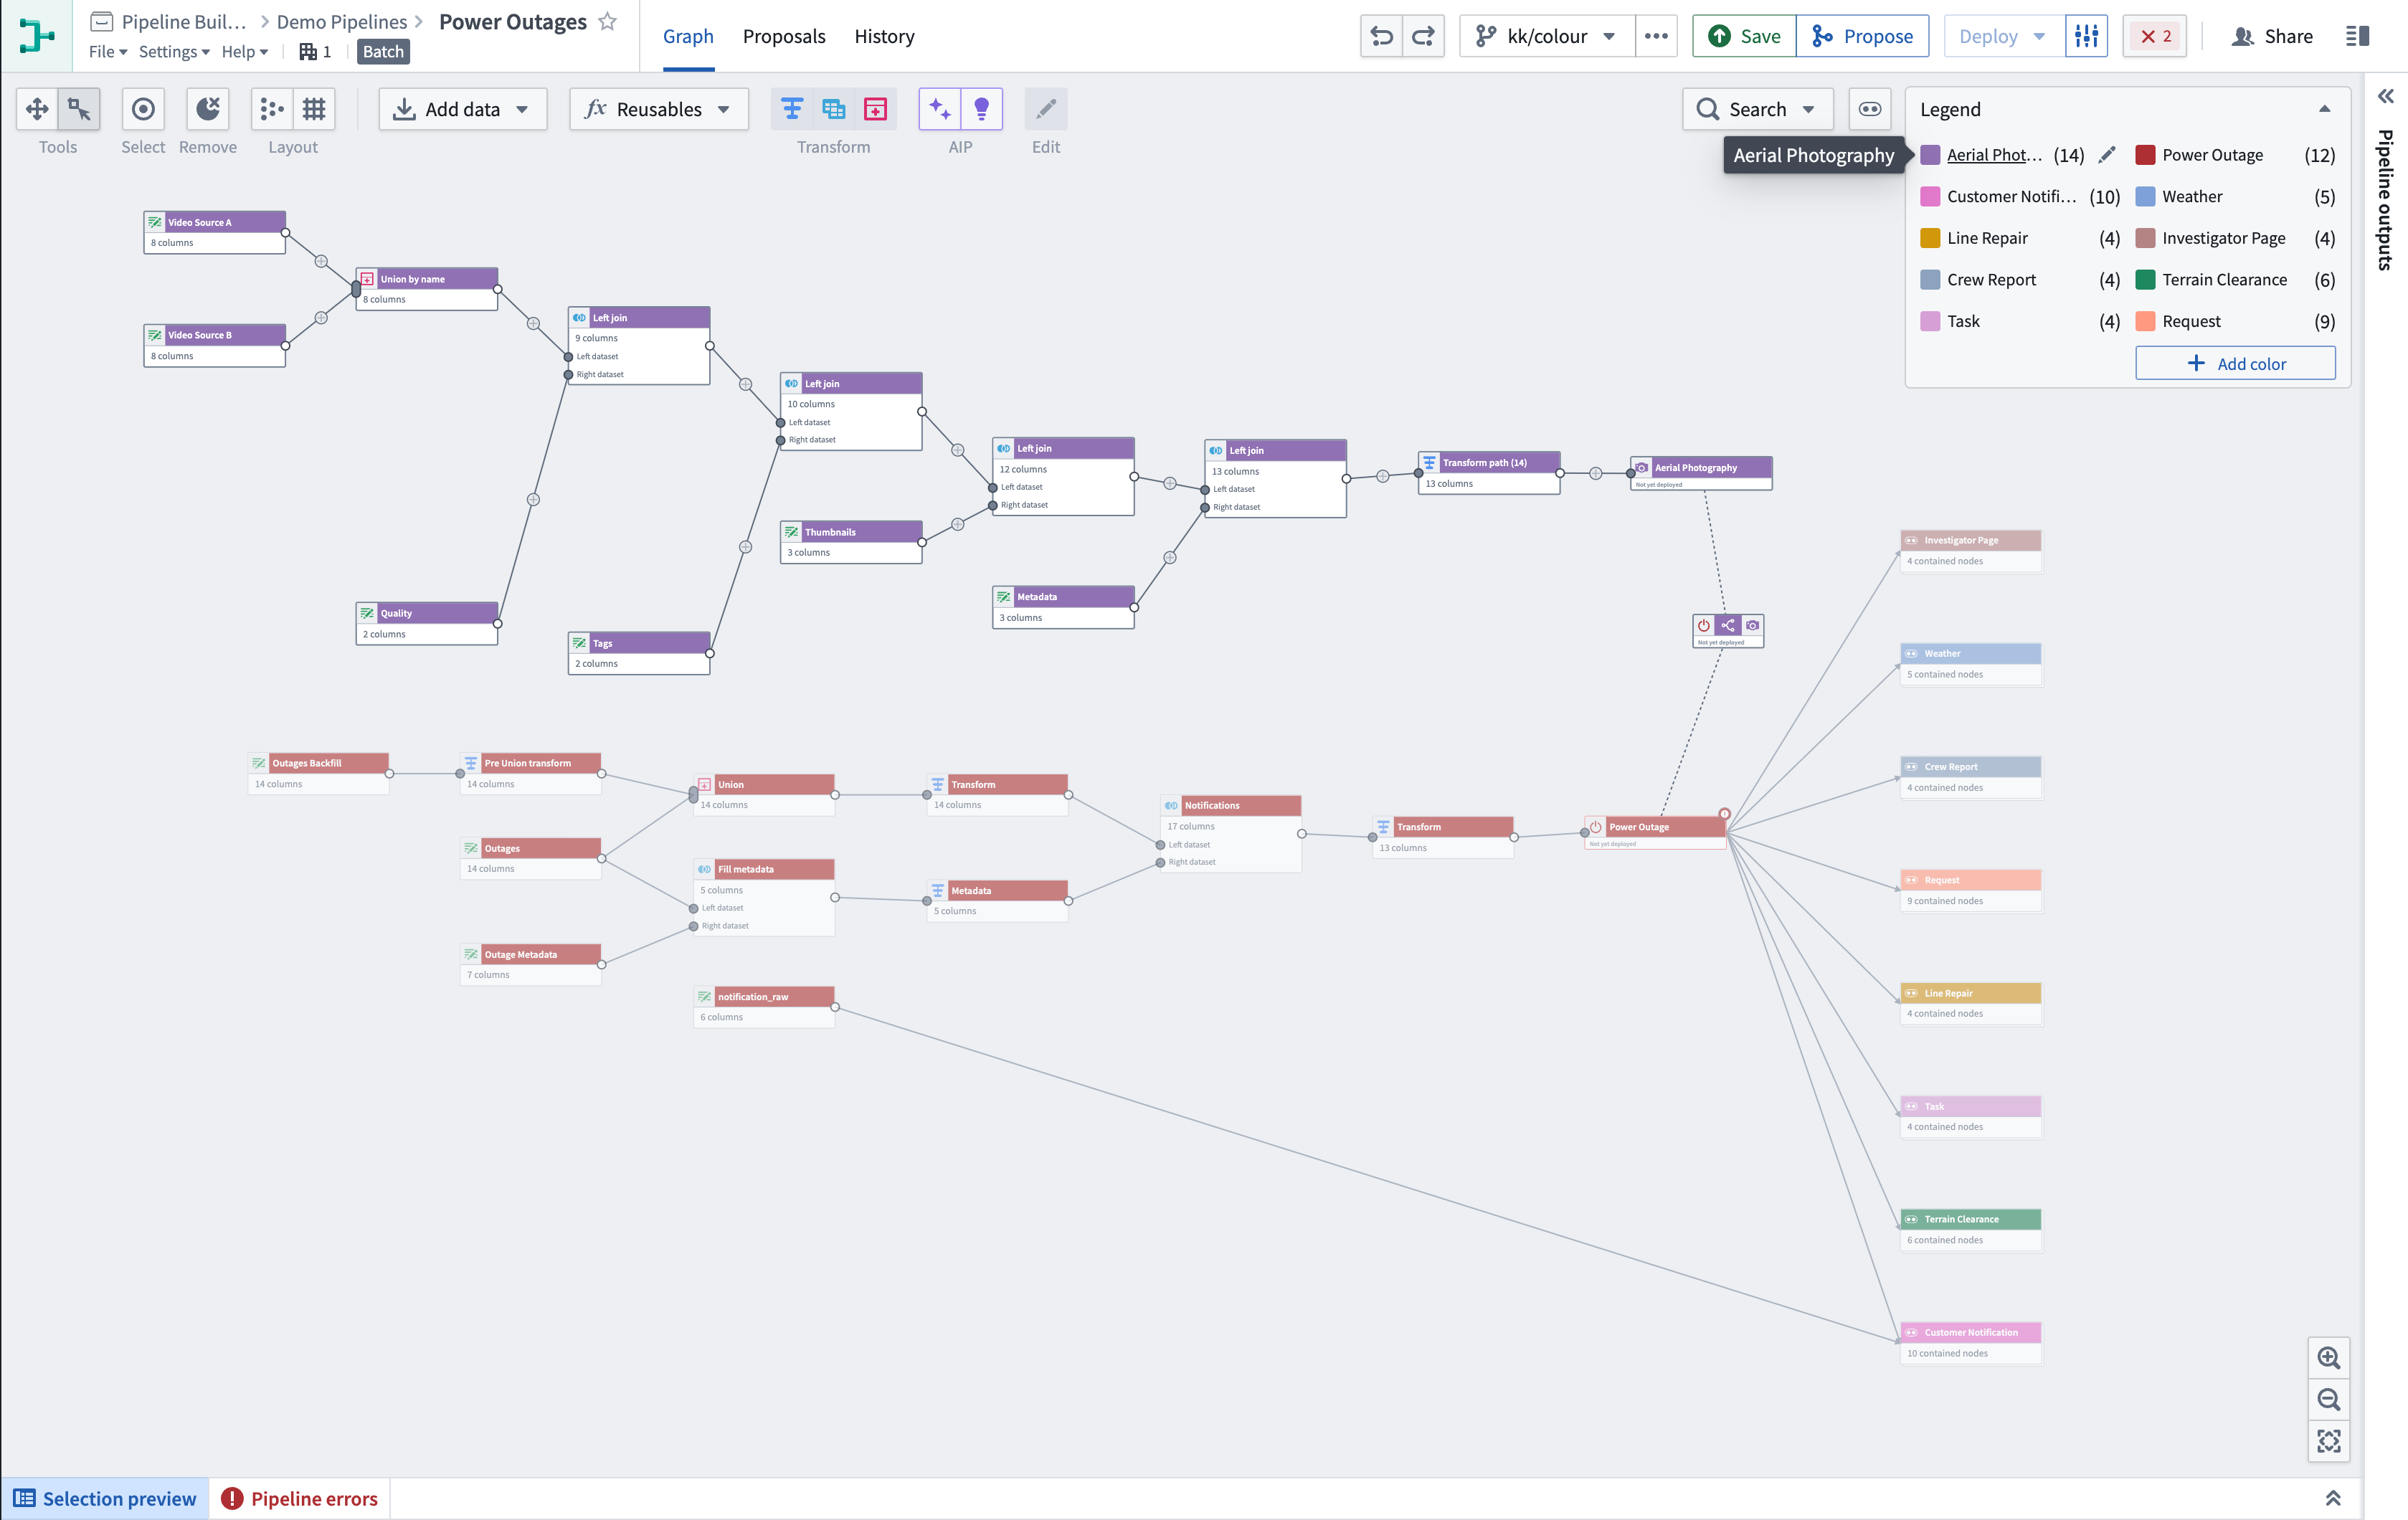
In Pipeline Builder, pipelines are typically grouped by color either vertically or horizontally. When divided into vertical sections, colors can clearly distinguish between the different stages of integration, from raw inputs to ontology outputs.
Divided horizontally, colors can be used to group the upstream lineage of a single object or a few closely related objects.
In the example below, color groups are divided both vertically and horizontally: Vertically to separate the iteration stages of raw inputs, and horizontally to group the object outputs of the pipeline.
Create and add to a color group
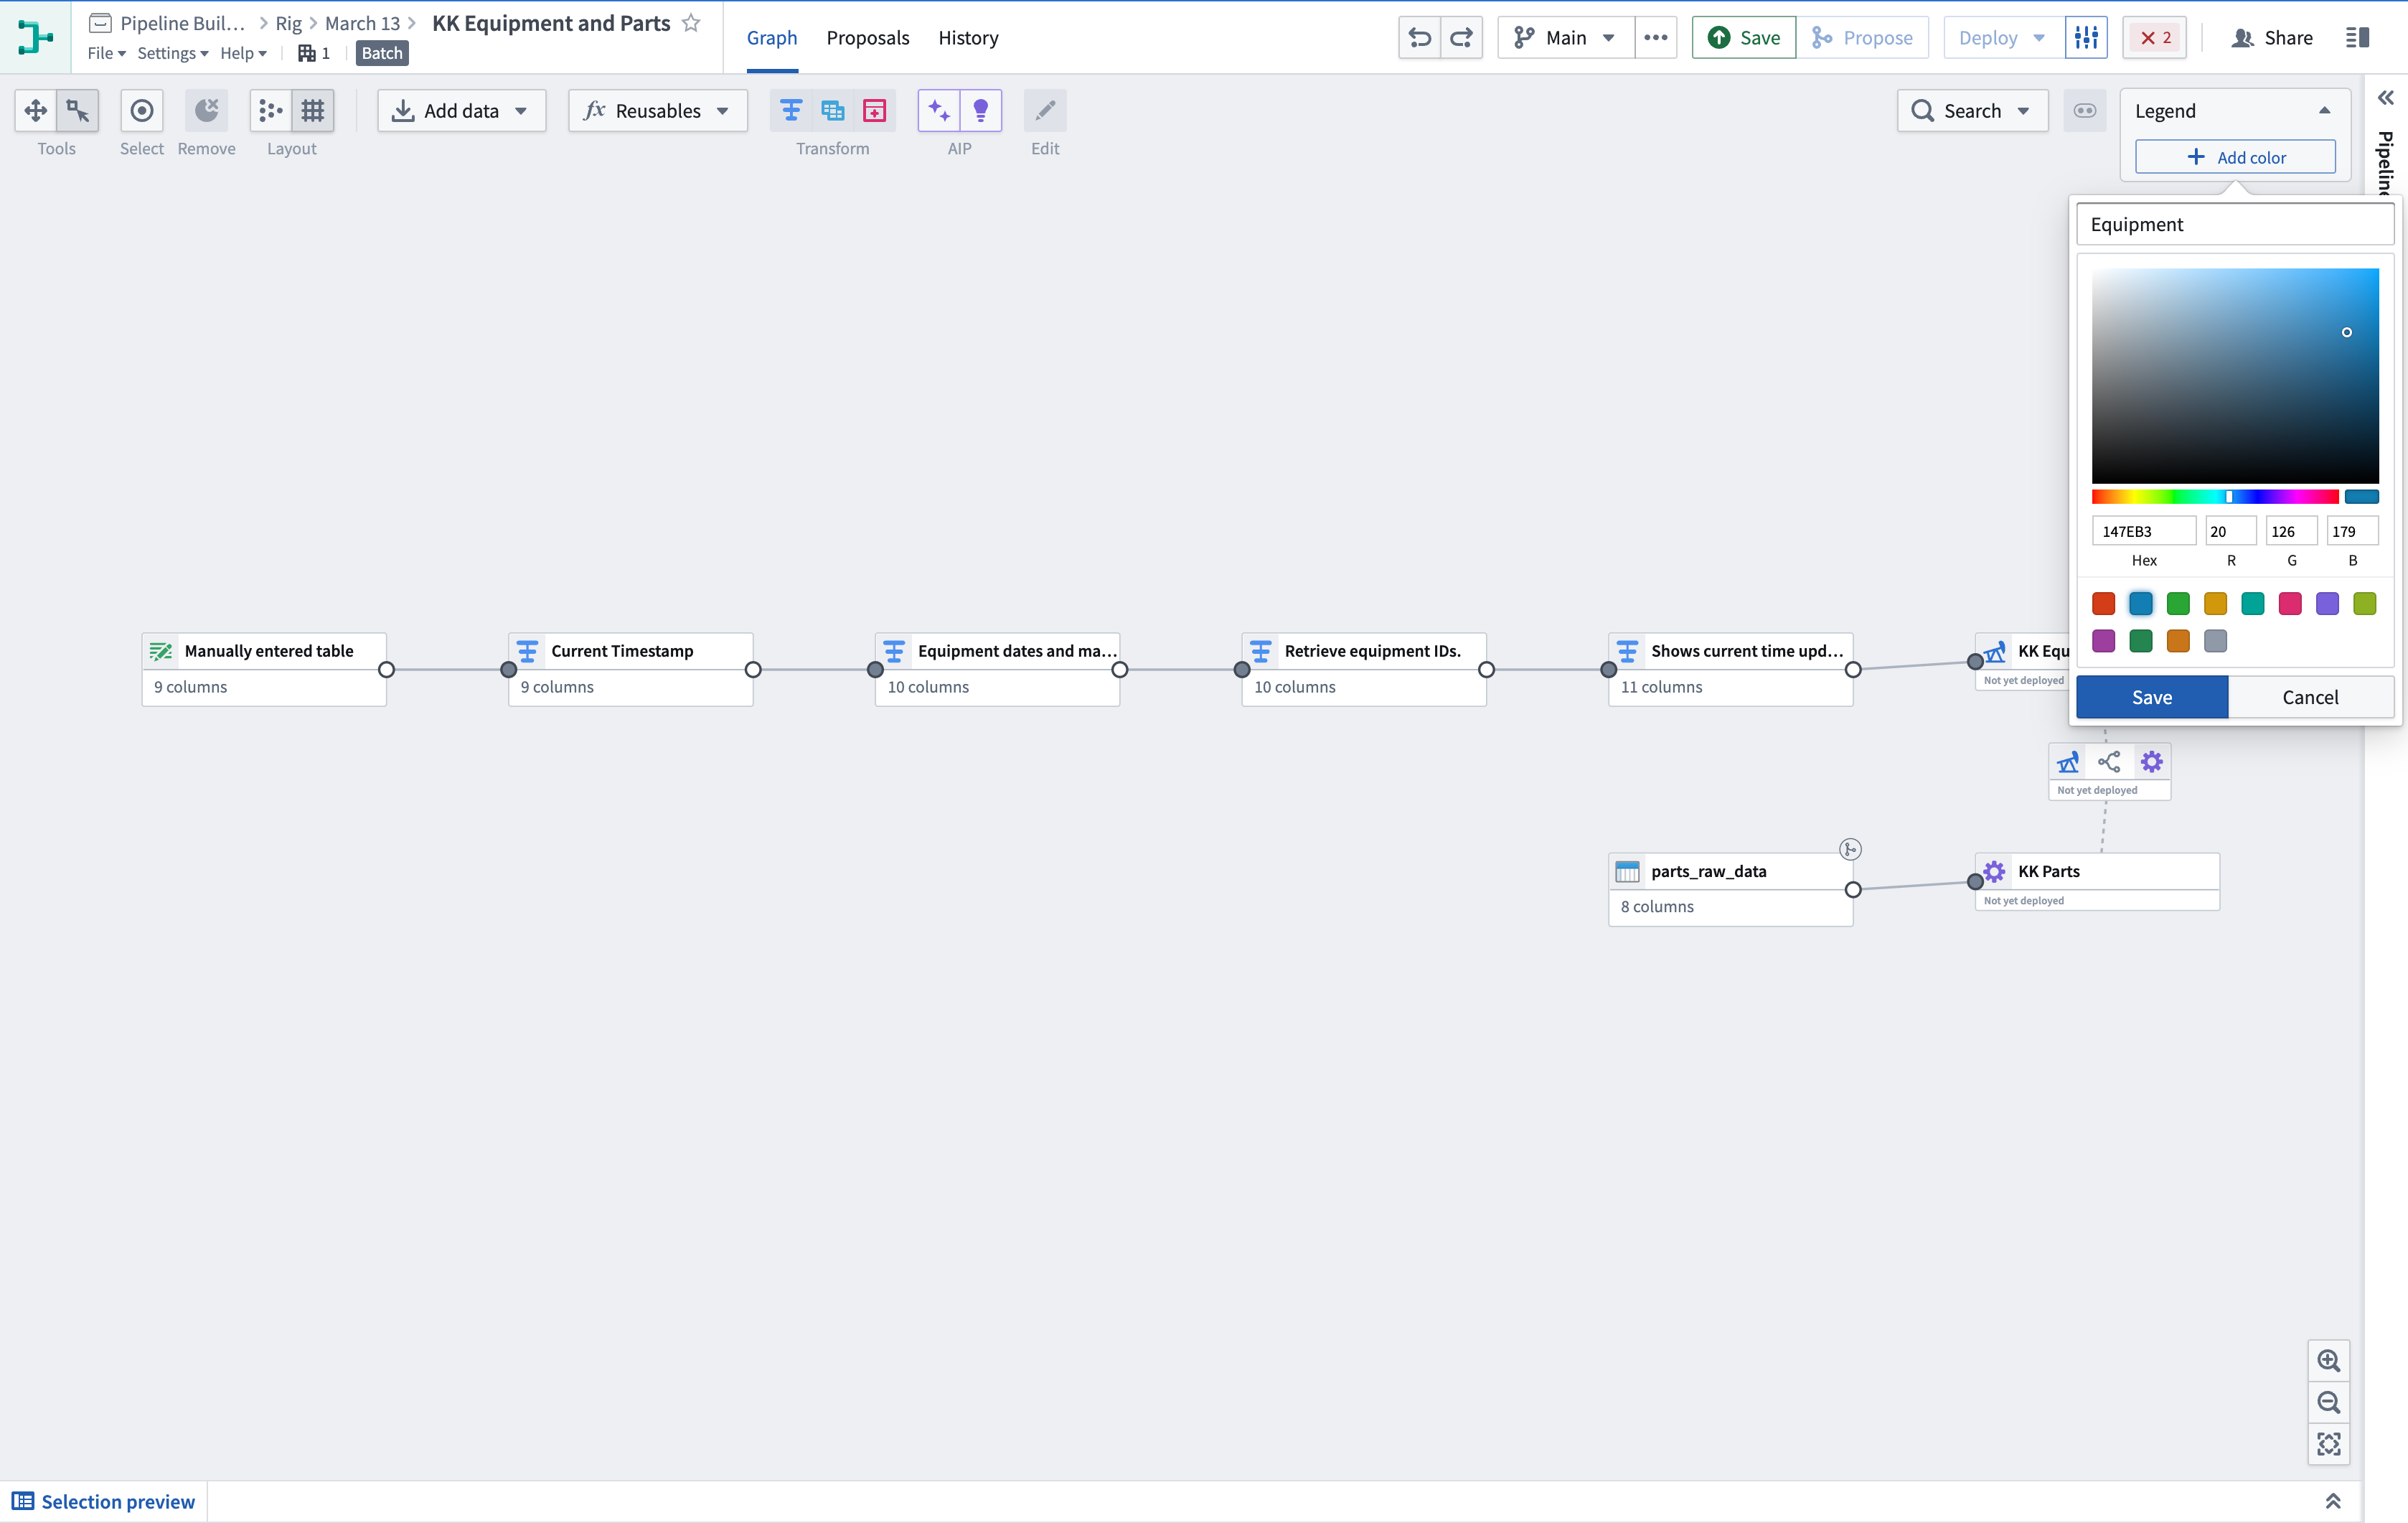
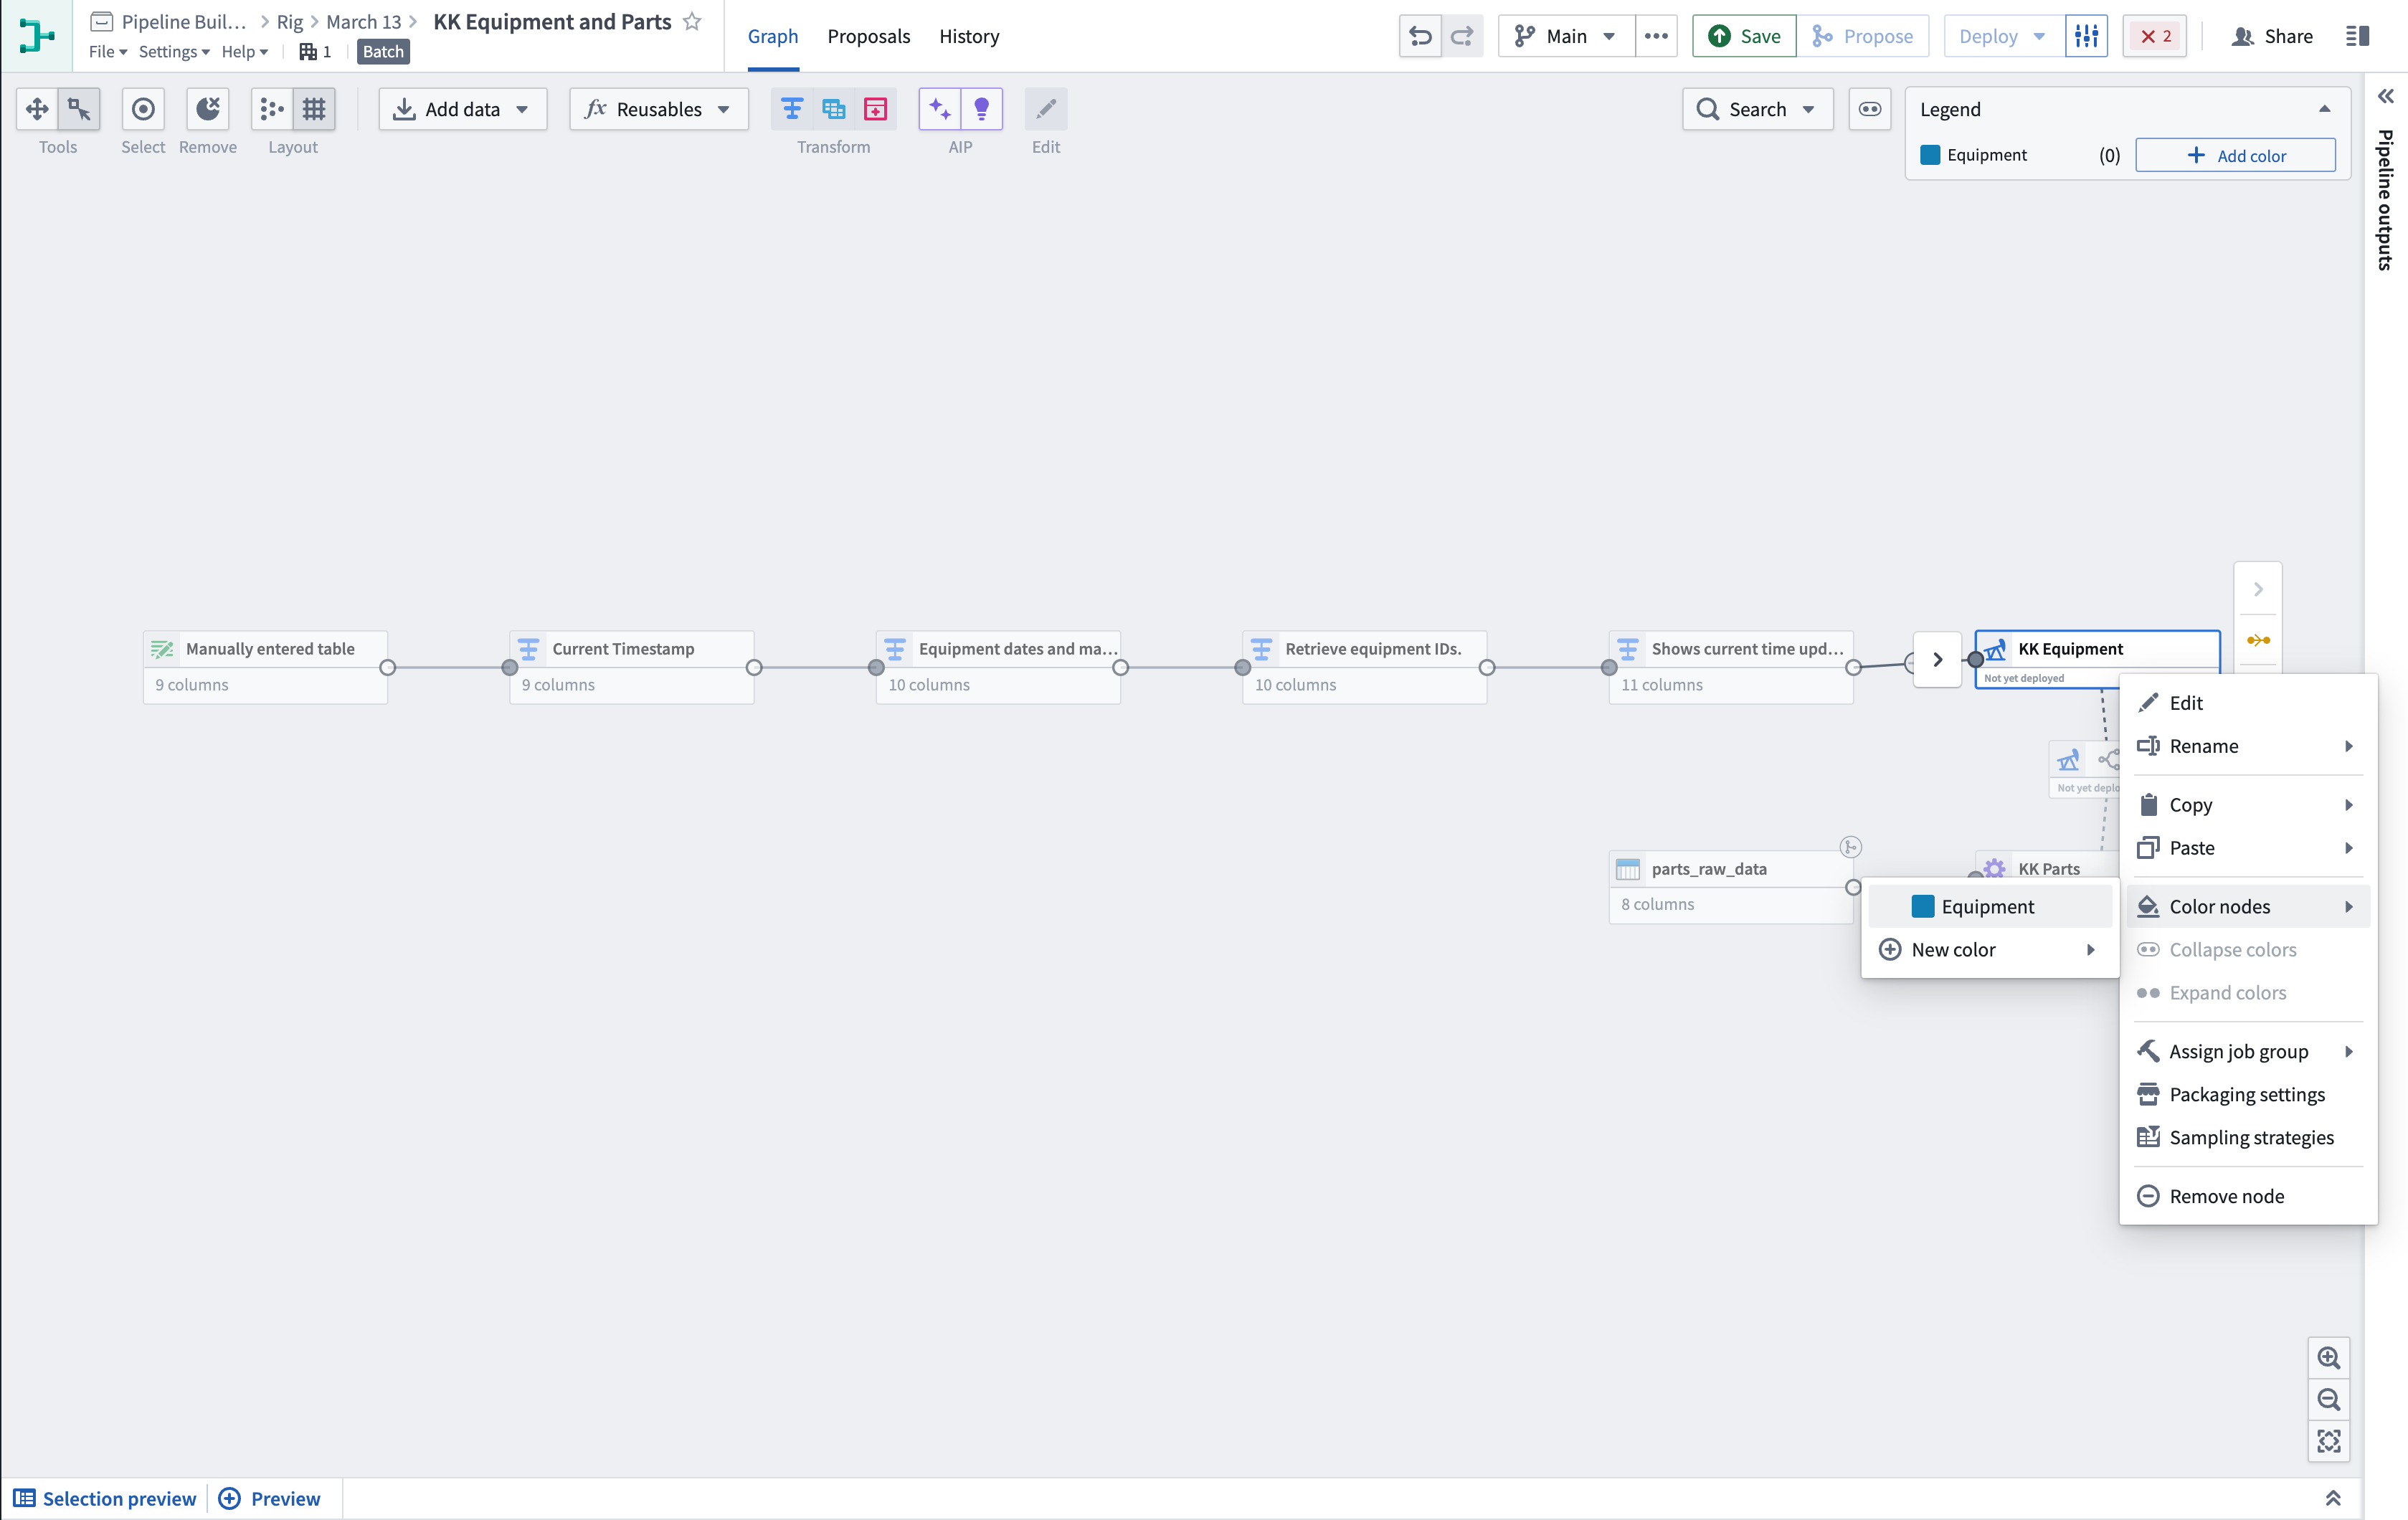
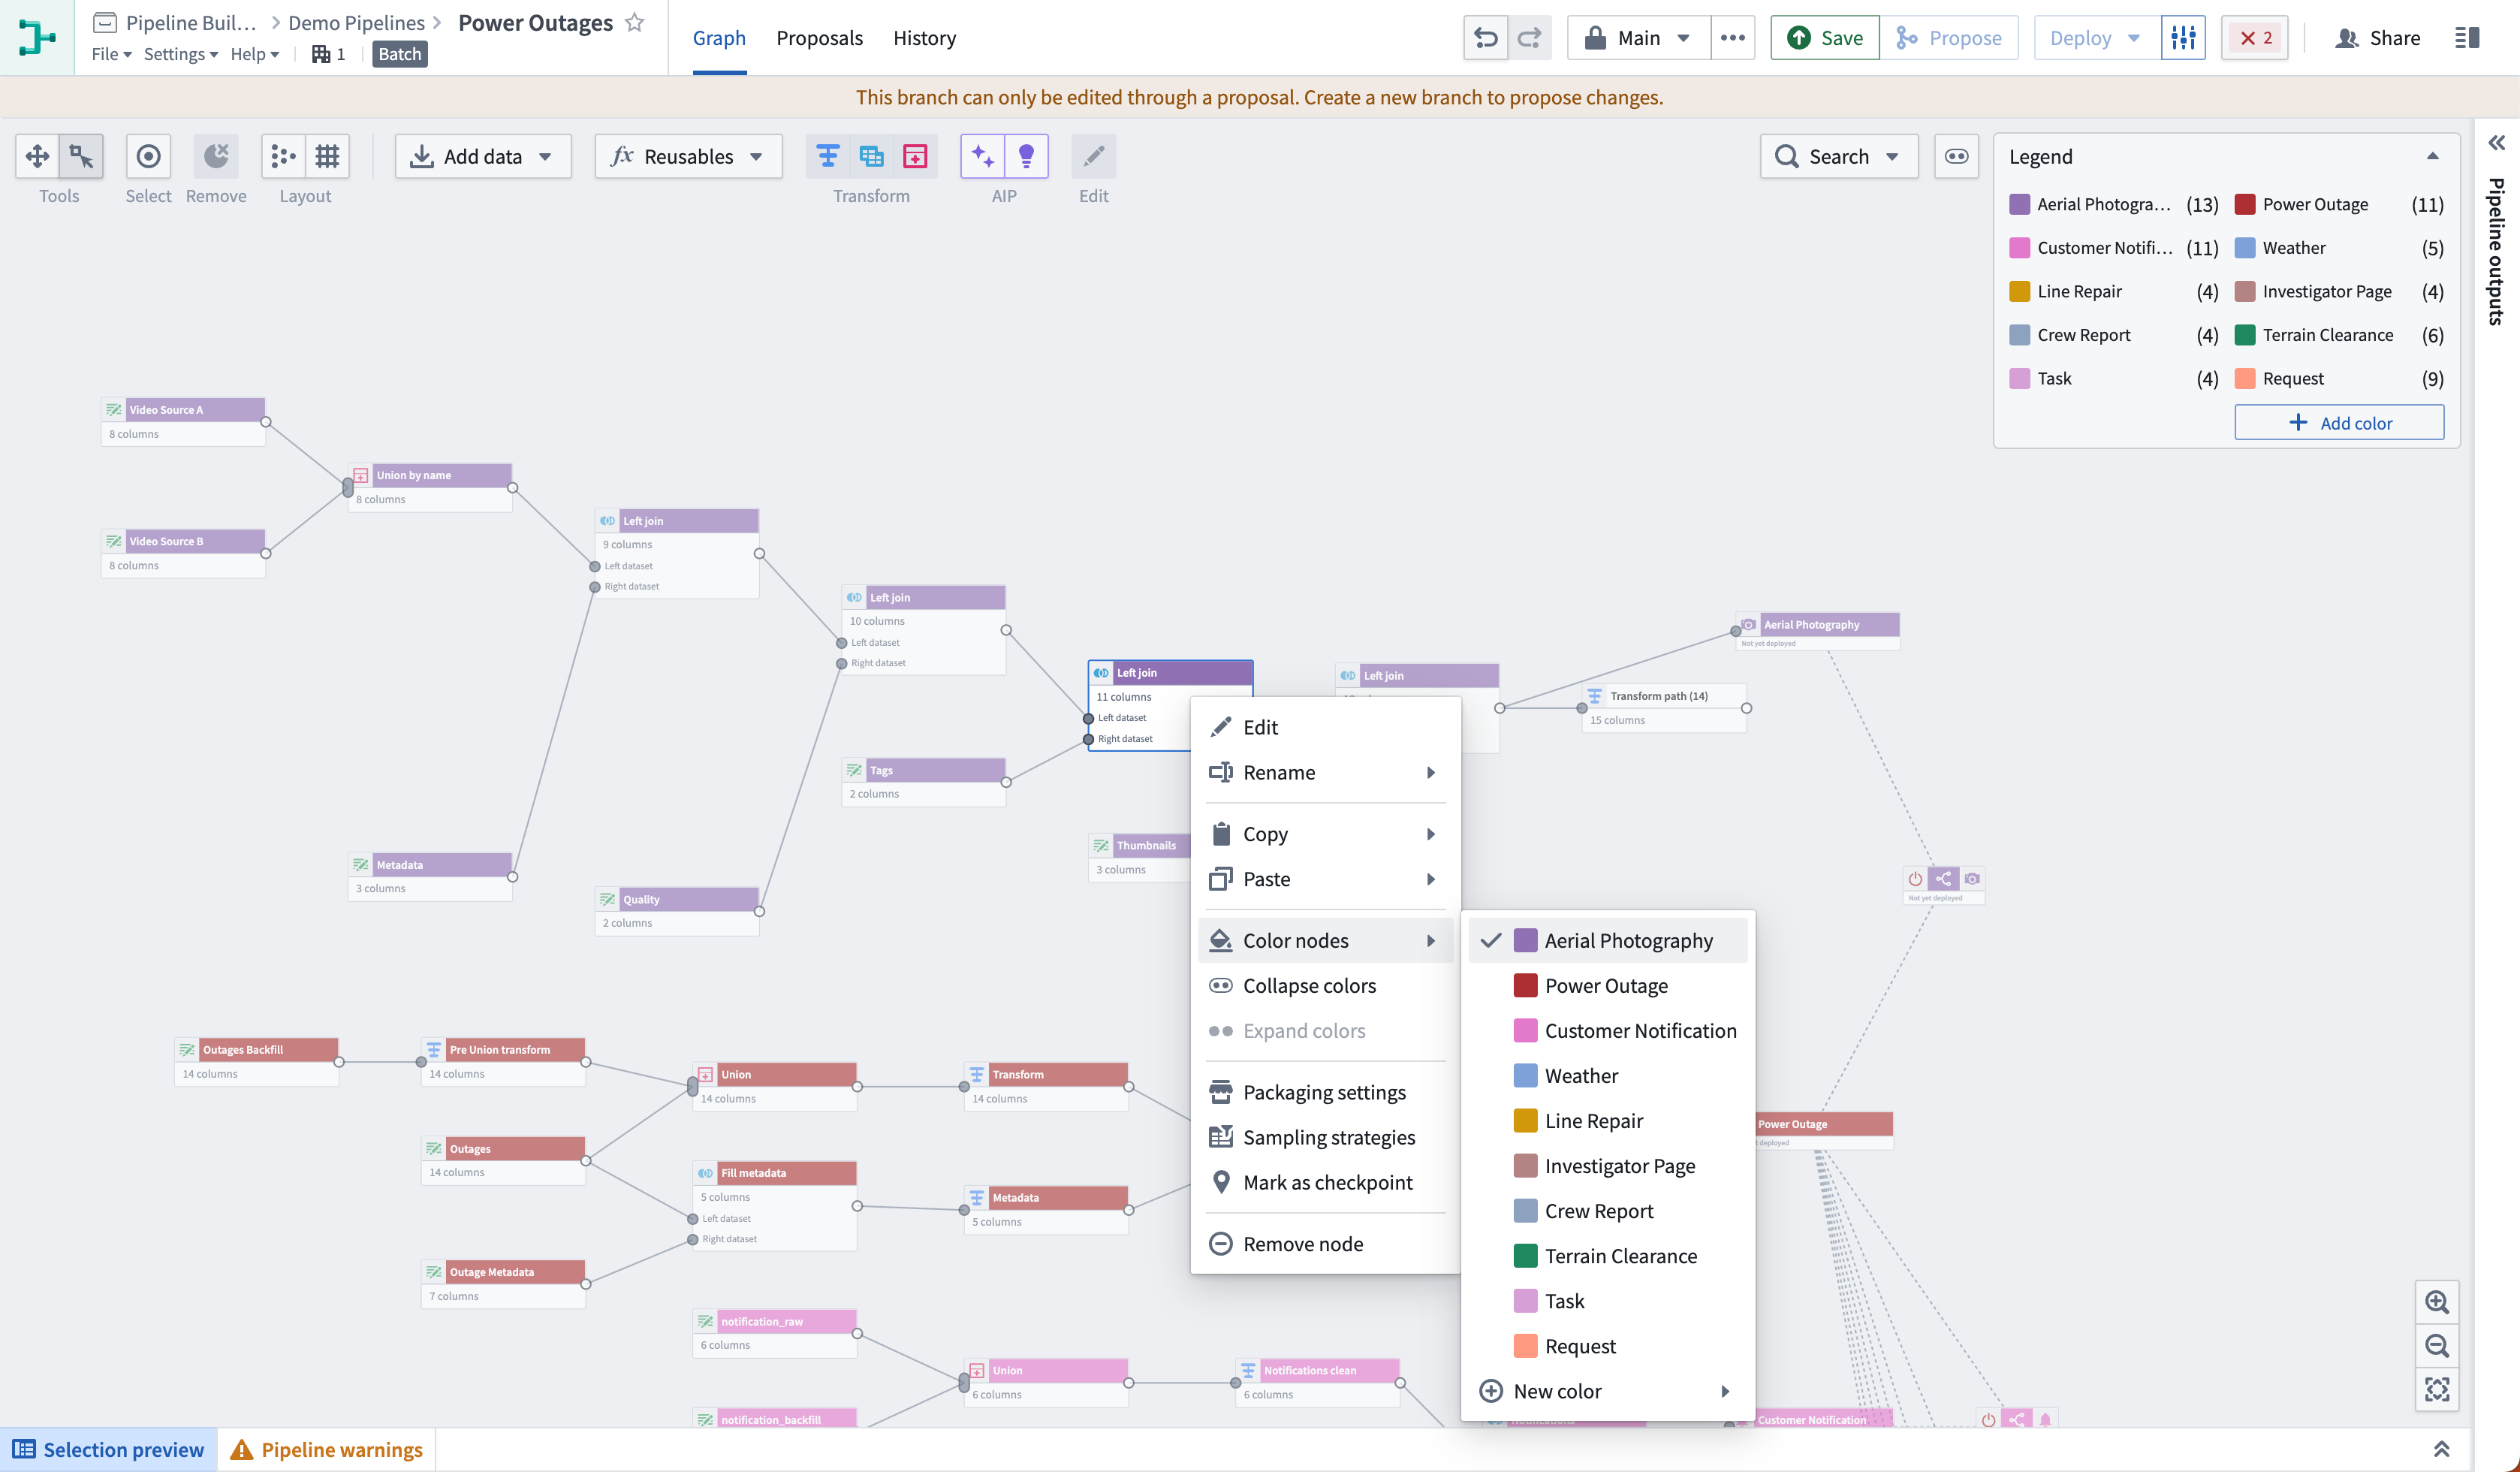
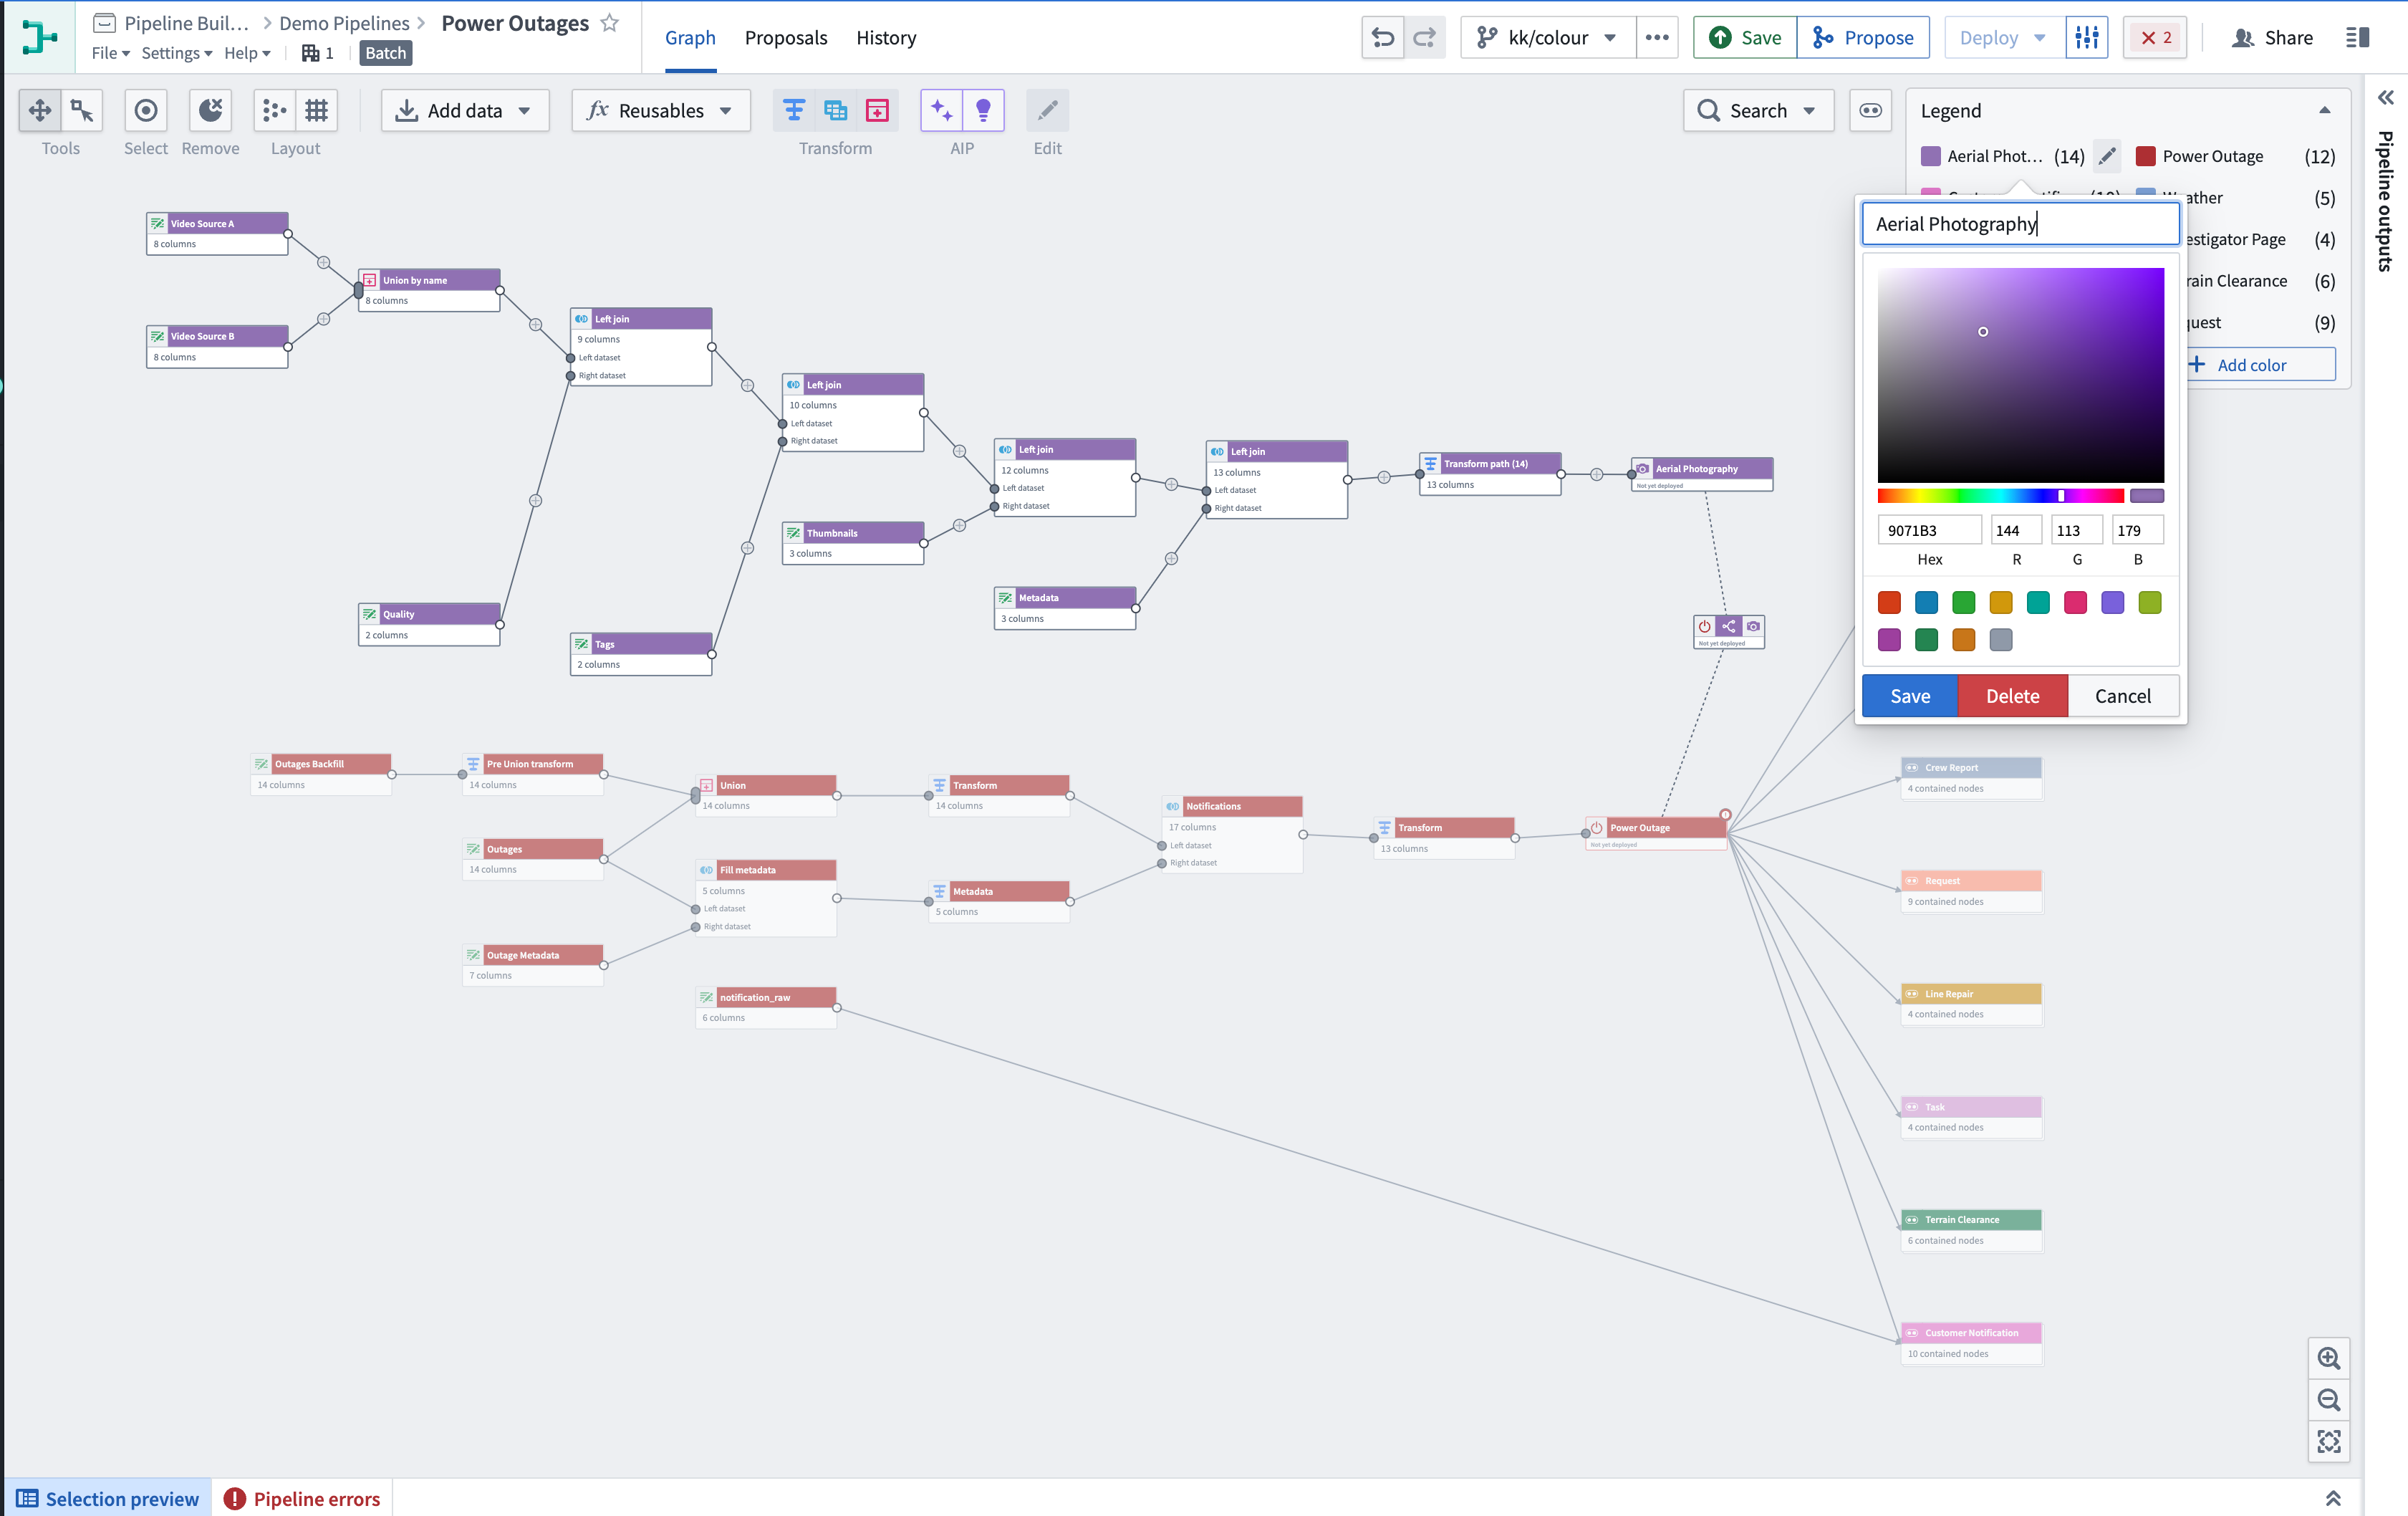
To create a new color group, select Add color in the legend in the upper-right corner of the graph. Then, set the name and color of the group. To add nodes to the group, right-click on the node and select Color nodes. Then, choose the group you created to add the selected nodes.
You can also create new color groups directly on the graph. Select the nodes you want to group, then right-click and select Color nodes > New color.
Collapse and expand color groups
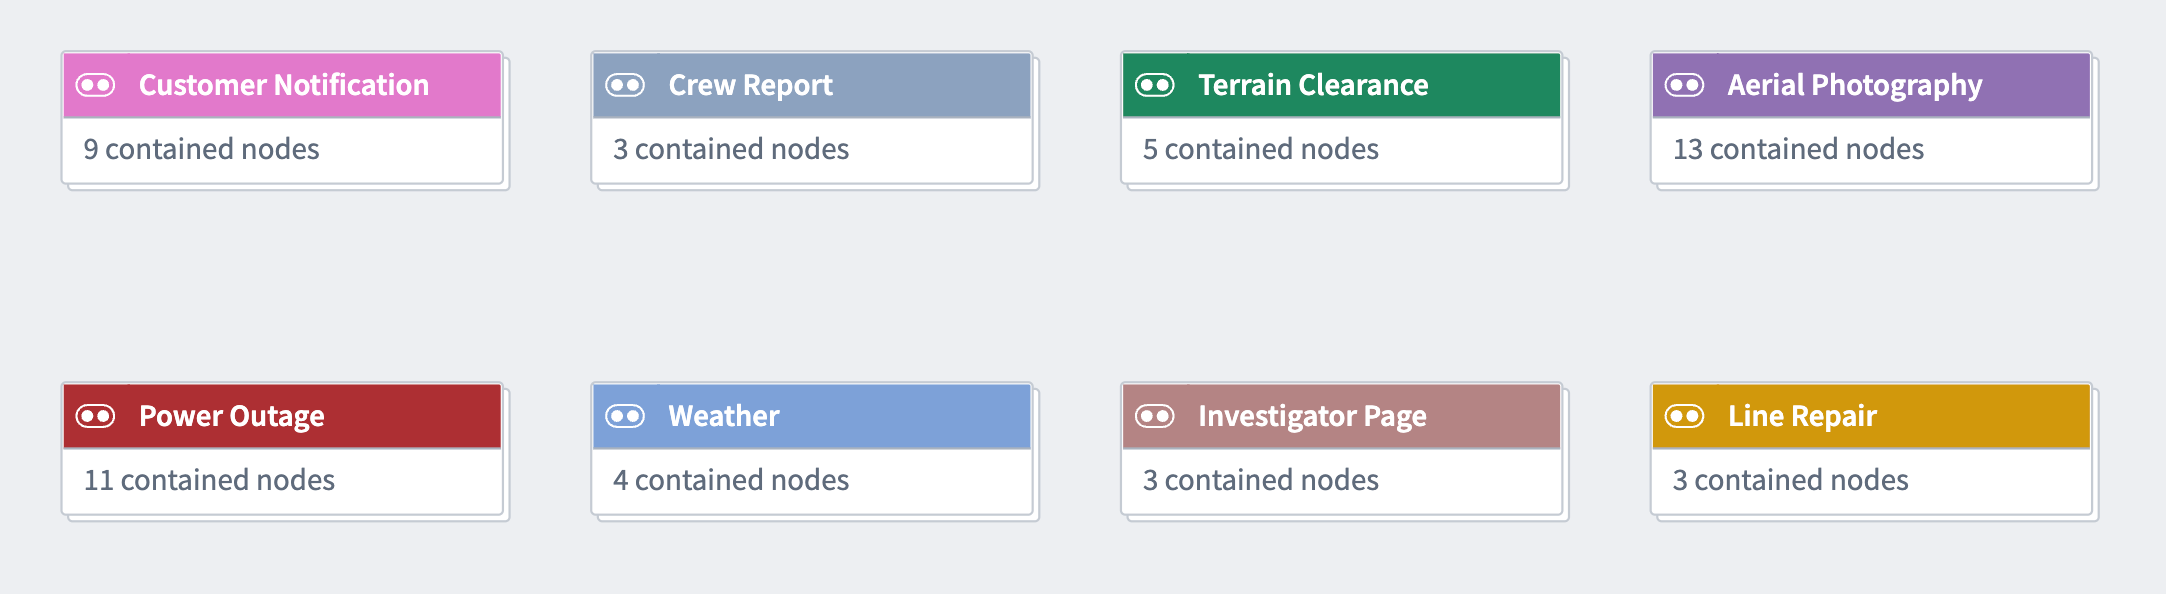
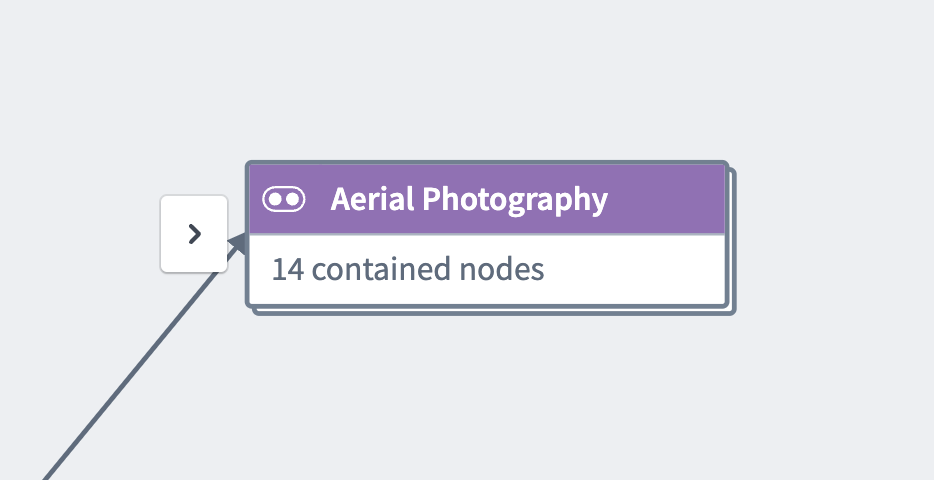
You can choose to collapse color groups to a single group node to simplify your graph view. This option can be particularly helpful if you are not actively working within nodes in a given color group.
To collapse a color group, right-click on any node in the color group and select Collapse colors. Alternatively, use the Collapse colors menu at the top right of the graph (next to the legend), and select the groups you want to collapse.
To expand the group, right-click the group node and select Expand colors, or double-click the collapsed group node.
Show and hide color groups
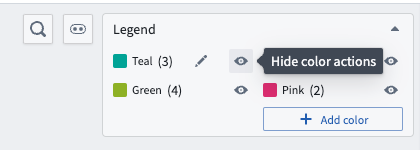
You can choose to hide a single color group or hide all other color groups to simplify the graph view. To hide a color, go to the color Legend and select the eye icon next to your chosen color. See showing and hiding color groups for more details.
Modify color groups
Remove a node from a color group
To remove a node from a color group, right-click the node, select Color nodes, then choose the group name.
Edit or delete node groups
To edit a color group, select the pencil icon when hovering on the group name in the legend. You can choose to rename, change the color, or delete the group.
Select nodes in a color group
To select all nodes inside a color group, select the group name in the legend.
View changes to node groups
When a pipeline change proposal is submitted, any color groups affected by the changes will be marked with a distinct color border.
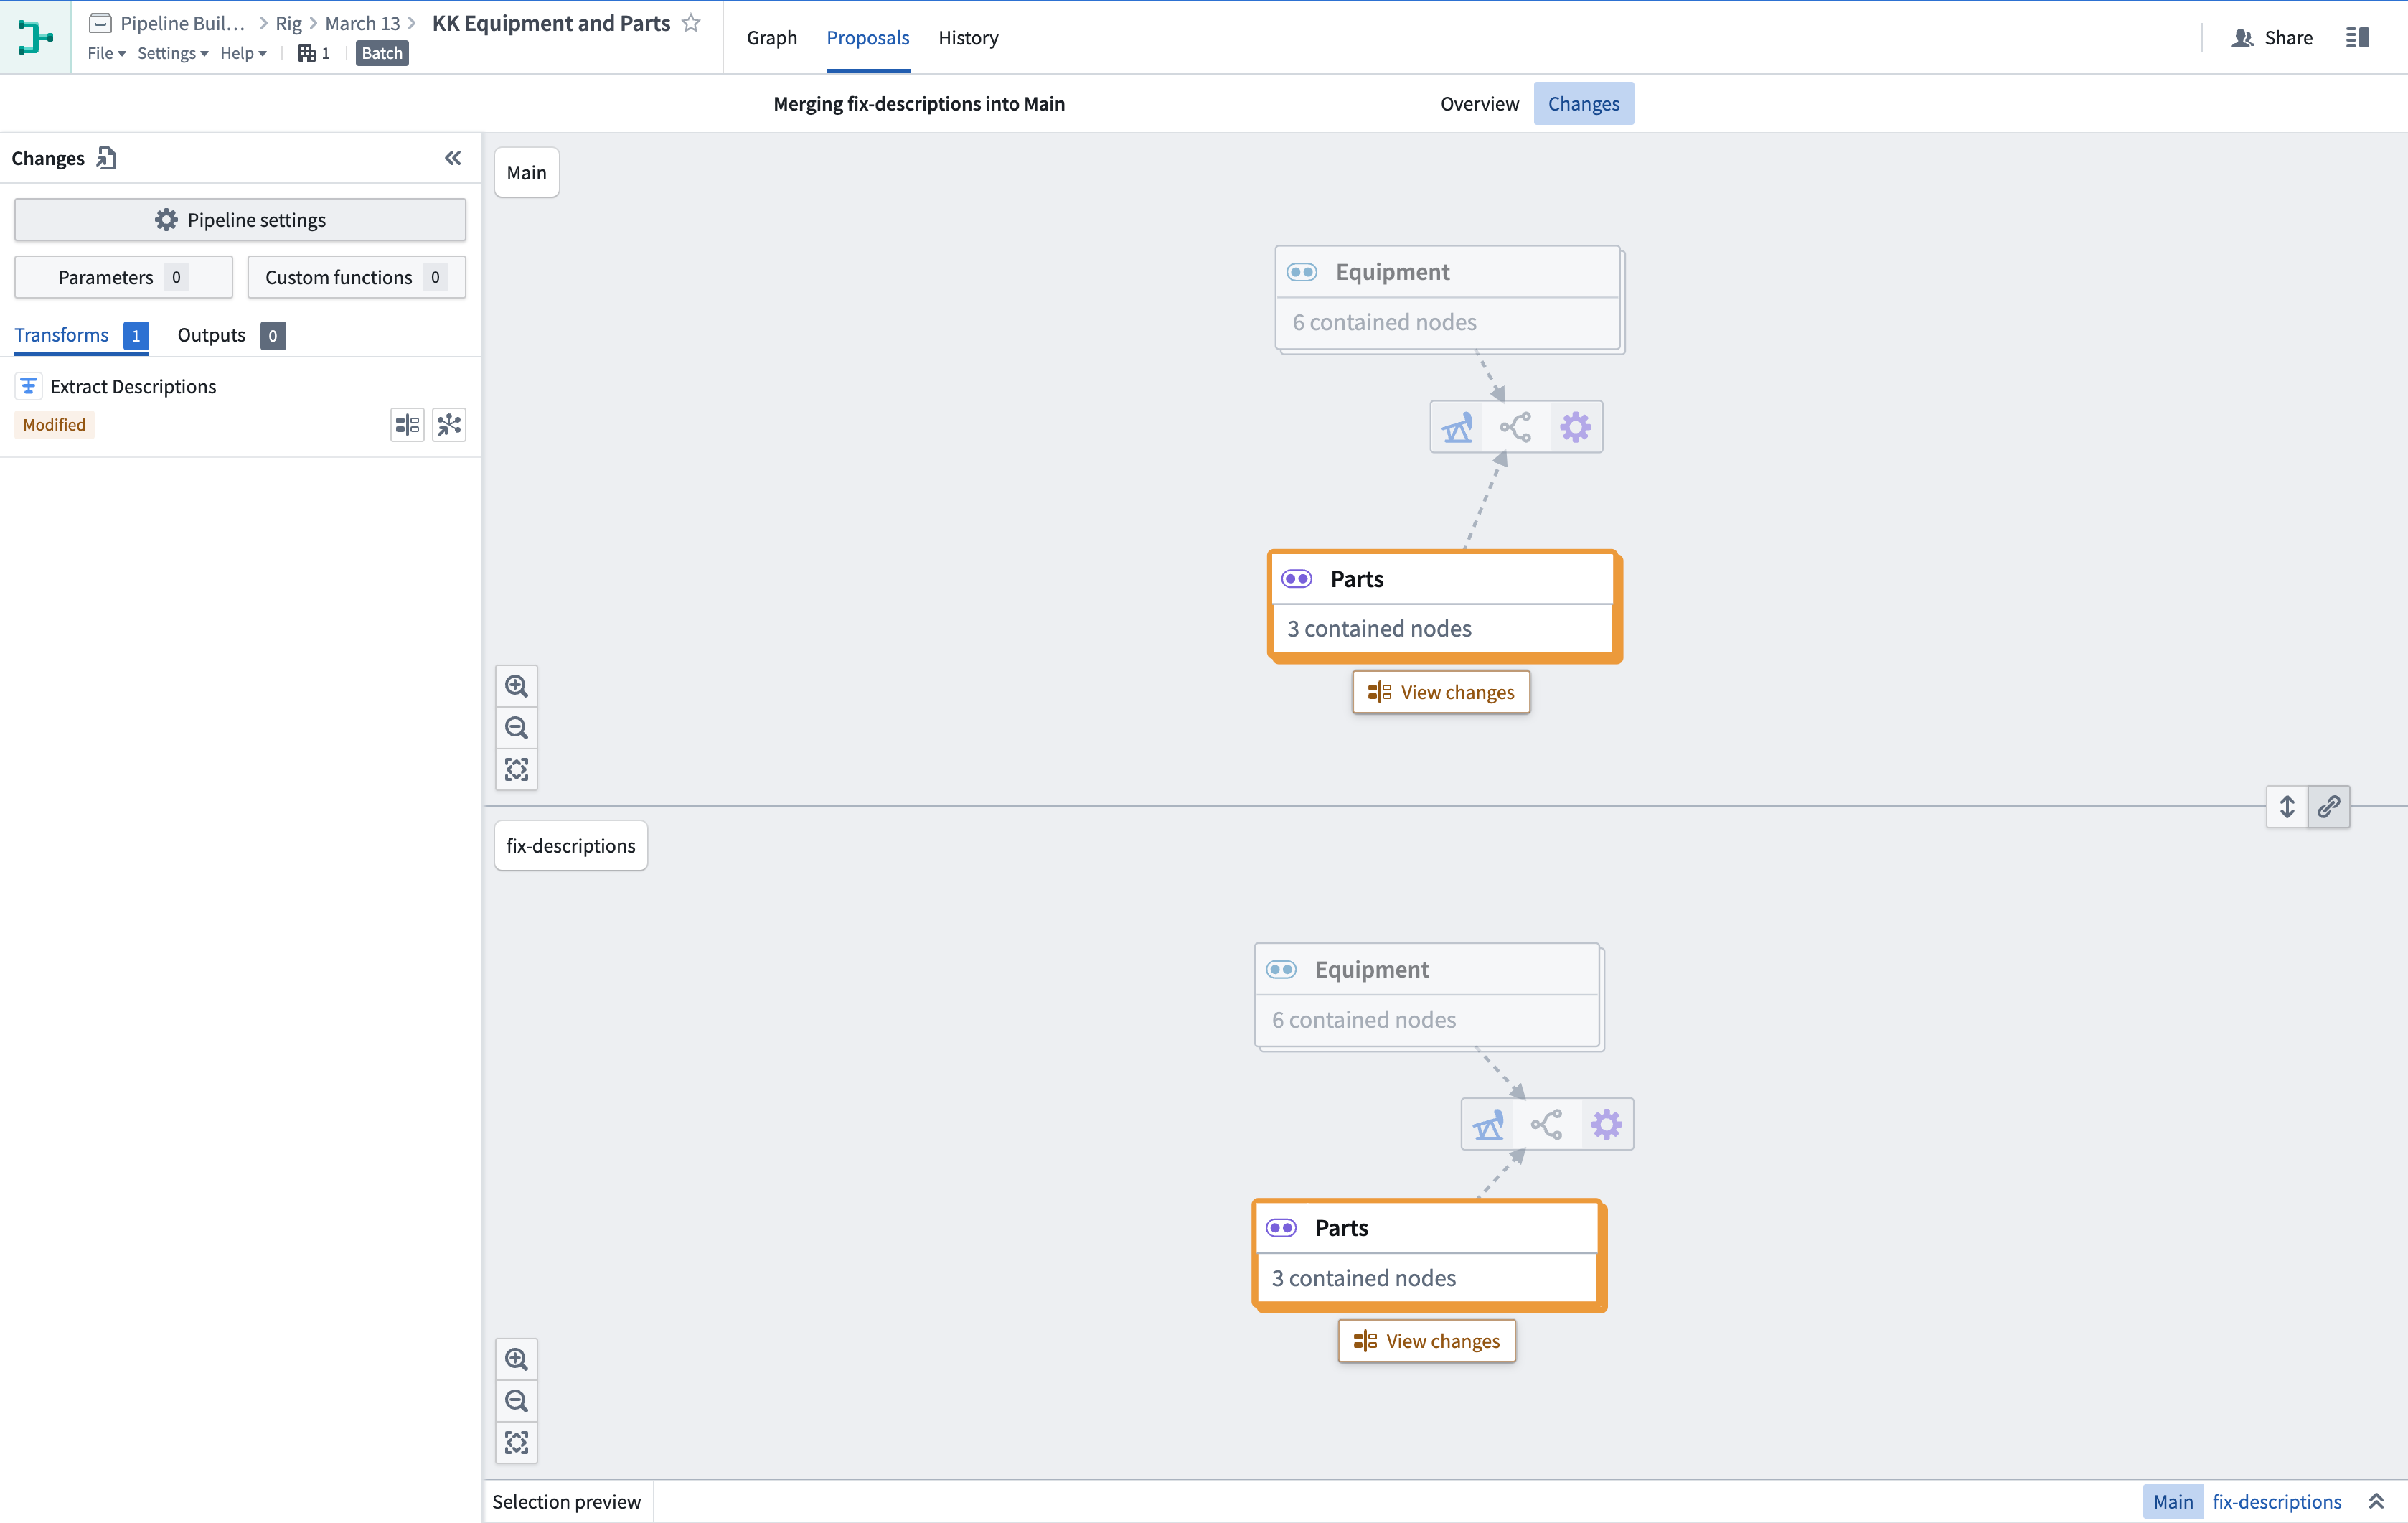
Select View changes to view the nodes inside the color group. Any individual nodes with proposed changes will be highlighted.
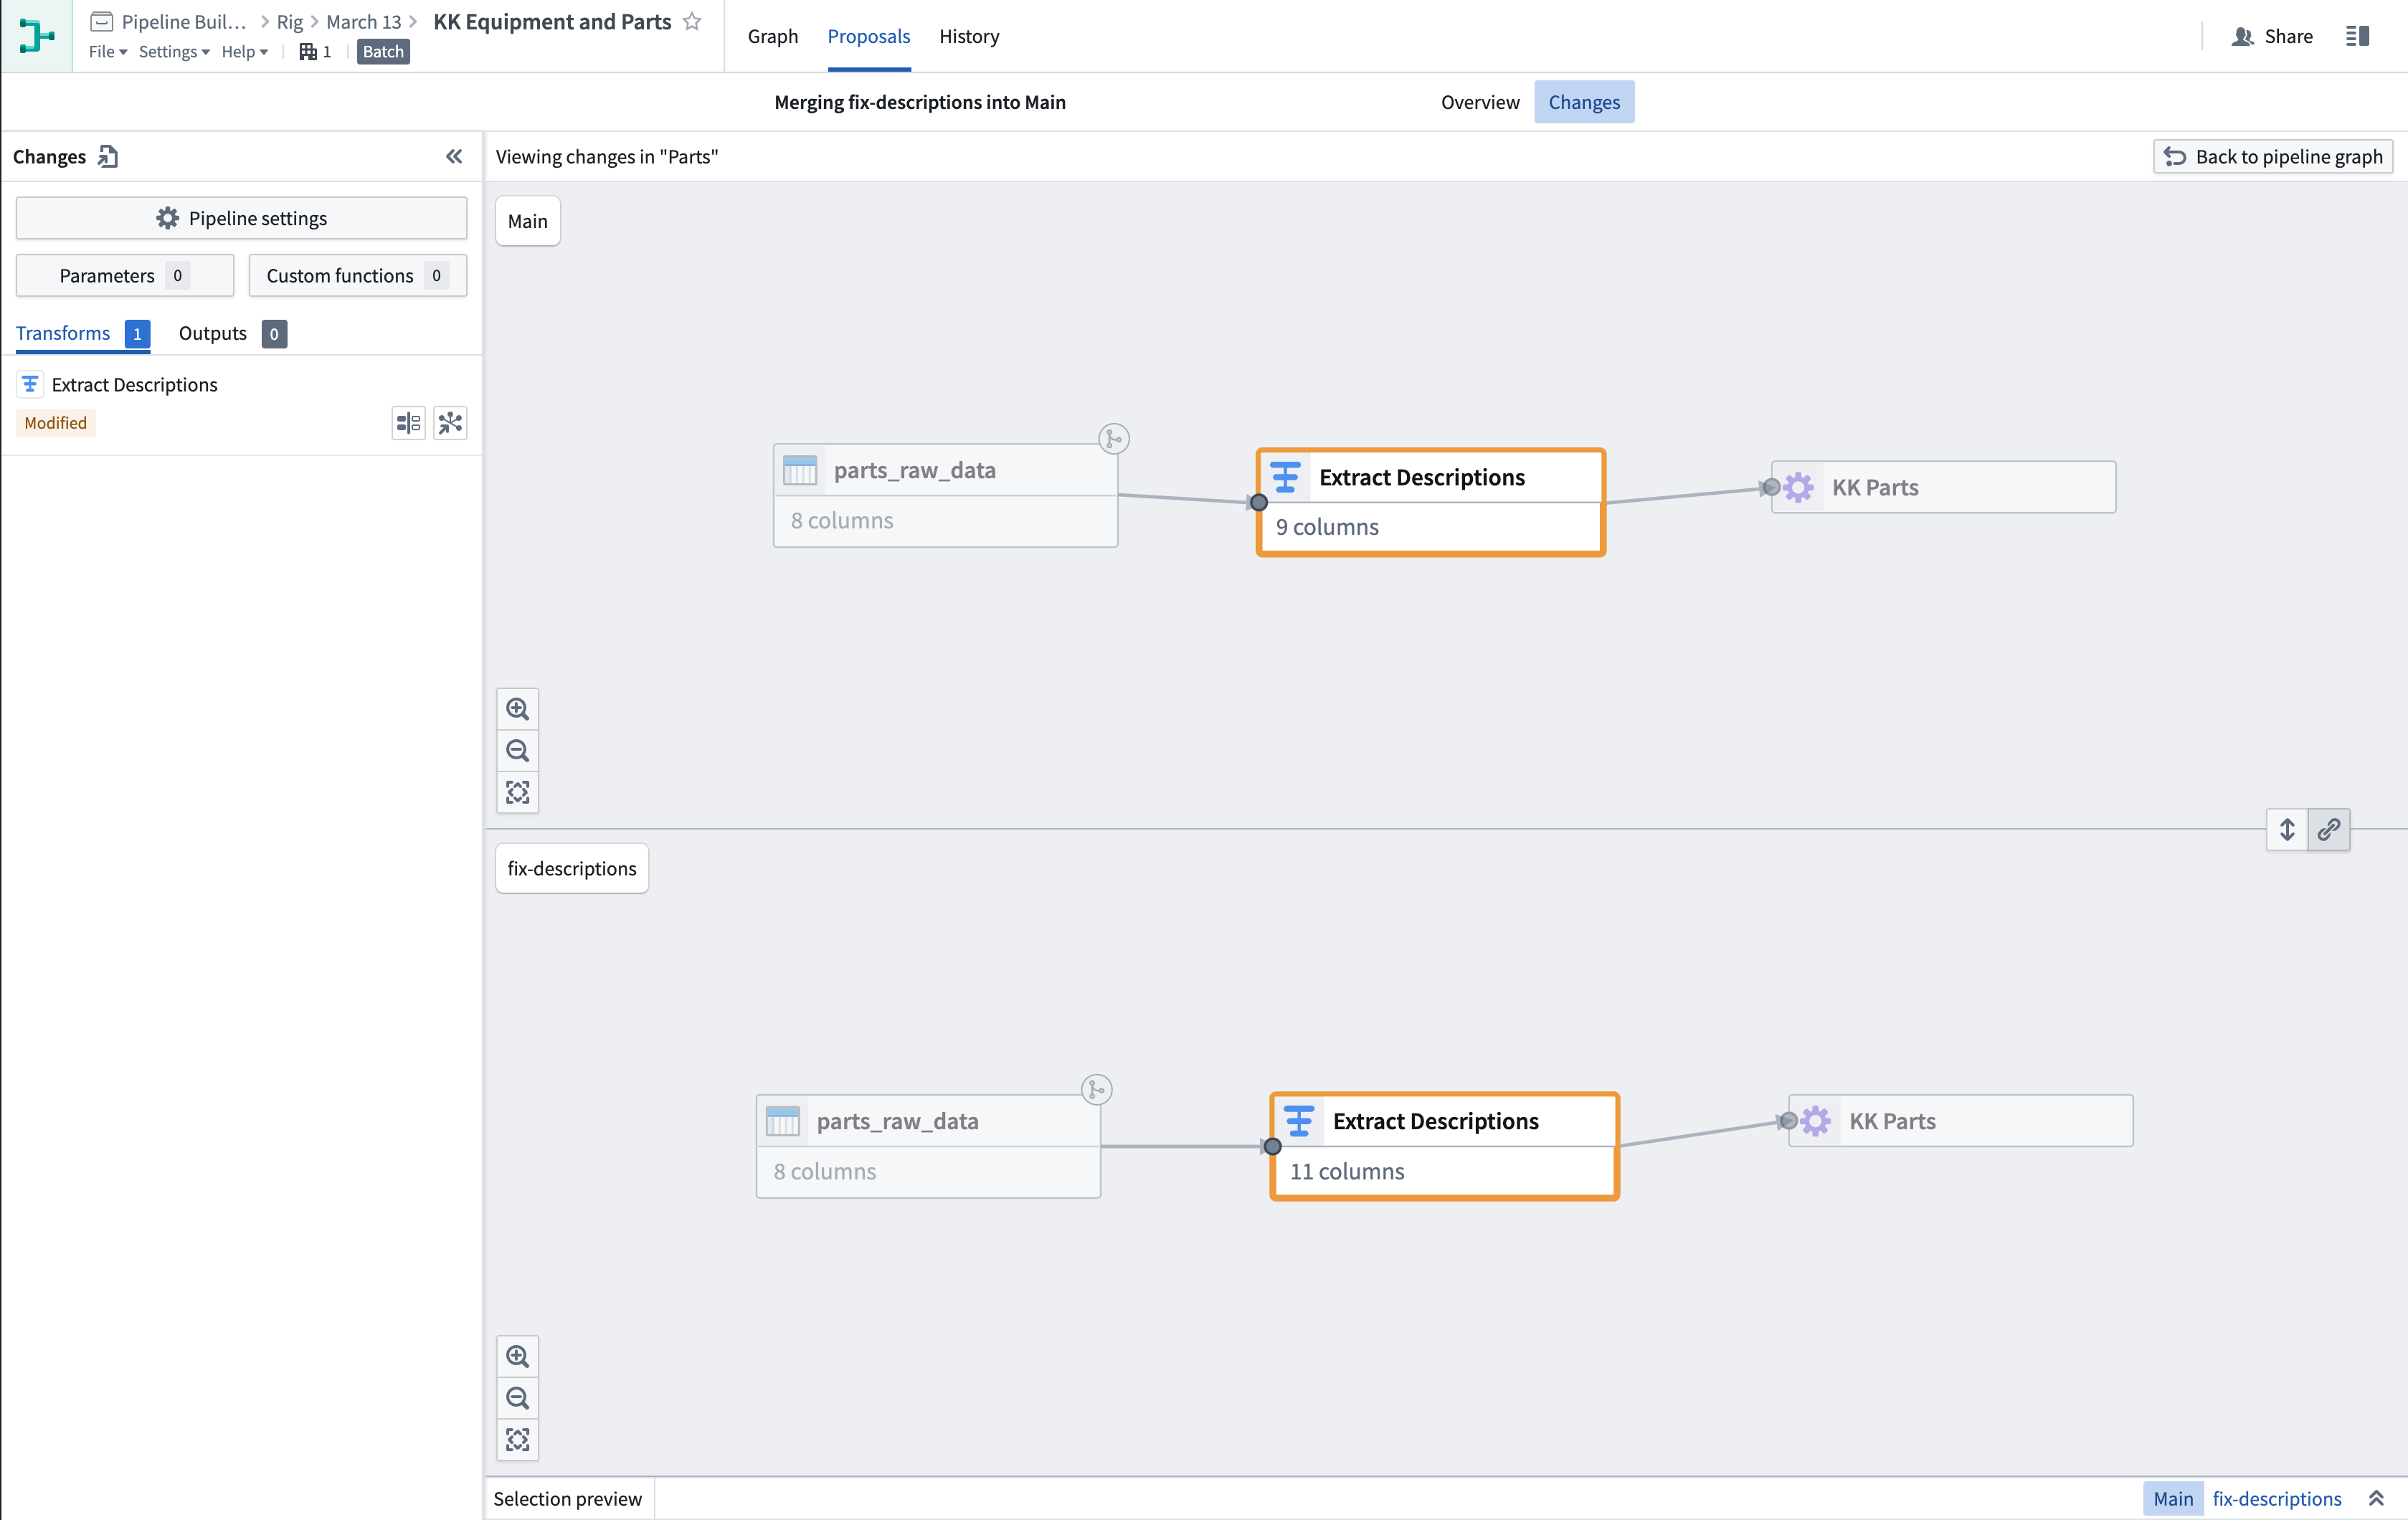
Select Back to pipeline graph to return to the main proposal changes view.
中文翻译
颜色分组
您可以在 Pipeline Builder 中使用节点颜色分组来更好地组织和管理您的管道。颜色分组有助于标识节点并提高图形的可读性。您还可以折叠或隐藏颜色分组,以简化图形视图并清理管道可视化效果。
在 Pipeline Builder 中,管道通常按颜色垂直或水平分组。当垂直划分时,颜色可以清晰区分集成的不同阶段,从原始输入到本体论(Ontology)输出。
当水平划分时,颜色可用于对单个对象或几个紧密相关对象的上游谱系(upstream lineage)进行分组。
在下面的示例中,颜色分组同时进行了垂直和水平划分:垂直划分用于分离原始输入的迭代阶段,水平划分用于对管道的对象输出进行分组。
创建并添加到颜色分组
要创建新的颜色分组,请选择图形右上角图例中的 添加颜色(Add color)。然后,设置分组的名称和颜色。 要向分组添加节点,请右键单击节点并选择 颜色节点(Color nodes)。然后,选择您创建的分组以添加所选节点。
您也可以直接在图形上创建新的颜色分组。选择要分组的节点,然后右键单击并选择 颜色节点(Color nodes) > 新颜色(New color)。
折叠和展开颜色分组
您可以选择将颜色分组折叠为单个分组节点,以简化图形视图。如果您当前不在某个颜色分组内的节点上工作,此选项尤其有用。
要折叠颜色分组,请右键单击该颜色分组中的任意节点,然后选择 折叠颜色(Collapse colors)。或者,使用图形右上角的 折叠颜色(Collapse colors) 菜单(图例旁边),然后选择要折叠的分组。
要展开分组,请右键单击分组节点并选择 展开颜色(Expand colors),或双击折叠的分组节点。
显示和隐藏颜色分组
您可以选择隐藏单个颜色分组或隐藏所有其他颜色分组,以简化图形视图。要隐藏颜色,请转到颜色 图例(Legend),然后选择所选颜色旁边的眼睛图标。有关更多详细信息,请参阅显示和隐藏颜色分组。
修改颜色分组
从颜色分组中移除节点
要从颜色分组中移除节点,请右键单击该节点,选择 颜色节点(Color nodes),然后选择分组名称。
编辑或删除节点分组
要编辑颜色分组,请将鼠标悬停在图例中的分组名称上,然后选择铅笔图标。您可以选择重命名、更改颜色或删除分组。
选择颜色分组中的节点
要选择颜色分组内的所有节点,请在图例中选择分组名称。
查看对节点分组的更改
当提交管道变更提案(pipeline change proposal)时,受更改影响的任何颜色分组都将用独特的颜色边框标记。
选择 查看更改(View changes) 以查看颜色分组内的节点。任何有提案更改的单个节点都将被高亮显示。
选择 返回管道图形(Back to pipeline graph) 以返回主提案更改视图。