Show and hide nodes(显示和隐藏节点)
To help manage large pipelines efficiently, users can focus on pipeline subsections by showing and hiding nodes. This allows quicker identification of pipeline segments and an improved navigation and editing experience.
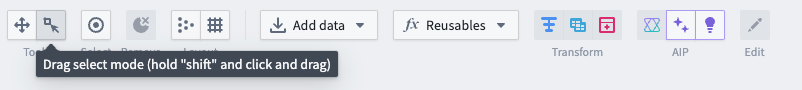
Manually select nodes in the graph view or use Drag select mode by choosing the area select icon in the top left.
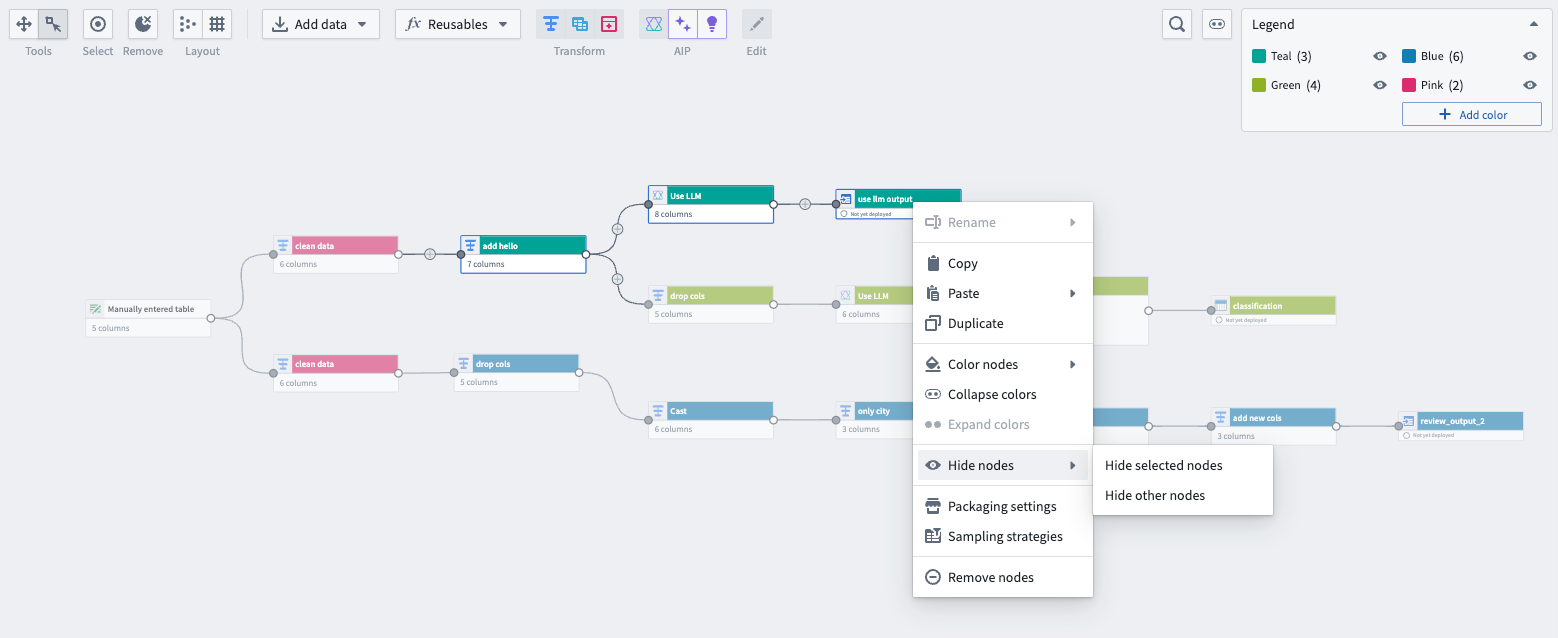
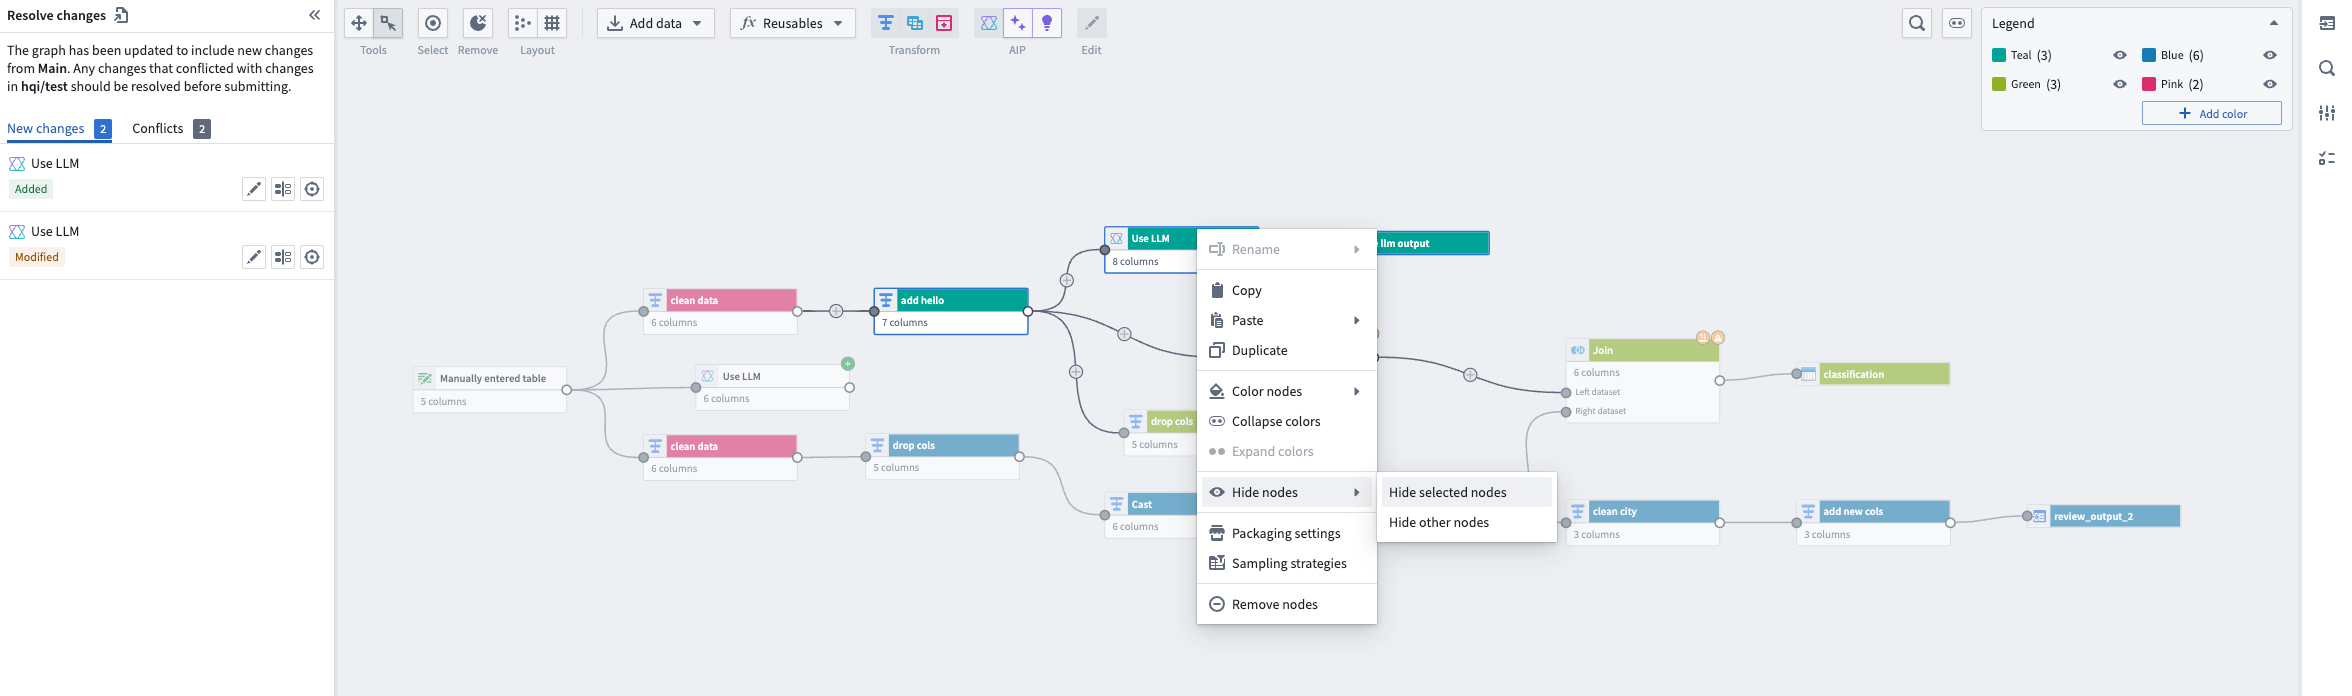
After you select the relevant nodes, right click and choose Hide nodes. This will give you the option to Hide selected nodes or Hide other nodes, which will hide all nodes that were not selected.
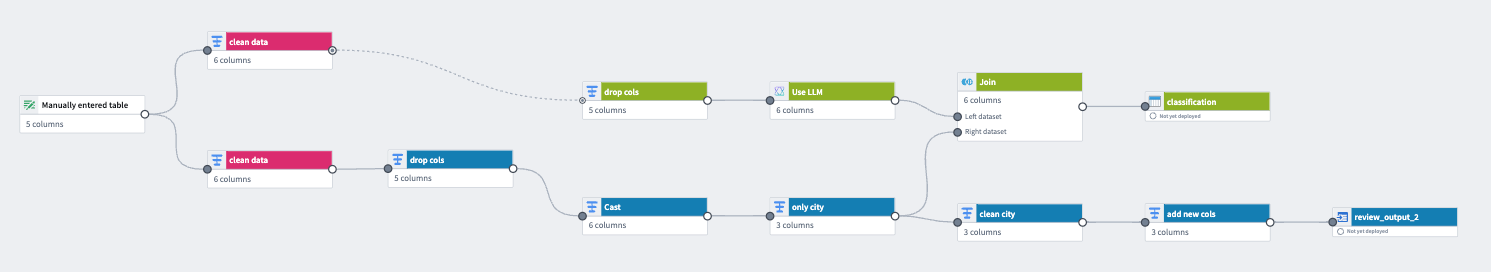
A dotted line appears between nodes that are connected by hidden nodes, and the connected circle icon changes from filled to partially filled to indicate hidden nodes as shown in the graph below:
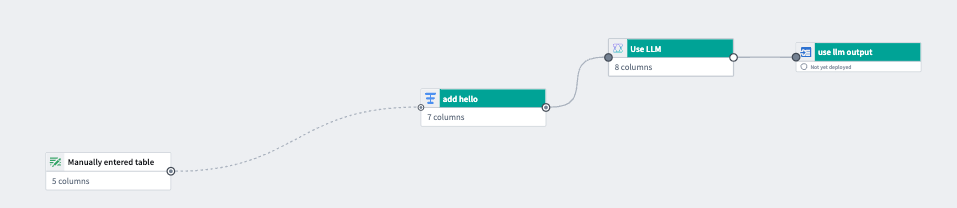
The graph below only shows teal nodes after all other nodes are hidden:
Show and hide color groups
You can hide a color group, or hide all other color groups to simplify the graph view. To hide a color group, go to the color Legend and select the eye icon next to your chosen color.
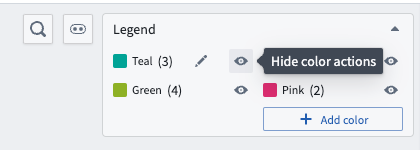
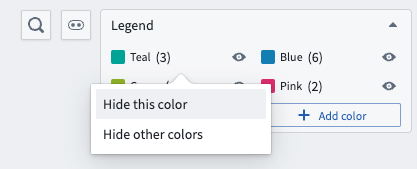
Choose Hide this color to only hide the selected color group, or Hide other colors to hide all other color groups.
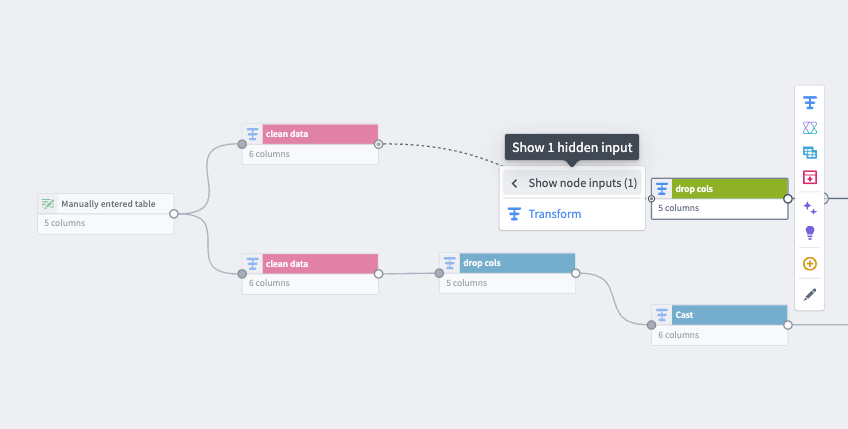
When a color group is hidden, a dotted line will appear between connected nodes to inform the user of hidden nodes. To see the number of hidden input nodes feeding into a node, select the left arrow followed by Show node inputs on a selected node. The number next to Show node inputs is the number of hidden inputs.
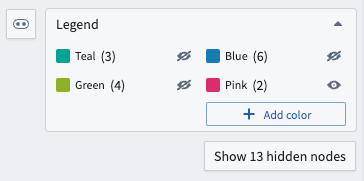
Select Show x hidden nodes under the Legend to show all hidden nodes. X is the total hidden node count. The color legend displays the number of nodes in each color group and whether it is hidden.
Show and hide nodes in other tabs
You can also show and hide nodes in the Proposals tab under Changes. Select the Legend to display color groups, and show or hide them using the same methods described above.
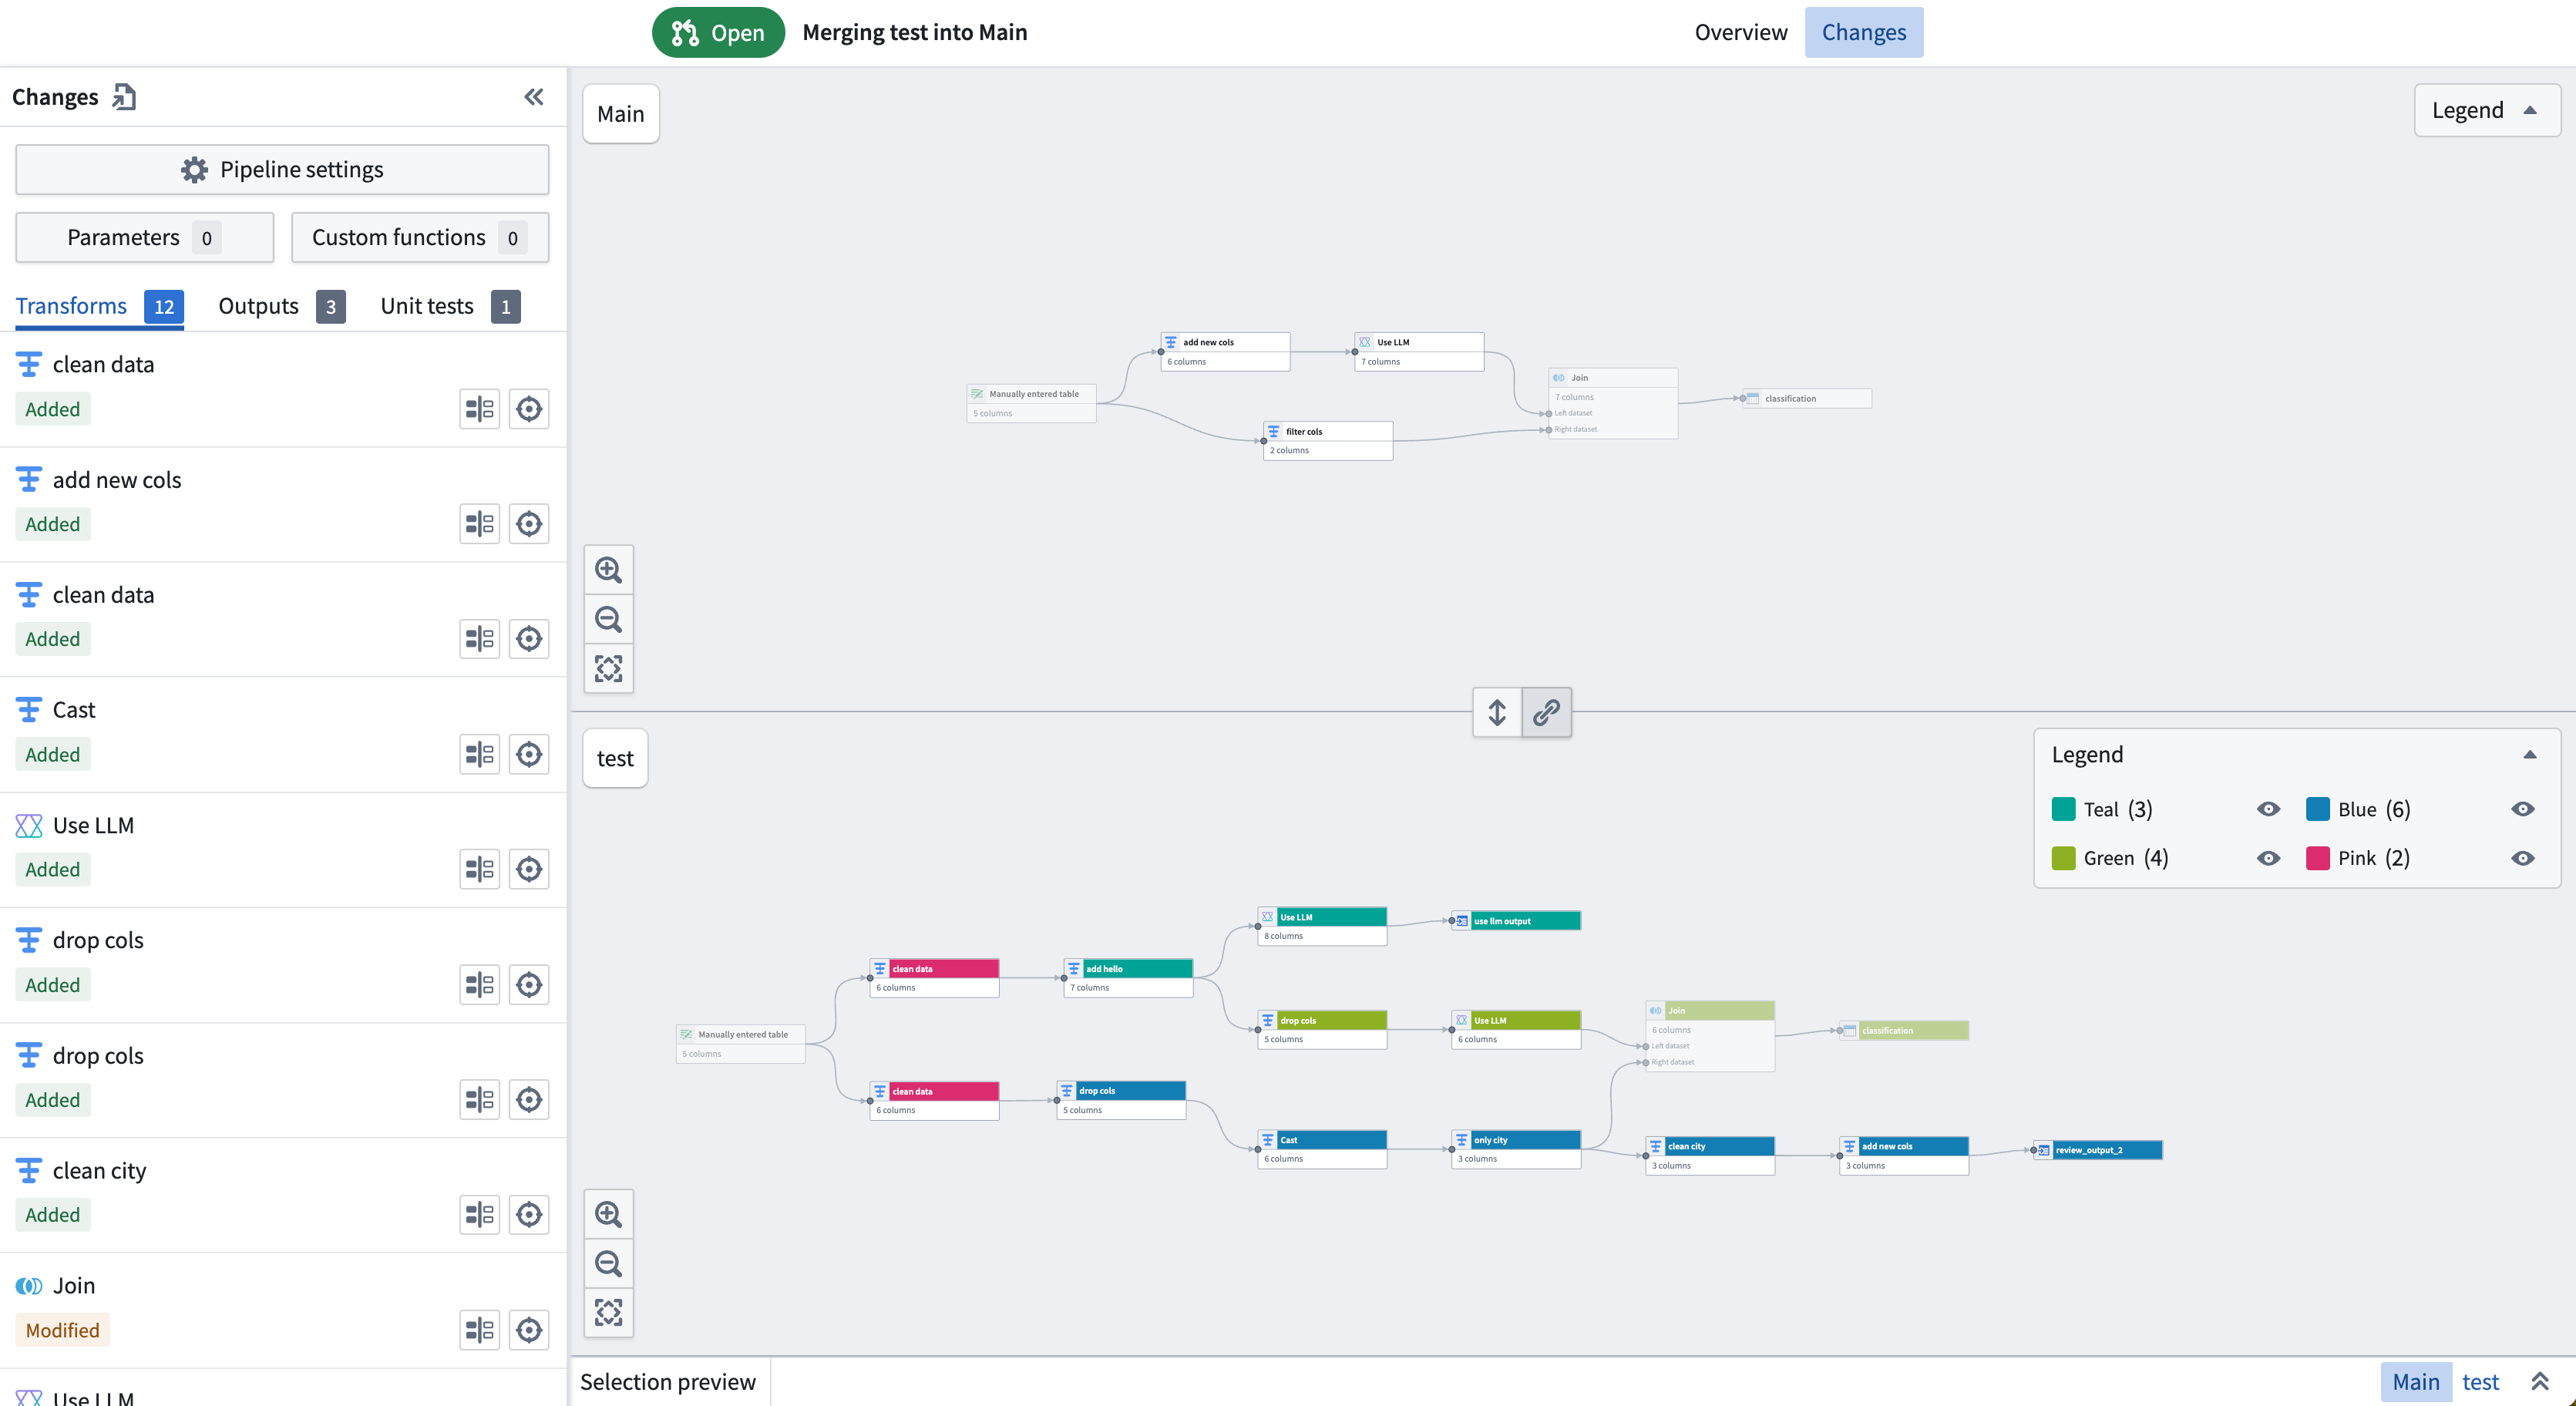
You can also show and hide nodes in the Resolve changes tab when there are merge conflicts.
中文翻译
显示和隐藏节点
为高效管理大型流水线,用户可通过显示和隐藏节点来聚焦流水线子部分。这有助于快速识别流水线段落,并优化导航与编辑体验。
在图形视图中手动选择节点,或使用左上角的区域选择图标进入拖拽选择模式。
选择相关节点后,右键单击并选择隐藏节点。此时可选择隐藏所选节点或隐藏其他节点,后者将隐藏所有未被选中的节点。
被隐藏节点连接的节点之间会出现虚线,连接圆点图标将从实心变为半实心,以指示隐藏节点,如下图所示:
下图展示了隐藏所有其他节点后仅显示青色节点的效果:
显示和隐藏颜色组
您可以隐藏某个颜色组,或隐藏所有其他颜色组以简化图形视图。要隐藏颜色组,请前往颜色图例,并选择目标颜色旁的图标。
选择隐藏此颜色仅隐藏所选颜色组,或选择隐藏其他颜色隐藏所有其他颜色组。
当颜色组被隐藏时,连接节点之间会出现虚线,提示用户存在隐藏节点。要查看输入到某个节点的隐藏输入节点数量,请选择该节点上的左箭头,然后选择显示节点输入。显示节点输入旁边的数字即为隐藏输入的数量。
在图例下方选择显示X个隐藏节点可显示所有隐藏节点。X为隐藏节点总数。颜色图例会显示每个颜色组中的节点数量及其是否被隐藏。
在其他选项卡中显示和隐藏节点
您还可以在更改下的提案选项卡中显示和隐藏节点。选择图例以显示颜色组,并使用上述相同方法进行显示或隐藏。
当存在合并冲突时,您也可以在解决更改选项卡中显示和隐藏节点。