Navigation(导航)
This page describes Pipeline Builder's interface, navigational controls, and available tools.
Users can access three different views in Pipeline Builder from the top toolbar: Edit, Proposals, and History.
Edit
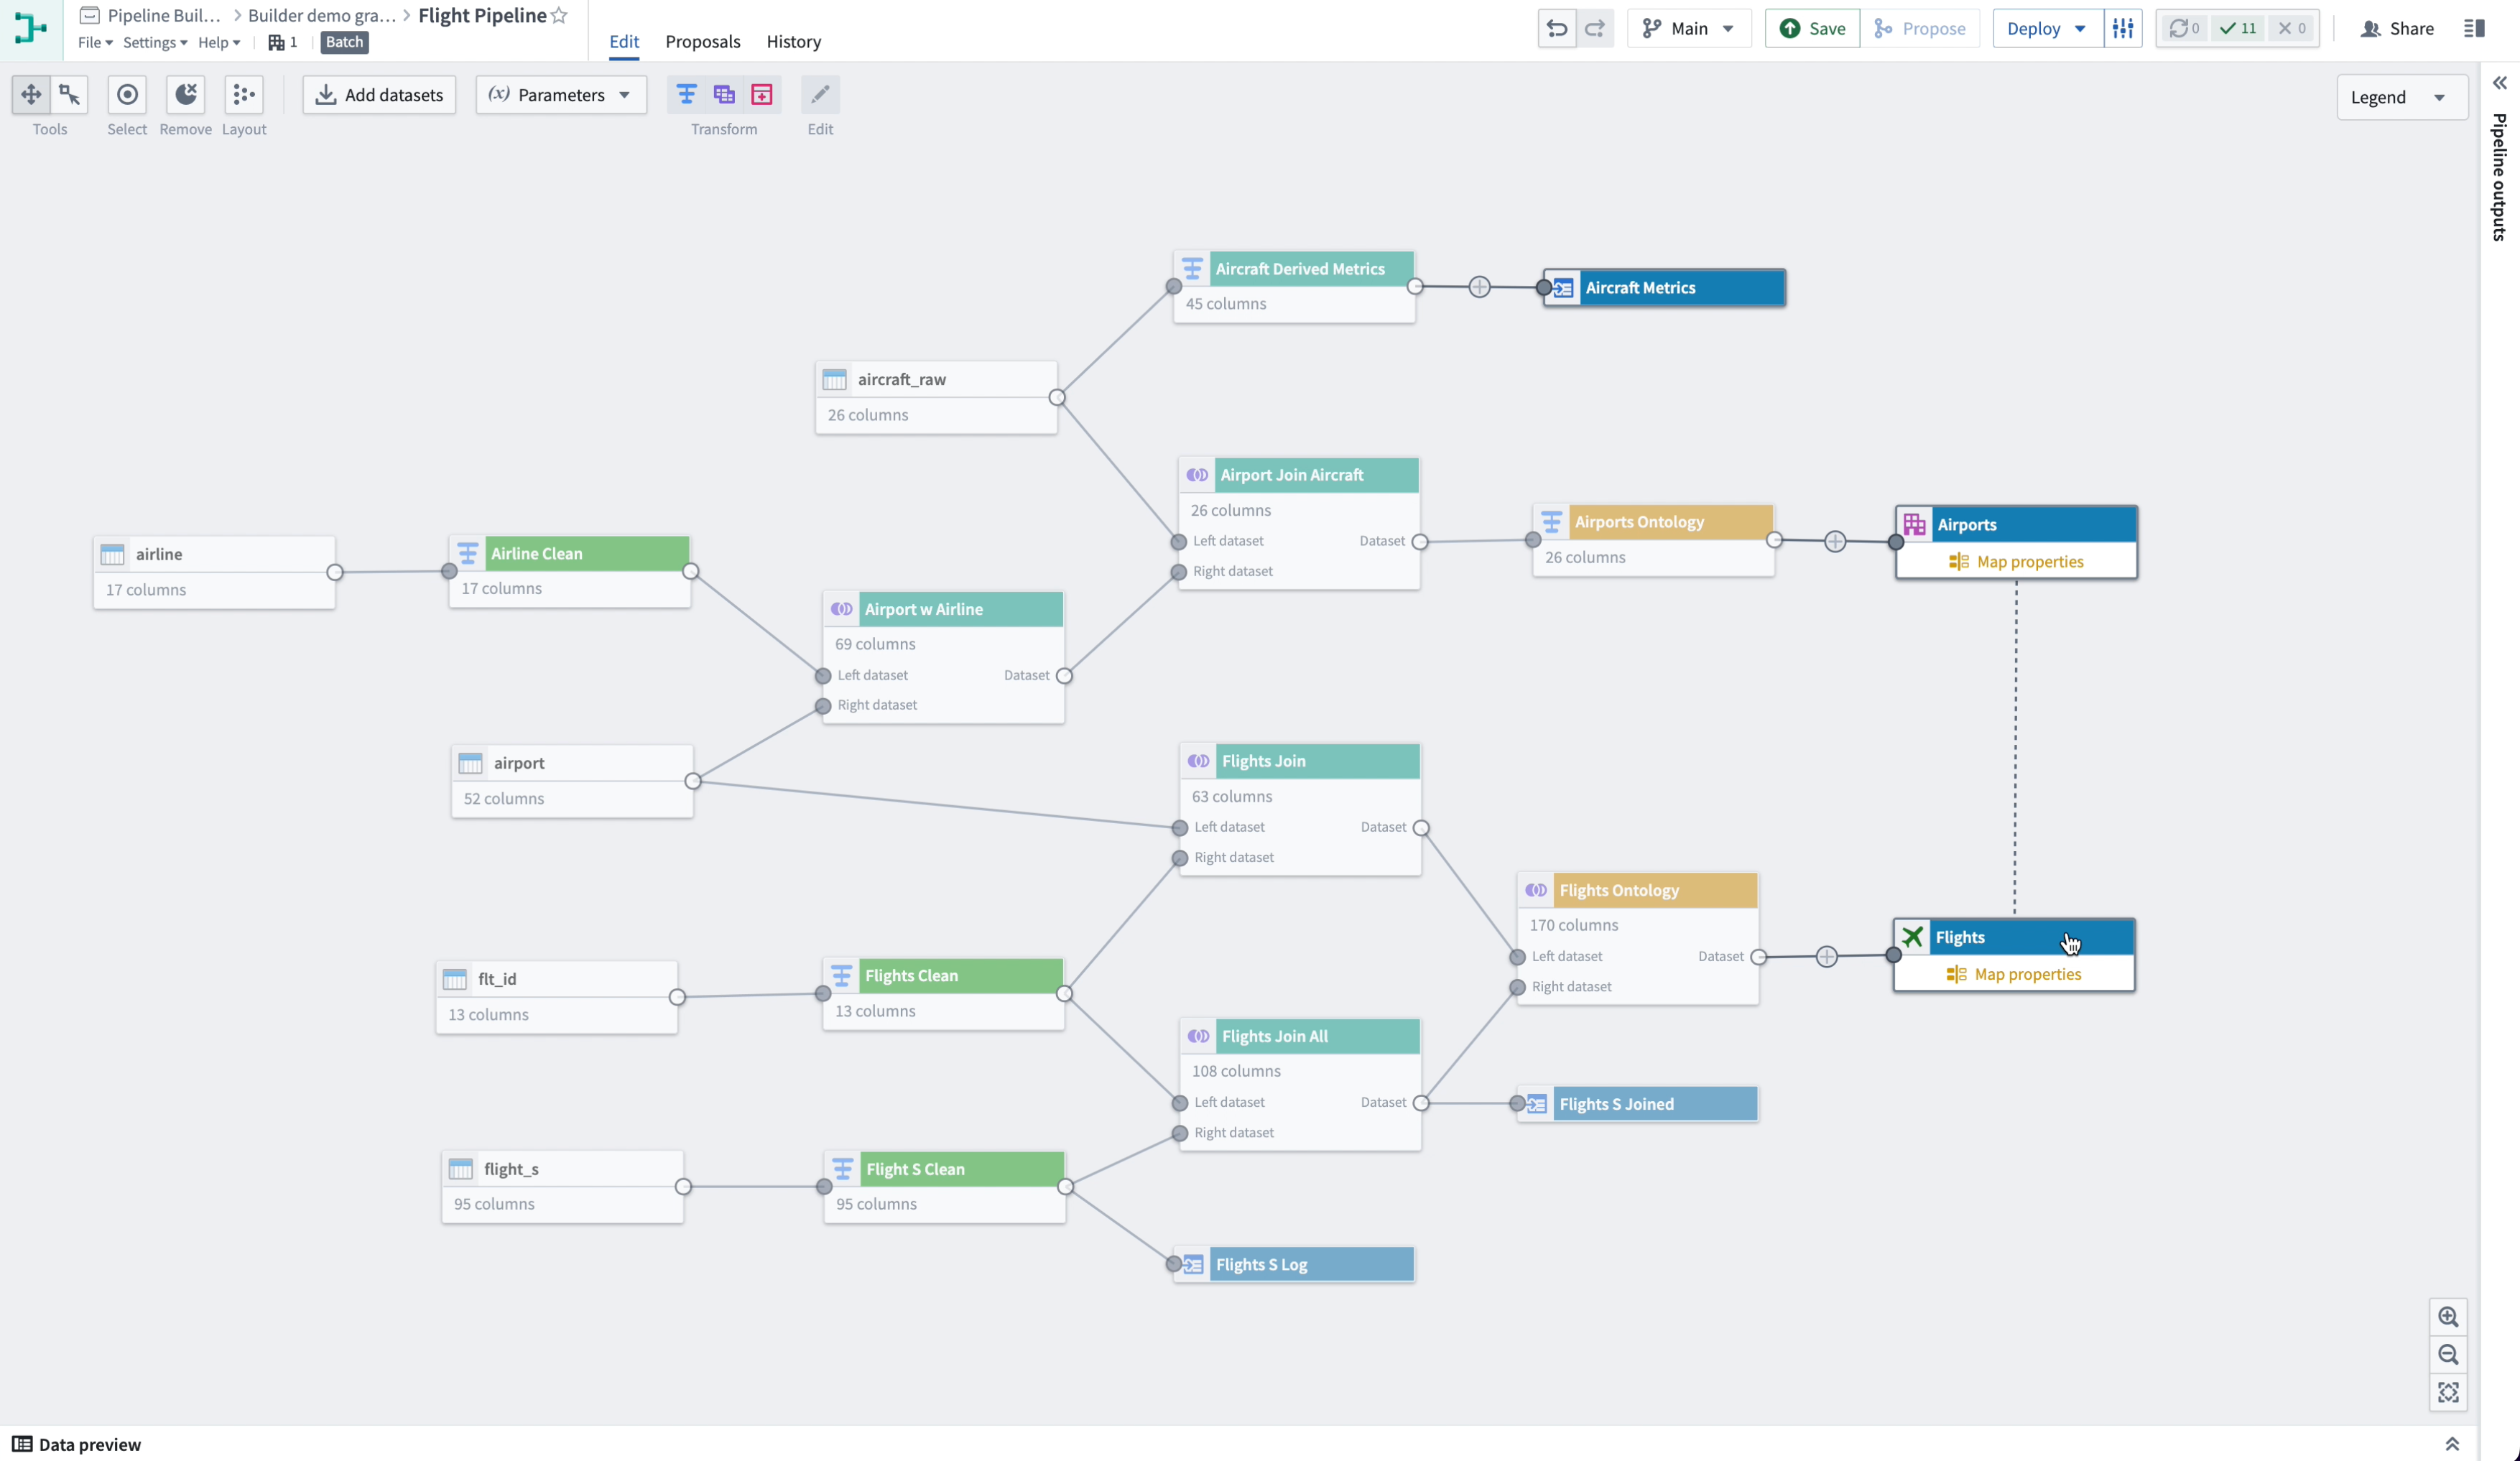
The Edit view is where you can start building your pipeline workflow. It is separated into four sections: the top toolbar, details sidebar, graph, and preview pane.
Top toolbar
The top toolbar allows you to manage your views, monitor build check status, and edit build settings.
- Undo/Redo: Undo or redo a recent action in your workflow.
- Branch dropdown: View the name of the branch in which you are currently working, or switch to another branch. You can also choose to Create new branch. Learn more about branches.
- Save: Save your progress. A filled Saved state appears when your changes are saved to your branch.
:::callout{theme="warning"} Changes to a pipeline branch are not auto-saved. To properly save changes to your pipeline branch, you must manually save your changes before navigating away from the graph tab. :::
-
Propose: Once your changes are saved, select Propose to request a merge into the main branch. Merges from the main branch are not supported.
-
Deploy: After the pipeline passes validation checks, select Deploy to build your pipeline outputs.
-
Build settings: Change the compute profile of your build.
-
Default: The default auto scaling profile which uses the least amount of executor cores and memory.
- Medium: A slow scale up and quick scale down compute.
-
Large: A slow scale up and quick scale down compute. Builds with larger profiles may complete faster but incur a higher compute cost.
-
Builds and checks status: View the status of build syncs and check passes and failures.
-
Share: Open the details sidebar to access sharing options for your pipeline.

Details sidebar
The details sidebar allows you to view metadata, access requirements, and roles for your pipeline. Click on the icon in the upper right corner to expand and collapse the sidebar.

-
Description: Write or edit a description of your pipeline.
-
Views: The total number of times your pipeline was viewed in the last 30 days.
-
Followers: The total number of users following your pipeline workflow progress. Click on this option to follow the pipeline you are currently viewing.
-
Comments: The total number of comments made on your pipeline workflow. Click on this option to post a comment.
-
Collaborators: The users collaborating on the pipeline. Click View to see when users were added as workflow collaborators.
-
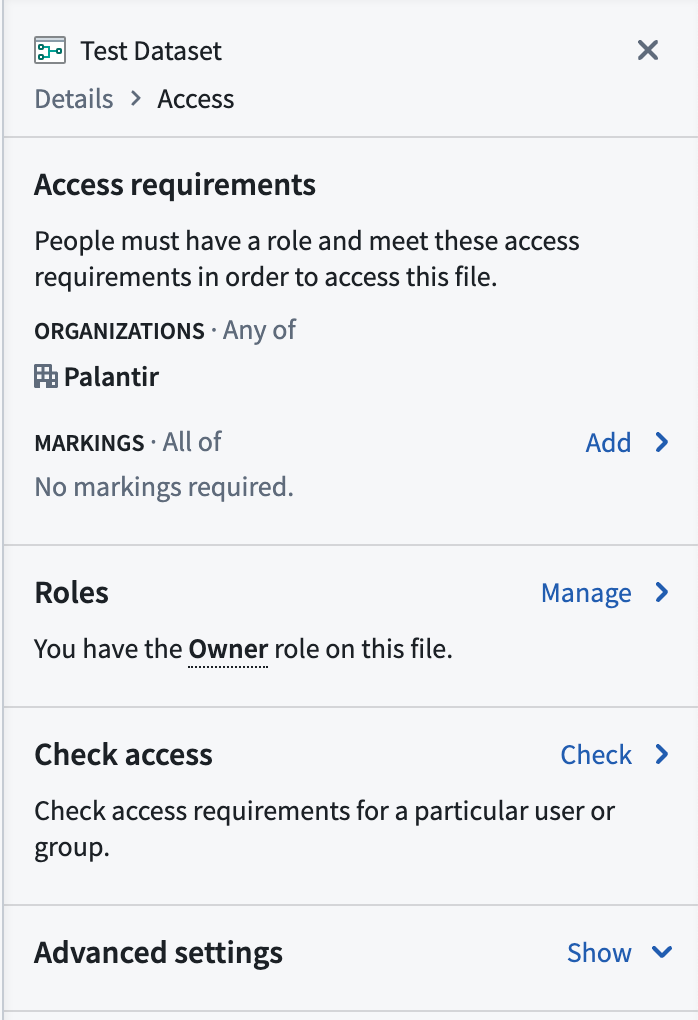
Access: Shows the organization(s) in which the pipeline belongs and the role you have on the pipeline file. Click View to view and manage access settings.
-
Access requirements: Displays the organization and Markings requirements needed to access the pipeline.
- Organizations: The organization(s) to which a user must belong to access the pipeline.
- Markings: The Markings to which a user must have access to access the pipeline.
- Add: Opens a pane to search for and add Markings requirements to the pipeline workflow.
- Roles: Shows the role you have on the pipeline.
- Manage: Opens a pane to manage roles and share the pipeline workflow.
- Link sharing: Toggle to turn on link sharing and grant roles to users who access the pipeline via a shareable link.
- Add a user or group: Search for a user or group to grant them access roles on the pipeline workflow.
-
Check access: Check access requirements for a particular user or group.
- Check: Opens a pane to search for and check access for a user or group.
- Check access: Use the search field to find a user or group.
- Select a user or group: Check whether users meet access requirements, and view their assigned role on the pipeline workflow.
- Select a user or group: Check whether users meet access requirements, and view their assigned role on the pipeline workflow.
-
Misc: Shows additional metadata for the pipeline.
- Location: The location of the pipeline in the Foundry file structure.
- Modified: The date and time the pipeline was last modified.
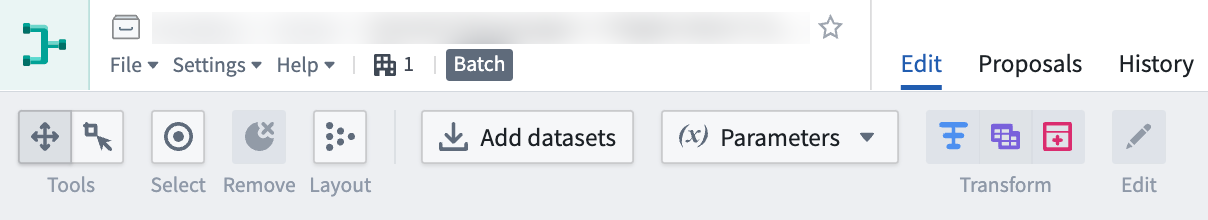
Graph
The graph is where users add data, create parameters, and describe transforms. It is the primary view of the Pipeline Builder app.
-
Panning Mode: Allows click and drag navigation around the graph.
-
Drag Select Mode: Click and drag across the graph to select multiple nodes. To quickly switch to this mode from panning mode, hold down
shiftwhile clicking and dragging across nodes. -
Select: Select all nodes in the graph.
-
Remove: Removes selected nodes in the graph from the pipeline.
-
Layout: Evenly disperse and organize the nodes in your graph.
-
Add datasets: Open a window to search for and add datasets to your graph.
-
Parameters: Configure and add reusable transform parameters.
-
Add parameter: Name a new parameter and assign its value.
-
Transform: Select dataset nodes in your graph to transform, join, or union. Selecting a dataset on the graph also opens a pop-up menu allowing you to add or edit a transform.
-
Edit: Select a transform node in your graph to edit transform settings.

-
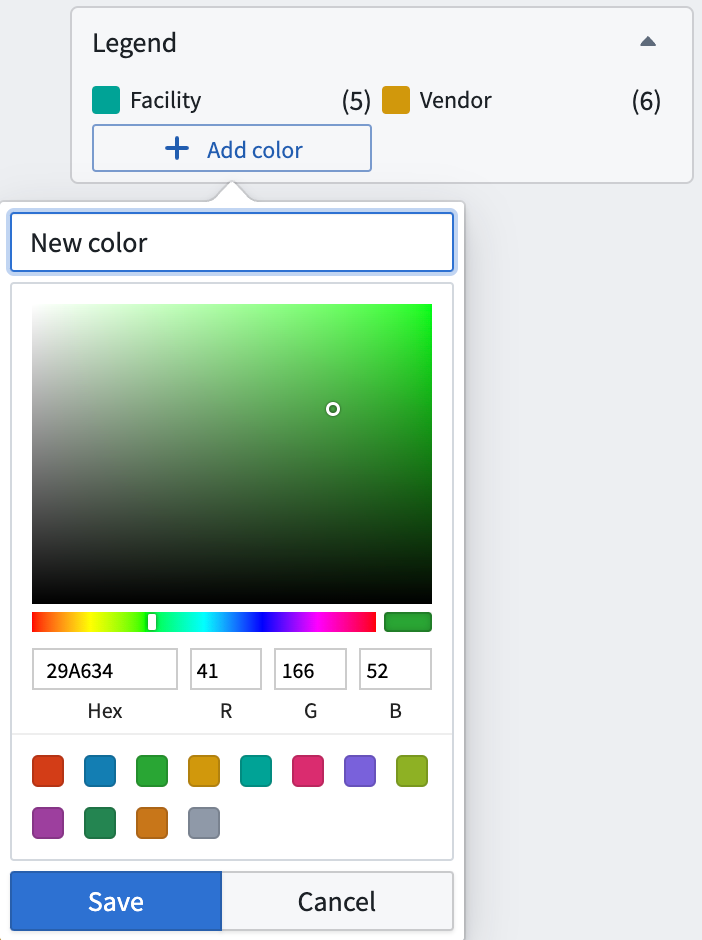
Legend: Show color indicators applied to datasets and transforms.
-
Add color: Select a new color from the color picker to assign to nodes in your graph.
-
Outputs sidebar: In the sidebar, view build requirements of your pipeline datasets, edit schemas, and add outputs. Use the "expand" symbol on the far right side of the Builder graph to expand the outputs sidebar.
-
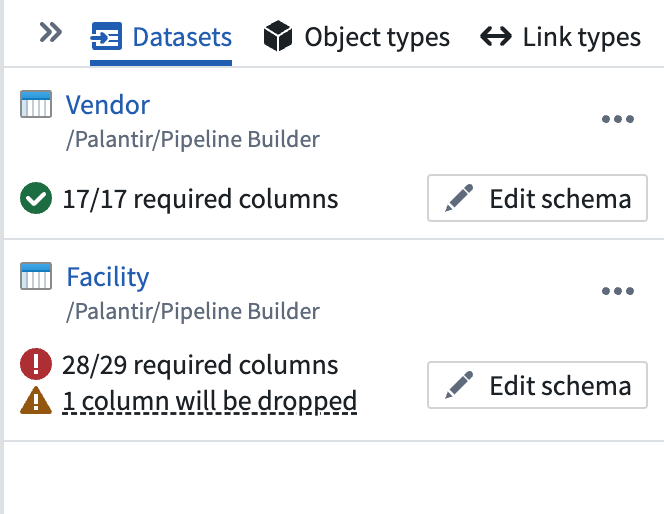
Datasets: Show the dataset outputs described in your pipeline, health verifications, and any schema errors.
- Edit schema: Identify schema errors, remove or add columns, and use input schema to resolve errors.
- Delete dataset output: Remove the selected dataset output from your pipeline.
- Add output: Create a new dataset output for your pipeline build.
- Object types: Show the object type outputs that guide your pipeline integration.
- Add output: Open a window to create a new object type output, generate an object type from a dataset schema, or add an existing object type.
-
Link types: Show the link type outputs that guide your pipeline integration.
- Add output: Open a pane to create an object link from two object types.
-
Zoom settings: Choose to zoom in, zoom out, or zoom to fit your graph.
-
Copying Nodes: You can copy and paste nodes between Pipeline Builder deployments and within the same resource using
Cmd + CandCmd + Von MacOS orCtrl + CandCtrl + Von Windows. This can be used to duplicate parts of the pipeline or pipelines as a whole.
Preview panel
The preview panel allows you to view a sample set of data from a single selected node. Select the icon in the lower left of the graph to expand or contract the preview panel.
- Name: Show the name for the selected node. You can edit the node name in this field.
- Search: Search for column names within the data.
You can also access the full dataset preview page by right-clicking on a dataset node and clicking Open.
Proposals
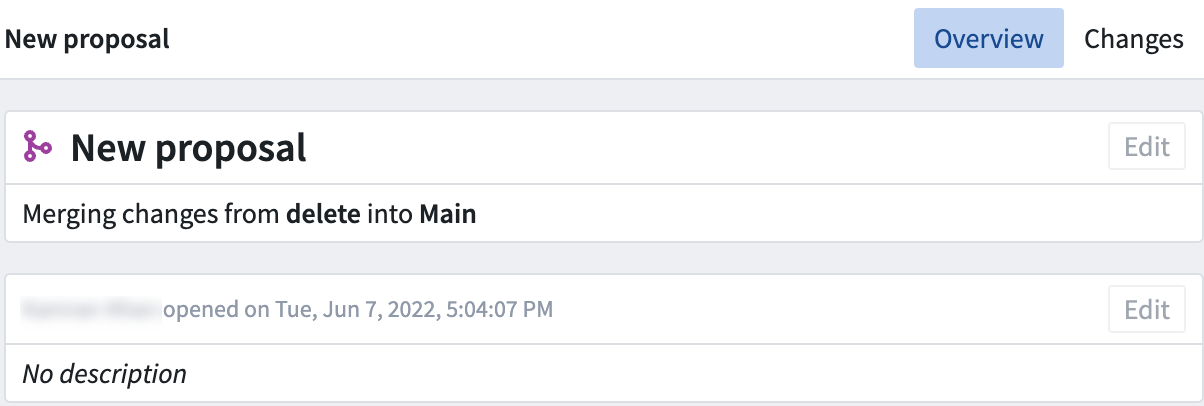
In the Proposal view, you can see any open, merged, or closed proposals for this pipeline. Choose a filter from the dropdown menu to see all proposals within the status category.
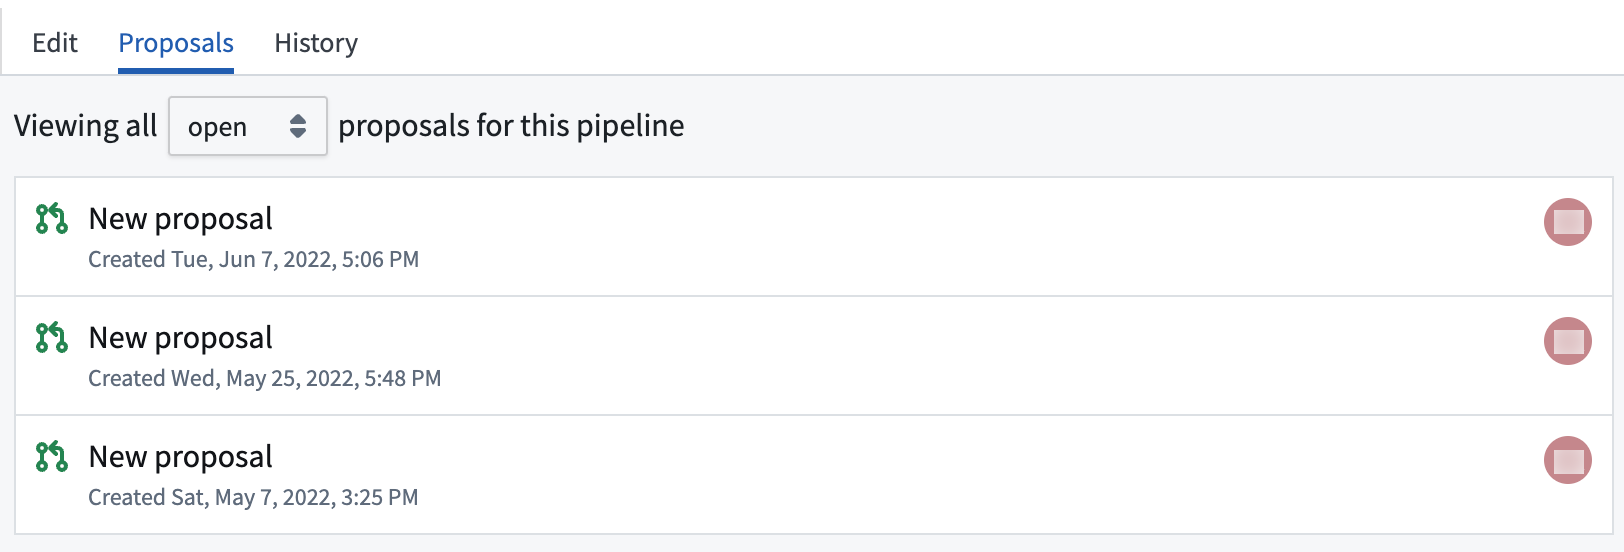
Each proposal will show a create date and time, the user who created it, and an icon denoting an open, merged, or closed status.
History
The History view allows you to see recent activity in any branch of your pipeline workflow. Select a branch from the dropdown to view its history.
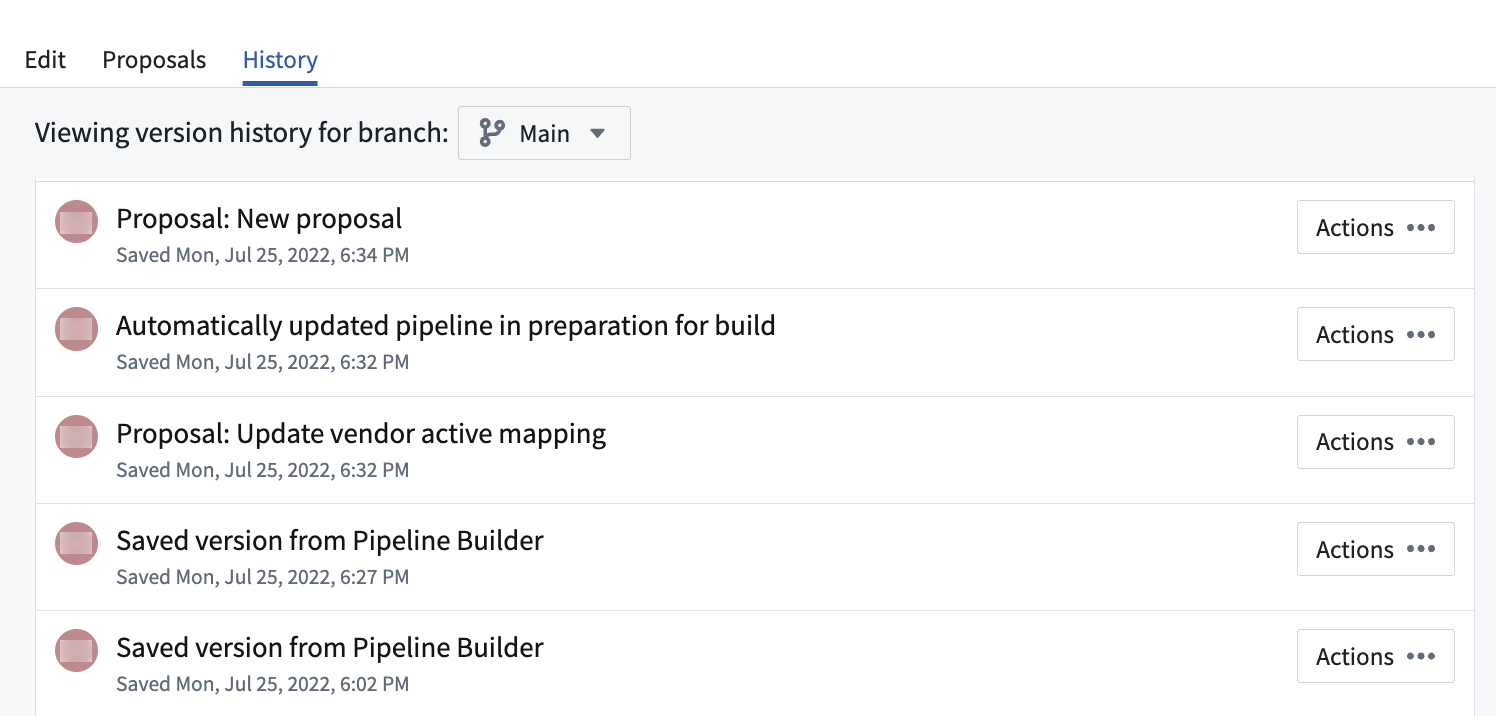
Click Actions to create a new branch, view details, or view changes made from each saved version.
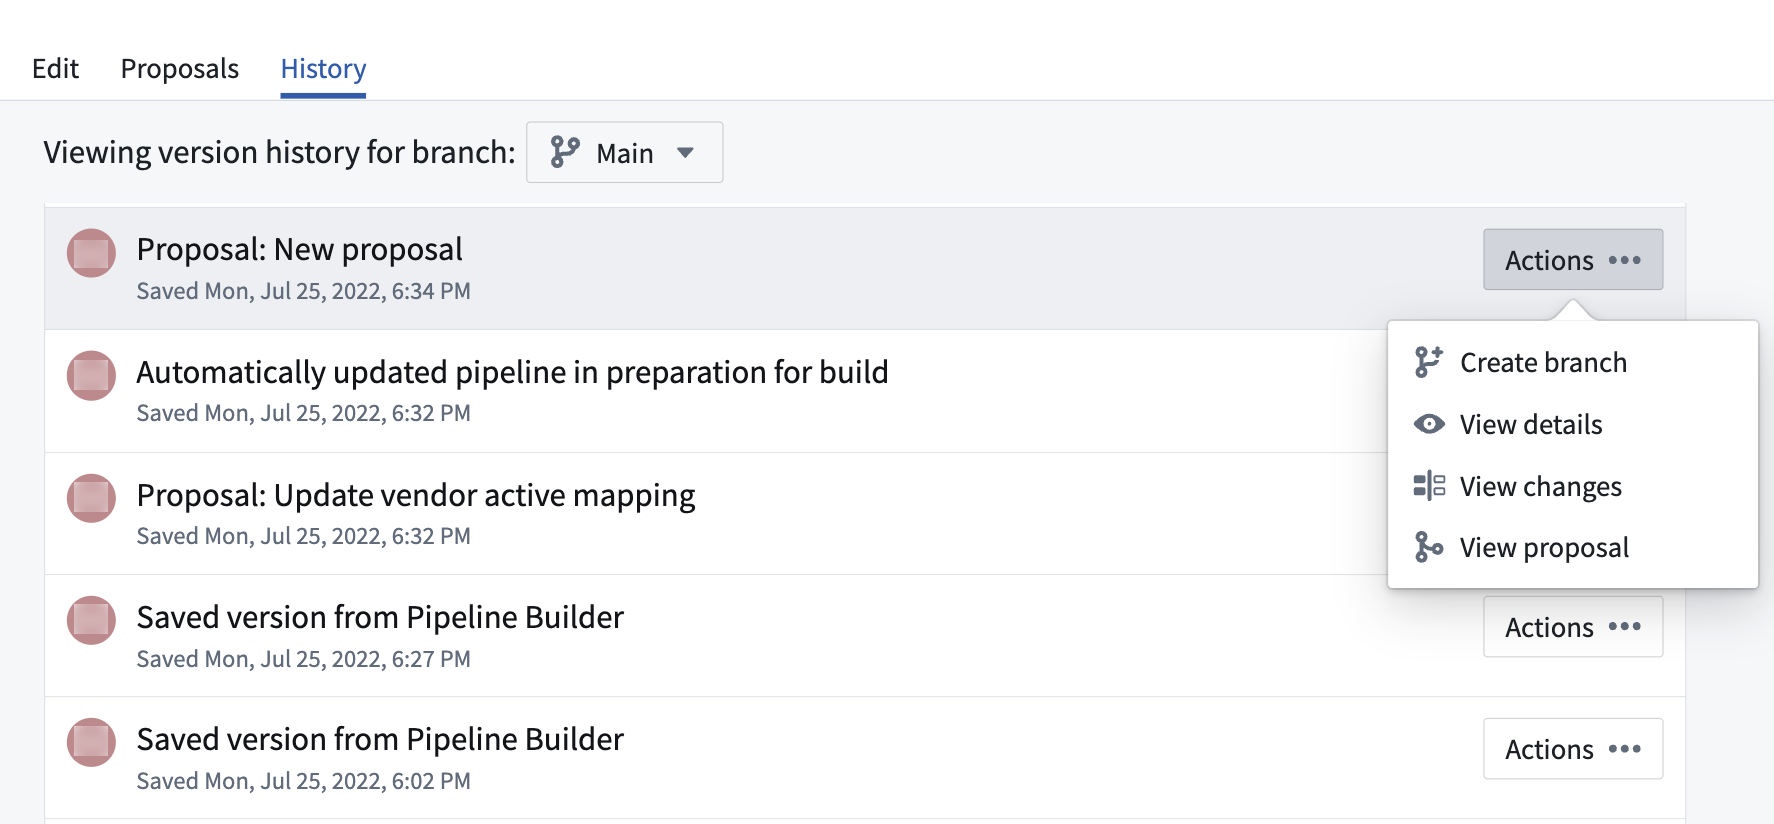
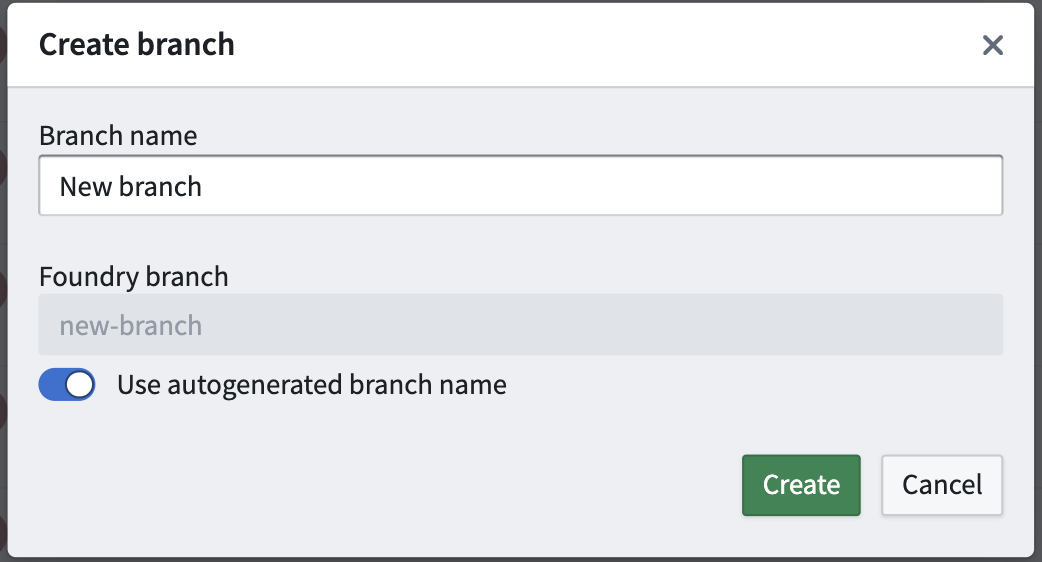
Create branch
This option allows to you to start a new branch based off the selected branch.
View details
The View details option opens a read-only version of the graph that shows the state of the pipeline at the time of the saved activity. This option is a useful way to track workflow development over time without risking a revert to earlier states of the pipeline.

View changes
Similar to the View details option, you can View changes to understand pipeline modifications at a given time. In this view, however, the graph shows a split view to represent the differences, or diffs, between the previous save and the applied changes.
View proposal
Viewing a proposal allows builders to review and edit existing proposals.
Learn more about viewing pipeline changes.
中文翻译
导航
本文介绍 Pipeline Builder 的界面、导航控件和可用工具。
用户可以通过顶部工具栏访问 Pipeline Builder 中的三种不同视图:编辑(Edit)、提案(Proposals)和历史(History)。
编辑(Edit)
编辑视图是您开始构建管道工作流的地方。它分为四个部分:顶部工具栏、详情侧边栏、图形和预览面板。
顶部工具栏
顶部工具栏允许您管理视图、监控构建检查状态以及编辑构建设置。
- 撤销/重做(Undo/Redo): 撤销或重做工作流中的最近操作。
- 分支下拉菜单(Branch dropdown): 查看当前工作所在的分支名称,或切换到其他分支。您也可以选择创建新分支(Create new branch)。了解更多关于分支的信息。
- 保存(Save): 保存您的进度。当更改保存到分支后,会出现填充状态的已保存(Saved) 标识。
:::callout{theme="warning"} 管道分支的更改不会自动保存。要正确保存对管道分支的更改,您必须在离开图形选项卡前手动保存更改。 :::
-
提议(Propose): 保存更改后,选择提议(Propose) 以请求合并到主分支。不支持从主分支进行合并。
-
部署(Deploy): 管道通过验证检查后,选择部署(Deploy) 以构建管道输出。
-
构建设置(Build settings): 更改构建的计算配置文件。
-
默认(Default): 默认的自动缩放配置文件,使用最少的执行器核心和内存。
- 中等(Medium): 慢速扩展和快速缩减的计算配置。
-
大型(Large): 慢速扩展和快速缩减的计算配置。使用较大配置文件的构建可能完成得更快,但会产生更高的计算成本。
-
构建与检查状态(Builds and checks status): 查看构建同步状态以及检查通过和失败的情况。
-
分享(Share): 打开详情侧边栏以访问管道的分享选项。
详情侧边栏(Details sidebar)
详情侧边栏允许您查看管道的元数据、访问要求和角色。点击右上角的图标可展开和折叠侧边栏。
-
描述(Description): 编写或编辑管道的描述。
-
浏览量(Views): 过去30天内管道的总查看次数。
-
关注者(Followers): 关注您管道工作流进度的用户总数。点击此选项可关注您当前正在查看的管道。
-
评论(Comments): 对管道工作流发表的总评论数。点击此选项可发表评论。
-
协作者(Collaborators): 协作处理管道的用户。点击查看(View) 可查看用户何时被添加为工作流协作者。
-
访问权限(Access): 显示管道所属的组织以及您在管道文件上的角色。点击查看(View) 可查看和管理访问设置。
-
访问要求(Access requirements): 显示访问管道所需的组织和标记(Markings)要求。
- 组织(Organizations): 用户必须所属才能访问管道的组织。
- 标记(Markings): 用户必须拥有访问权限才能访问管道的标记。
- 添加(Add): 打开一个面板,用于搜索并向管道工作流添加标记要求。
- 角色(Roles): 显示您在管道上的角色。
- 管理(Manage): 打开一个面板,用于管理角色和分享管道工作流。
- 链接分享(Link sharing): 切换以开启链接分享,并授予通过可分享链接访问管道的用户角色。
- 添加用户或组(Add a user or group): 搜索用户或组,授予他们对管道工作流的访问角色。
-
检查访问权限(Check access): 检查特定用户或组的访问要求。
- 检查(Check): 打开一个面板,用于搜索和检查用户或组的访问权限。
- 检查访问权限(Check access): 使用搜索字段查找用户或组。
- 选择用户或组(Select a user or group): 检查用户是否满足访问要求,并查看他们在管道工作流上的分配角色。
- 选择用户或组(Select a user or group): 检查用户是否满足访问要求,并查看他们在管道工作流上的分配角色。
-
其他(Misc): 显示管道的其他元数据。
- 位置(Location): 管道在 Foundry 文件结构中的位置。
- 修改时间(Modified): 管道最后修改的日期和时间。
图形(Graph)
图形是用户添加数据、创建参数和描述转换(transforms)的地方。它是 Pipeline Builder 应用的主要视图。
-
平移模式(Panning Mode): 允许通过点击和拖拽在图形中导航。
-
拖拽选择模式(Drag Select Mode): 在图形上点击并拖拽以选择多个节点。要从此模式快速切换到平移模式,请在点击并拖拽节点时按住
shift键。 -
全选(Select): 选择图形中的所有节点。
-
移除(Remove): 从管道中移除图形中选中的节点。
-
布局(Layout): 均匀分布并组织图形中的节点。
-
添加数据集(Add datasets): 打开一个窗口,用于搜索并向图形添加数据集。
-
参数(Parameters): 配置和添加可重用的转换参数。
-
添加参数(Add parameter): 命名新参数并为其赋值。
-
转换(Transform): 选择图形中的数据集节点以进行转换、连接(join)或合并(union)。在图形上选择数据集也会打开一个弹出菜单,允许您添加或编辑转换。
-
编辑(Edit): 选择图形中的转换节点以编辑转换设置。
-
图例(Legend): 显示应用于数据集和转换的颜色指示器。
-
添加颜色(Add color): 从颜色选择器中选择新颜色,以分配给图形中的节点。
-
输出侧边栏(Outputs sidebar): 在侧边栏中,查看管道数据集的构建要求、编辑模式(schemas)和添加输出。使用 Builder 图形最右侧的"展开"符号可展开输出侧边栏。
-
数据集(Datasets): 显示管道中描述的数据集输出、健康验证以及任何模式错误。
- 编辑模式(Edit schema): 识别模式错误,移除或添加列,并使用输入模式解决错误。
- 删除数据集输出(Delete dataset output): 从管道中移除选中的数据集输出。
- 添加输出(Add output): 为管道构建创建新的数据集输出。
- 对象类型(Object types): 显示指导管道集成的对象类型输出。
- 添加输出(Add output): 打开一个窗口,用于创建新的对象类型输出、从数据集模式生成对象类型或添加现有对象类型。
-
链接类型(Link types): 显示指导管道集成的链接类型输出。
- 添加输出(Add output): 打开一个面板,用于从两个对象类型创建对象链接。
-
缩放设置(Zoom settings): 选择放大、缩小或缩放以适应图形。
-
复制节点(Copying Nodes): 您可以使用 MacOS 上的
Cmd + C和Cmd + V或 Windows 上的Ctrl + C和Ctrl + V在 Pipeline Builder 部署之间以及同一资源内复制和粘贴节点。这可用于复制管道的部分或整个管道。
预览面板(Preview panel)
预览面板允许您查看单个选中节点的数据样本。选择图形左下角的图标可展开或收缩预览面板。
- 名称(Name): 显示选中节点的名称。您可以在此字段中编辑节点名称。
- 搜索(Search): 在数据中搜索列名。
您还可以通过右键单击数据集节点并点击打开(Open) 来访问完整的数据集预览页面。
提案(Proposals)
在提案视图中,您可以查看此管道的所有开放、已合并或已关闭的提案。从下拉菜单中选择一个筛选条件,以查看该状态类别中的所有提案。
每个提案将显示创建日期和时间、创建用户,以及表示开放、已合并或已关闭状态的图标。
历史(History)
历史视图允许您查看管道工作流任何分支中的最近活动。从下拉菜单中选择一个分支以查看其历史记录。
点击操作(Actions) 可创建新分支、查看详情或查看每个已保存版本所做的更改。
创建分支(Create branch)
此选项允许您基于选中的分支创建一个新分支。
查看详情(View details)
查看详情(View details) 选项会打开一个只读版本的图形,显示保存活动时管道的状态。此选项是跟踪工作流随时间发展的有用方式,而无需承担恢复到管道早期状态的风险。
查看更改(View changes)
与查看详情(View details) 选项类似,您可以通过查看更改(View changes) 来了解特定时间点的管道修改。然而,在此视图中,图形会显示一个拆分视图,以表示先前保存与所应用更改之间的差异(diffs)。
查看提案(View proposal)
查看提案允许构建者审查和编辑现有提案。
了解更多关于查看管道更改的信息。