Preview pipeline(预览管道)
The preview panel allows you to preview logic and column statistics for a single selected node in your pipeline. When you select a node, this will open the preview panel and run the logic from raw datasets up until the selected node.
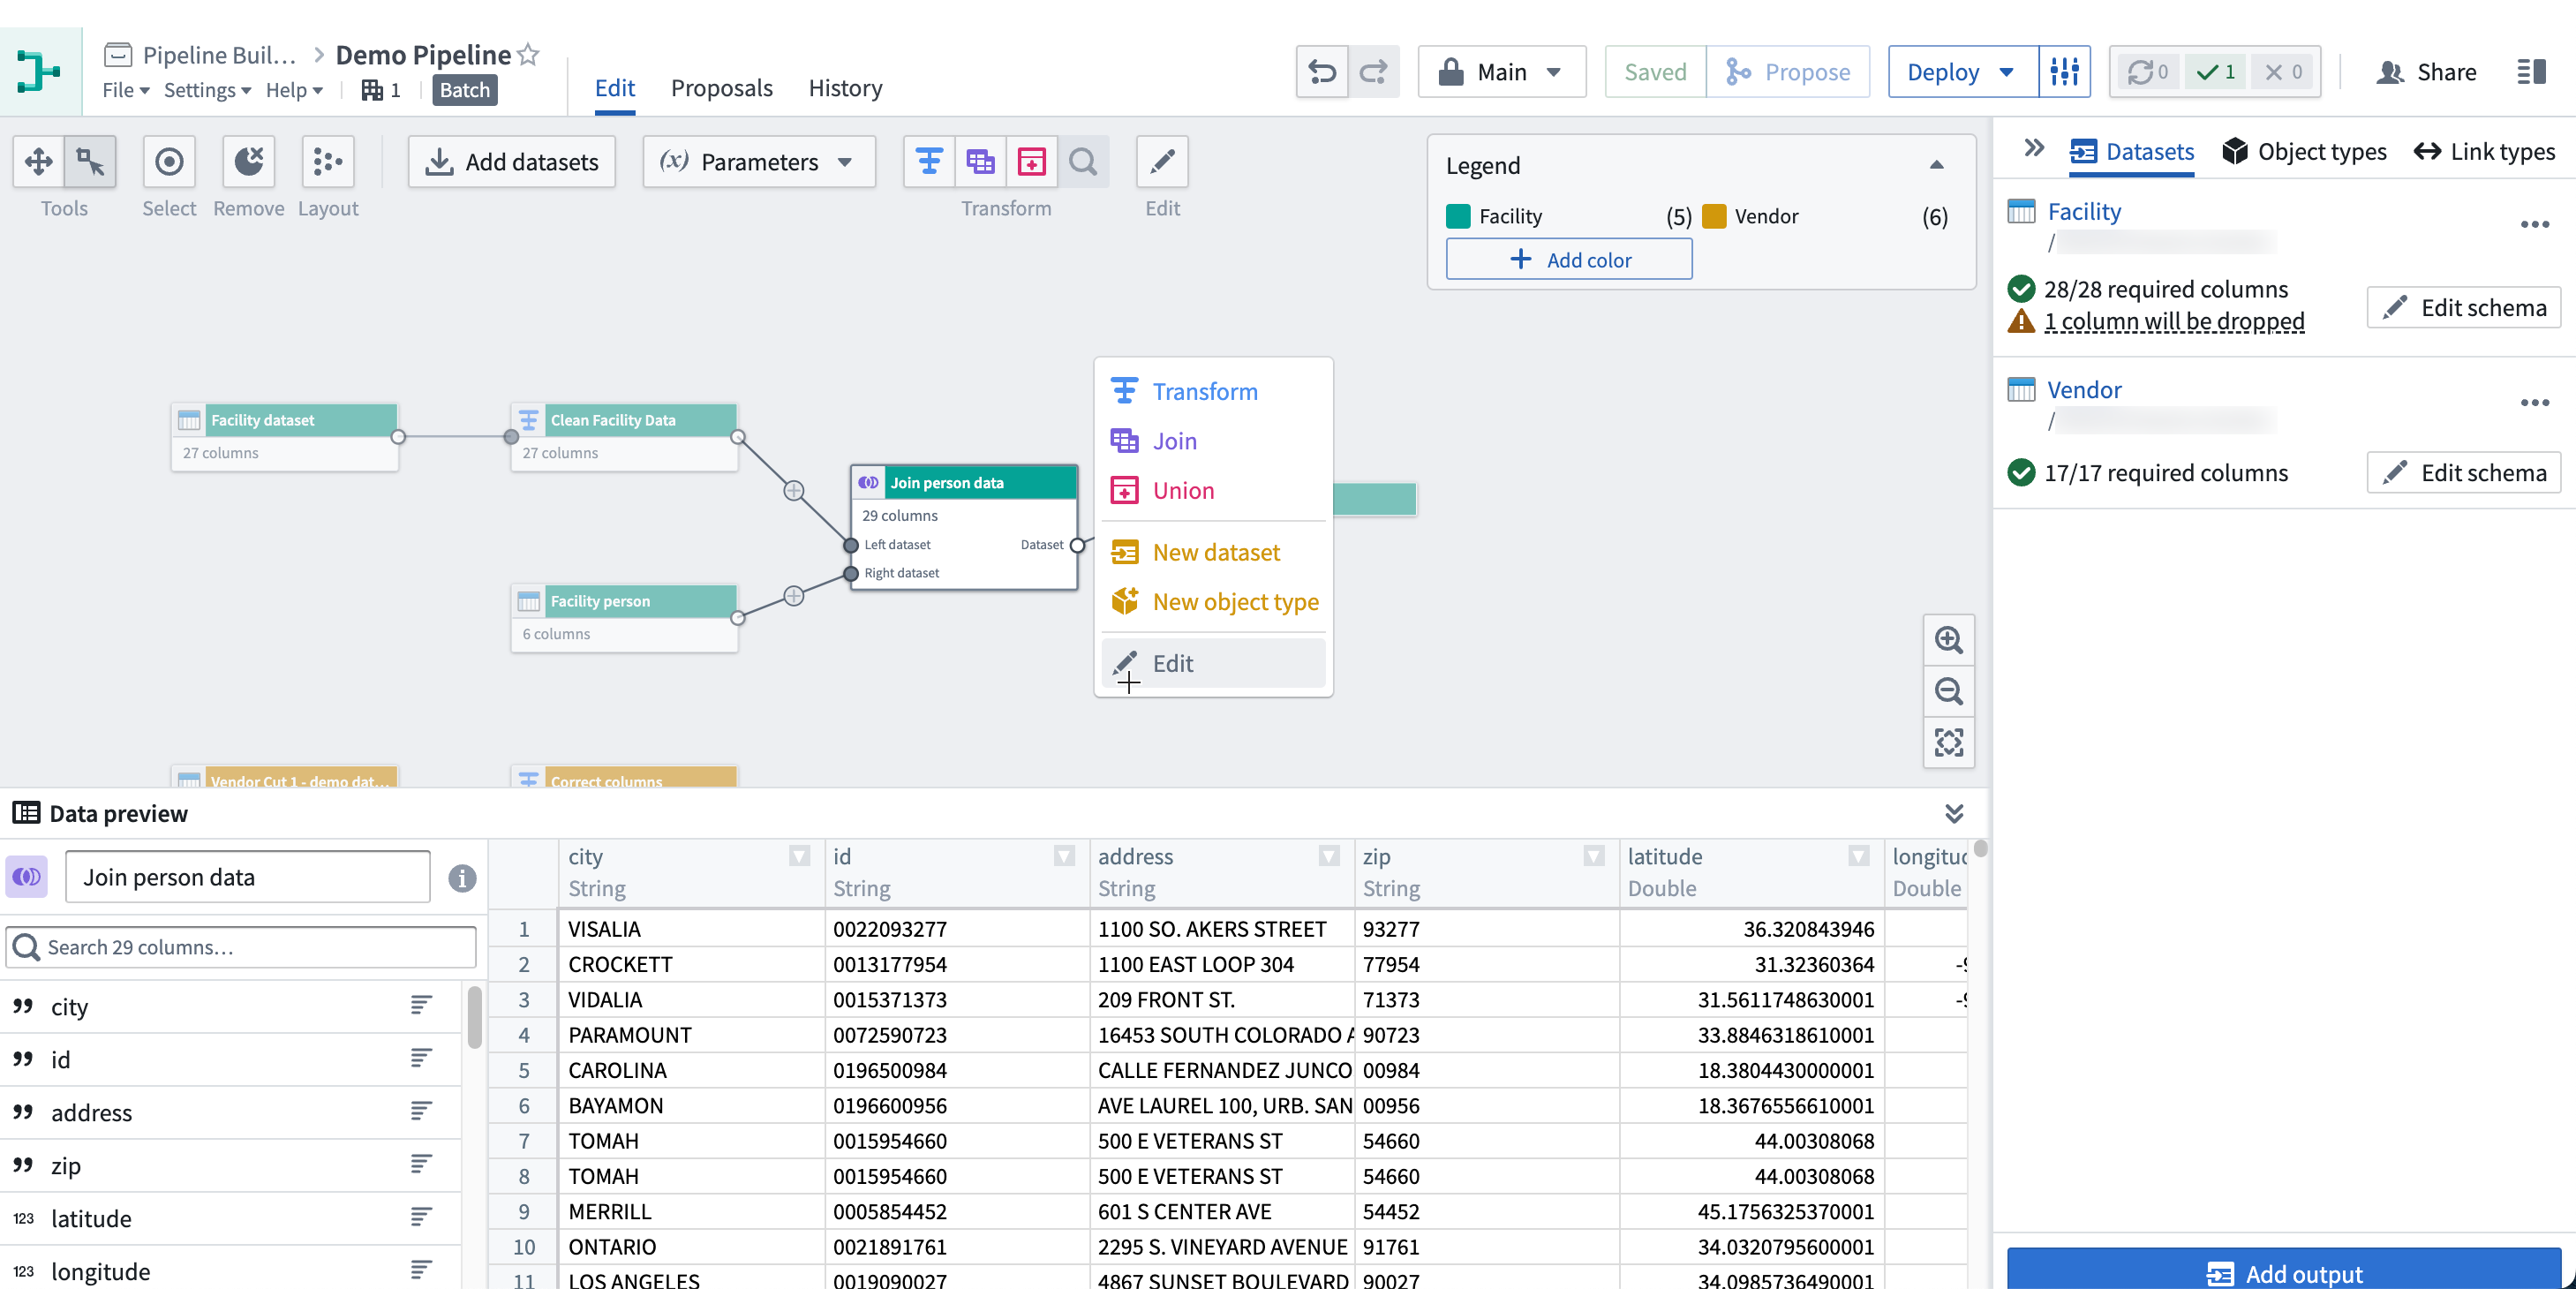
You can also expand the preview panel by clicking on the icon in the bottom right of the graph. Then, click on a node to preview data.

To view statistics, right-click on a column and click View stats.
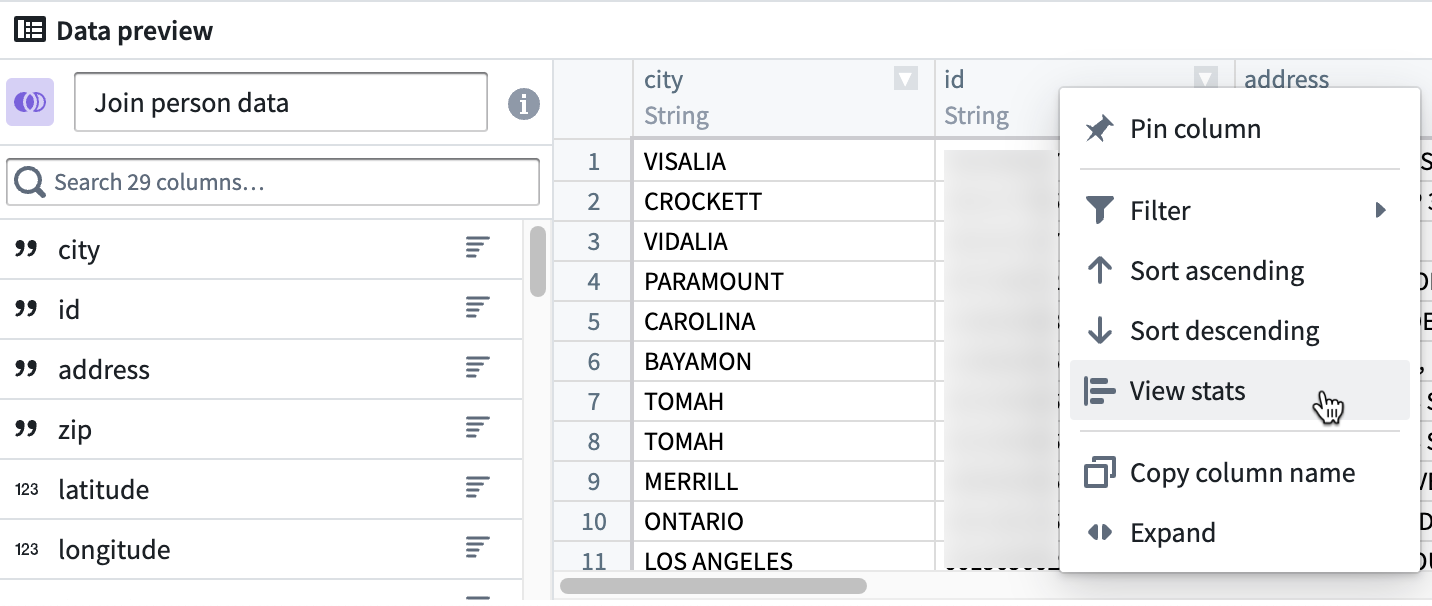
For string columns, the statistics view includes histograms of values and value lengths and counts of string casing, whitespace, and null instances. For numeric columns, a distribution of values is displayed along with basic statistics such as min, max, mean, standard deviation, and number of distinct values.
To view the row count, select Calculate row count in the bottom right of the preview panel.
Configuring Preview Behavior
By default, previews will run automatically. However, administrators can set a default preview behavior at the enrollment level, and users can override this by setting their own preview preferences in their user preferences or pipeline settings.
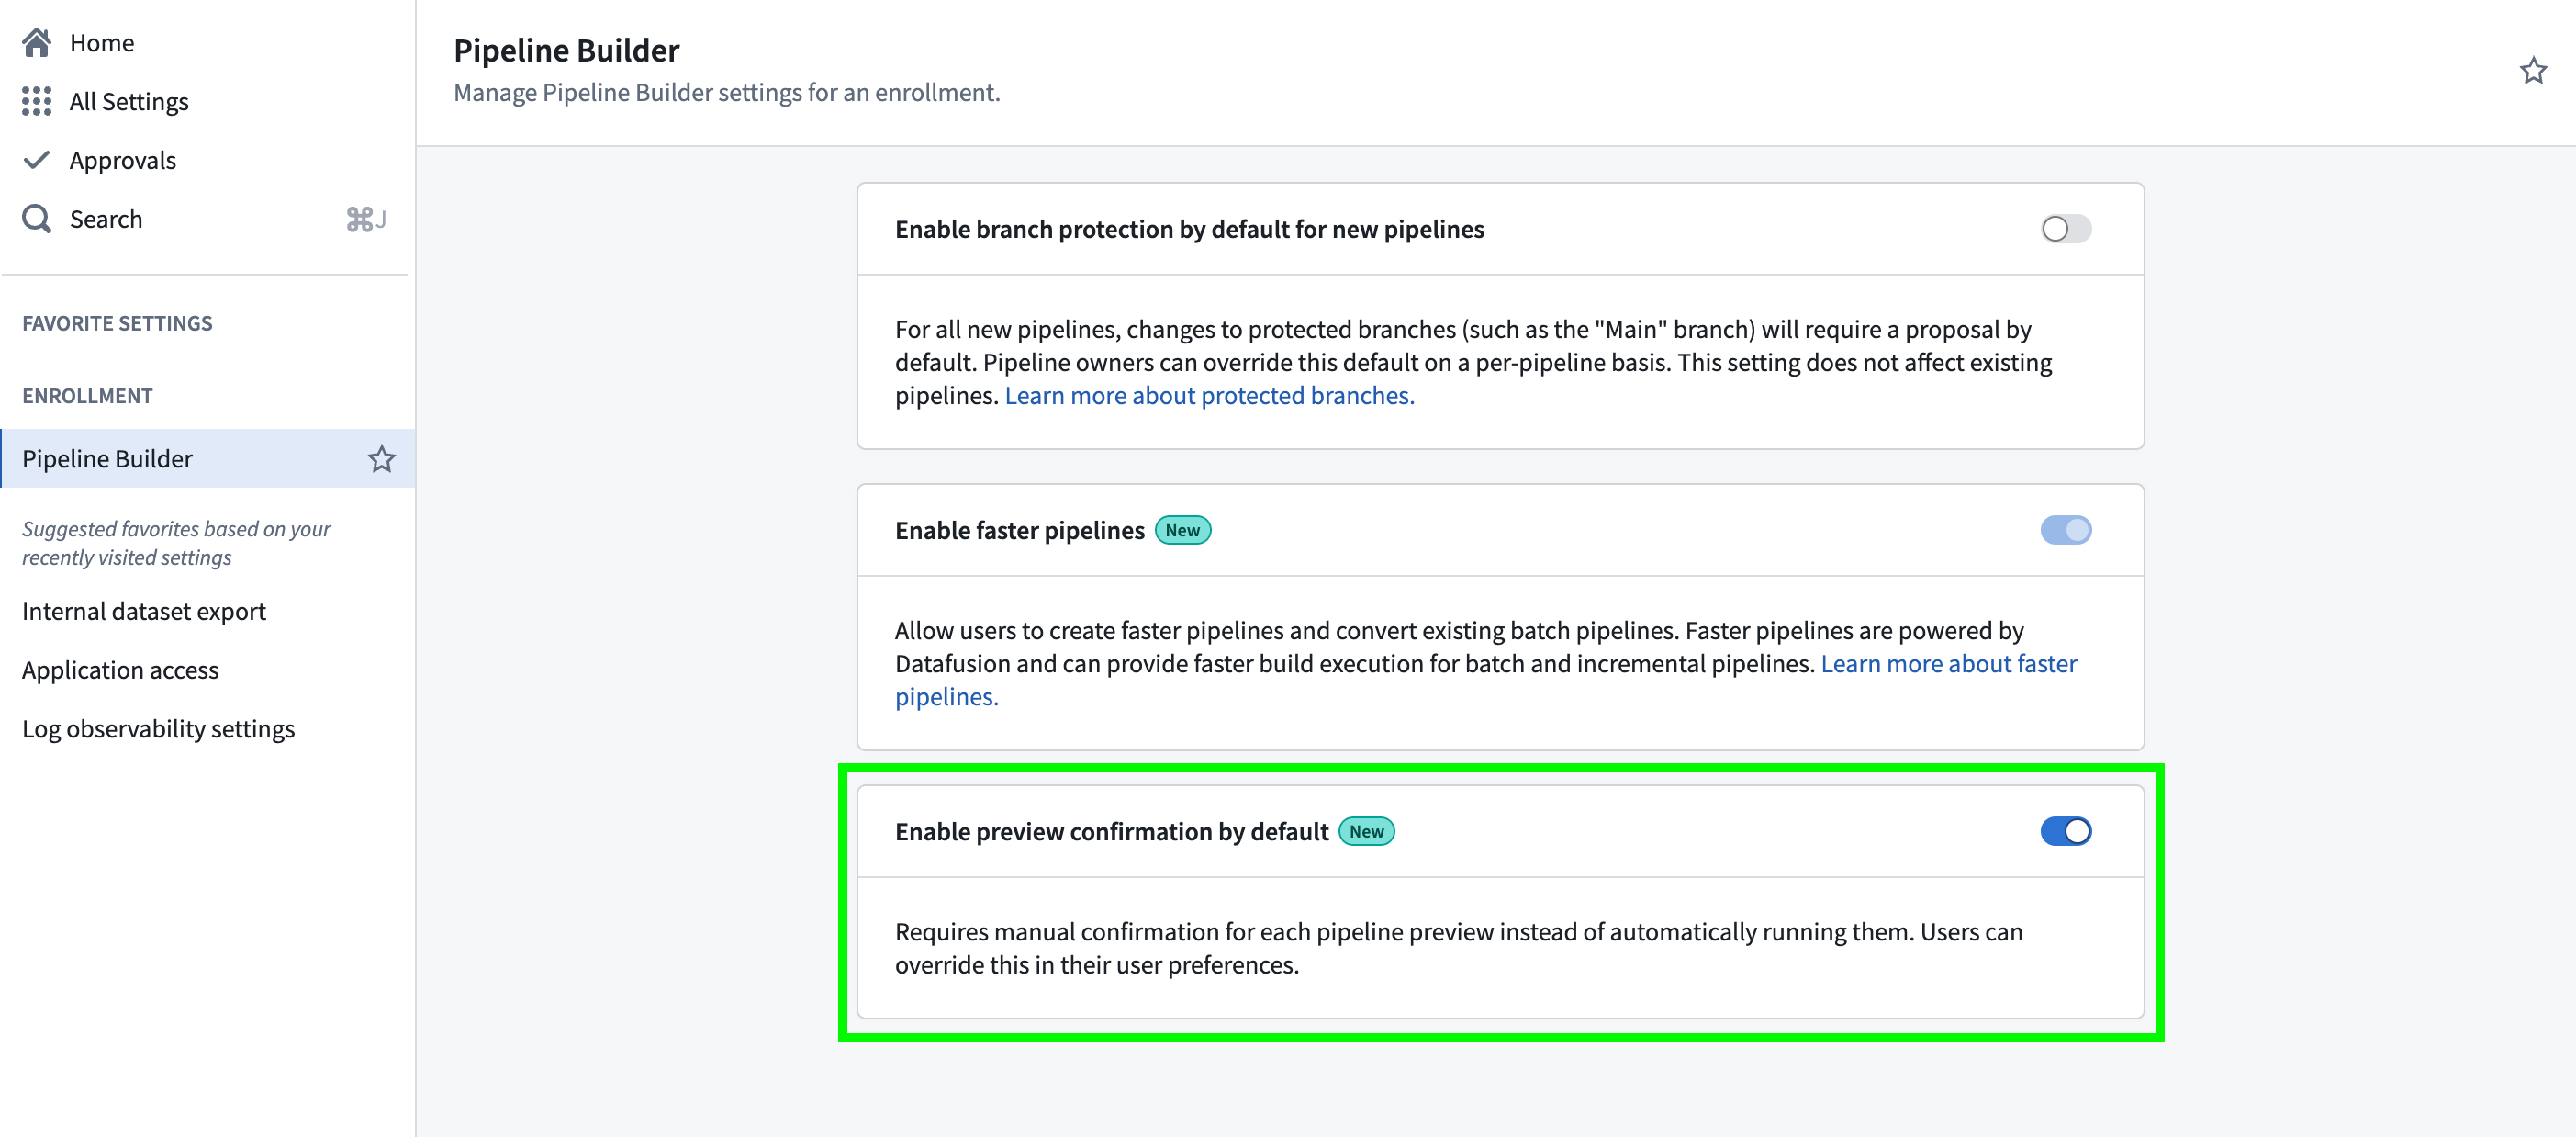
To set a default preview behavior at the enrollment level:
- Go to Control Panel.
- Navigate to Pipeline Builder.
- Toggle on Enable preview confirmation by default if you want users to manually confirm each time a preview is run.
:::callout{theme="warning"} If a user has any preview setting set in Pipeline Builder, this will override the enrollment-level setting. :::
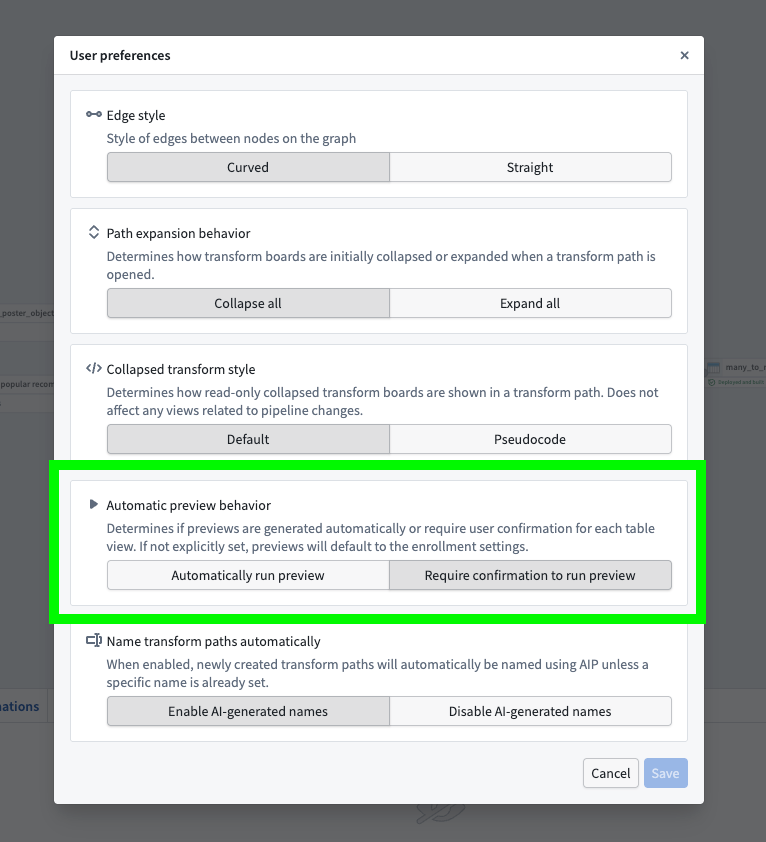
In the Pipeline Builder application, each user can set their own preview preference which will take precedent over the enrollment-level setting. To do this, open Pipeline Builder and:
- Go to Settings and then User preferences.
- Under Automatic preview behavior, choose between allowing all your pipelines to Automatically run preview or Require confirmation to run preview.
This only changes the setting at the user level, so all pipelines you view within that enrollment will follow your selected preference.
Preview row counts
By default, Pipeline Builder will process up to 500 rows in the preview table. This implementation may only require 500 input rows in the dataset, but many operations such as Filter, Joins and Drop Duplicates can require additional rows to produce a preview of 500 rows.
To speed up previews, add an input sampling strategy to limit the number of input rows available for computing previews. Input sampling strategies only affect previews and have no effect on builds.
Row count and statistic calculations are run across the sampled input. This means that if the full dataset is used, the row count and stats will match a full build; however, if a sample strategy is set to only use part of the input dataset, the row counts and stats will only be computed across this sample.
As an example, suppose we have an input dataset with 600 rows:
| id | value |
|---|---|
| 1 | row_1 |
| 2 | row_2 |
| ... | ... |
| 600 | row_600 |
Our preview will be limited to 500 rows. Note that these might not necessarily be the first 500 rows of the input.
| id | value |
|---|---|
| 1 | row_1 |
| 2 | row_2 |
| ... | ... |
| 500 | row_500 |
After setting an input strategy of a small percentage, the input will be limited to a small sample that can speed up preview compute. Suppose we are left with just six rows in our preview:
| id | value |
|---|---|
| 1 | row_1 |
| 12 | row_12 |
| 33 | row_33 |
| 62 | row_62 |
| 126 | row_126 |
| 527 | row_527 |
If we then use a transform to add a constant column hello with value world, the preview will show the transform computed for our six sampled rows:
| id | value | hello |
|---|---|---|
| 1 | row_1 | world |
| 12 | row_12 | world |
| 33 | row_33 | world |
| 62 | row_62 | world |
| 126 | row_126 | world |
| 527 | row_527 | world |
Computing the row count will return six rows, and any stats will be computed across only these six rows.
When we finally build our pipeline, the sampling strategy will have no affect, and our transform will be computed across the full 600 input rows.
中文翻译
预览管道
预览面板允许您预览管道中单个选定节点的逻辑和列统计信息。当您选择一个节点时,将打开预览面板,并从原始数据集开始运行逻辑,直到选定的节点。
您还可以通过点击图表右下角的图标来展开预览面板。然后,点击一个节点以预览数据。
要查看统计信息,请右键点击某一列,然后选择 查看统计信息(View stats)。
对于字符串列,统计信息视图包括值和值长度的直方图,以及字符串大小写、空白和空实例的计数。对于数值列,会显示值的分布以及基本统计信息,例如最小值、最大值、平均值、标准差和不同值的数量。
要查看行数,请在预览面板右下角选择 计算行数(Calculate row count)。
配置预览行为
默认情况下,预览会自动运行。但是,管理员可以在注册级别设置默认预览行为,用户可以通过在其用户偏好设置或管道设置中设置自己的预览偏好来覆盖此设置。
要在注册级别设置默认预览行为:
- 前往 控制面板(Control Panel)。
- 导航至 管道构建器(Pipeline Builder)。
- 如果您希望用户每次运行预览时手动确认,请开启 默认启用预览确认(Enable preview confirmation by default)。
:::callout{theme="warning"} 如果用户在管道构建器中设置了任何预览设置,这将覆盖注册级别的设置。 :::
在管道构建器应用程序中,每个用户都可以设置自己的预览偏好,该偏好将优先于注册级别的设置。为此,请打开管道构建器并:
- 前往 设置(Settings),然后选择 用户偏好(User preferences)。
- 在 自动预览行为(Automatic preview behavior) 下,选择允许您的所有管道 自动运行预览(Automatically run preview) 或 需要确认才能运行预览(Require confirmation to run preview)。
这仅更改用户级别的设置,因此您在该注册中查看的所有管道都将遵循您选择的偏好。
预览行数
默认情况下,管道构建器将在预览表中处理最多 500 行。此实现可能只需要数据集中的 500 个输入行,但许多操作(例如 筛选(Filter)、连接(Joins) 和 删除重复项(Drop Duplicates))可能需要额外的行才能生成 500 行的预览。
为了加快预览速度,请添加输入采样策略,以限制可用于计算预览的输入行数。输入采样策略仅影响预览,对构建没有影响。
行数和统计信息计算是在采样输入上运行的。这意味着如果使用完整数据集,行数和统计信息将与完整构建匹配;但是,如果采样策略设置为仅使用部分输入数据集,则行数和统计信息将仅在此样本上计算。
例如,假设我们有一个包含 600 行的输入数据集:
| id | value |
|---|---|
| 1 | row_1 |
| 2 | row_2 |
| ... | ... |
| 600 | row_600 |
我们的预览将被限制为 500 行。请注意,这些行不一定是输入的前 500 行。
| id | value |
|---|---|
| 1 | row_1 |
| 2 | row_2 |
| ... | ... |
| 500 | row_500 |
在设置了一个小百分比的输入策略后,输入将被限制为一个小的样本,这可以加快预览计算速度。假设我们的预览中只剩下六行:
| id | value |
|---|---|
| 1 | row_1 |
| 12 | row_12 |
| 33 | row_33 |
| 62 | row_62 |
| 126 | row_126 |
| 527 | row_527 |
如果我们随后使用转换添加一个值为 world 的常量列 hello,预览将显示为我们的六个采样行计算的转换结果:
| id | value | hello |
|---|---|---|
| 1 | row_1 | world |
| 12 | row_12 | world |
| 33 | row_33 | world |
| 62 | row_62 | world |
| 126 | row_126 | world |
| 527 | row_527 | world |
计算行数将返回六行,并且任何统计信息将仅在这六行上计算。
当我们最终构建管道时,采样策略将不会产生影响,我们的转换将在全部 600 个输入行上计算。