Stream monitoring(流监控(Stream monitoring))
Stream monitoring enables alerting around your stream's health.
A stream is considered "healthy" when it is:
- Ingesting new records from source systems.
- Processing and writing records into user-facing Foundry applications.
- Regularly persisting state, regardless of the presence of incoming records. This is only applicable for pipelines.
You can monitor the health of a pipeline by setting ingest and output alerts that fire when the number of records ingested or output, over a time period, falls below a user-defined threshold.
For example, an ingest monitor could alert if your stream has ingested zero records over the last five minutes, while an output monitor could alert if your stream has output less than 1000 records over the last 30 minutes.
Creating monitors
- Open the Data Health application.
- Select the Monitoring Views tab.
- Create or select an existing Monitoring View.
- Navigate to the Manage Monitors tab.
- Select Add new alert.
- Select Add monitoring rules.
Configuring ingest monitors
:::callout{theme="warning"}
You should only apply monitors to streams with a deterministic flow of records.
Various fixed time periods, such as five and thirty minutes, are supported. :::
Ingest monitors ensure that:
- Your source system is generating and sending records to Foundry.
- Foundry is writing records into the ingest stream's live view.
To configure this:
- Follow the creating monitors instructions.
- Select Streaming dataset as the resource type.
- Add the ingest streams to monitor and select Next.
- Select + Add in the Ingest stream monitors card.
- Select Records ingested monitor with a 5 or 30 minute duration.
- Set your threshold and select Next.
- Review your monitor and select Save monitoring rules.
Examples:
Records ingestedwith a five-minute duration and threshold of zero: Alerts when your stream has written zero records to the live view over the last five minutes.Records ingestedthe thirty-minute duration and threshold of 1000: Alerts when your stream has written less than or equal to 1000 records to the live view over the last 30 minutes.
Configuring pipeline monitors
You can follow the same workflow used to configure ingest monitors for pipeline monitors, but there are some notable differences in the monitors available for streaming pipelines outlined below.
Checkpoint metrics
Checkpoint Liveness: Alerts if a stream has not checkpointed in the configured amount of time. This monitor is highly recommended for production streams, as it is a high-signal indicator of a degraded performance. Learn more about checkpointing.Last Checkpoint Duration: Alerts if checkpoint duration has increased beyond a configured threshold.Checkpoint Trigger Failures: Alerts if checkpoints fail to trigger consecutively.Consecutive Checkpoint Failures: Alerts if checkpoints fail consecutively.
Performance metrics
Total Lag: Alerts if a job falls behind on the input by the configured amount of records, which signals degraded performance.Total Throughput: Alerts if the amount of records per checkpoint is under or over a configured threshold, which indicates changes in the upstream input.Utilization: Alerts if the percentage of the stream's utilized capacity is above a set threshold, which you can configure using streaming profiles.
Configuring output monitors
Output monitors ensure that your pipeline is:
- Processing ingested records.
- Writing those processed records into user-facing Foundry applications.
:::callout{theme="neutral"} While stream monitoring is in the beta phase, time series and geotemporal series are the only data formats able to be monitored. :::
Time series
To monitor records written to time series, you will set alerts on the time series sync.
- Follow the creating monitors instructions.
- Select Time series sync as the resource type.
- Add the time series syncs to monitor and select Next.
- Select + Add in the monitors card.
- Select Points written to Epoch with a 5 or 30 minute duration.
- Set your threshold and select Next.
- Review your monitor and select Save monitoring rules.
Examples:
Points written to Time Series DBwith a five minute duration and threshold of zero: Alerts when your time series sync has written zero records over the last five minutes.Points written to Time Series DBwith a 30 minute duration and threshold of 1000: Alerts when your time series sync has written less than or equal to 1000 records over the last 30 minutes.
Geotemporal observations
To monitor geotemporal observations, you will set alerts on the backing observation dataset.
- Follow the creating monitors instructions.
- Select Geotemporal observations as the resource type.
- Add the observation datasets to monitor and select Next.
- Select + Add in the monitors card.
- Select Geotemporal observations sent with a 5 or 30 minute duration.
- Set your threshold and select Next.
- Review your monitor and select Save monitoring rules.
Examples:
Geotemporal observations sentwith a five minute duration and threshold of zero: Alerts when your geotemporal sync has sent zero observations to geotime over the last five minutes.Geotemporal observations sentthe 30 minute duration and threshold of 1000: Alerts when your geotemporal sync has sent less than or equal to 1000 observations to geotime over the last 30 minutes.
:::callout{theme="neutral"}
- Ensure you set the monitor on the backing observation dataset instead of the errors dataset.
- Geotemporal observations sent only ensures the records were sent from geotime ingest. This does not guarantee that the geotime service has processed the record after ingestion.
:::
Viewing metrics
To view the metrics underlying a monitor, select the monitor rule in row in the monitoring view's Manage monitors tab.
Metrics are only available for streaming or time series monitors with a single target scope.
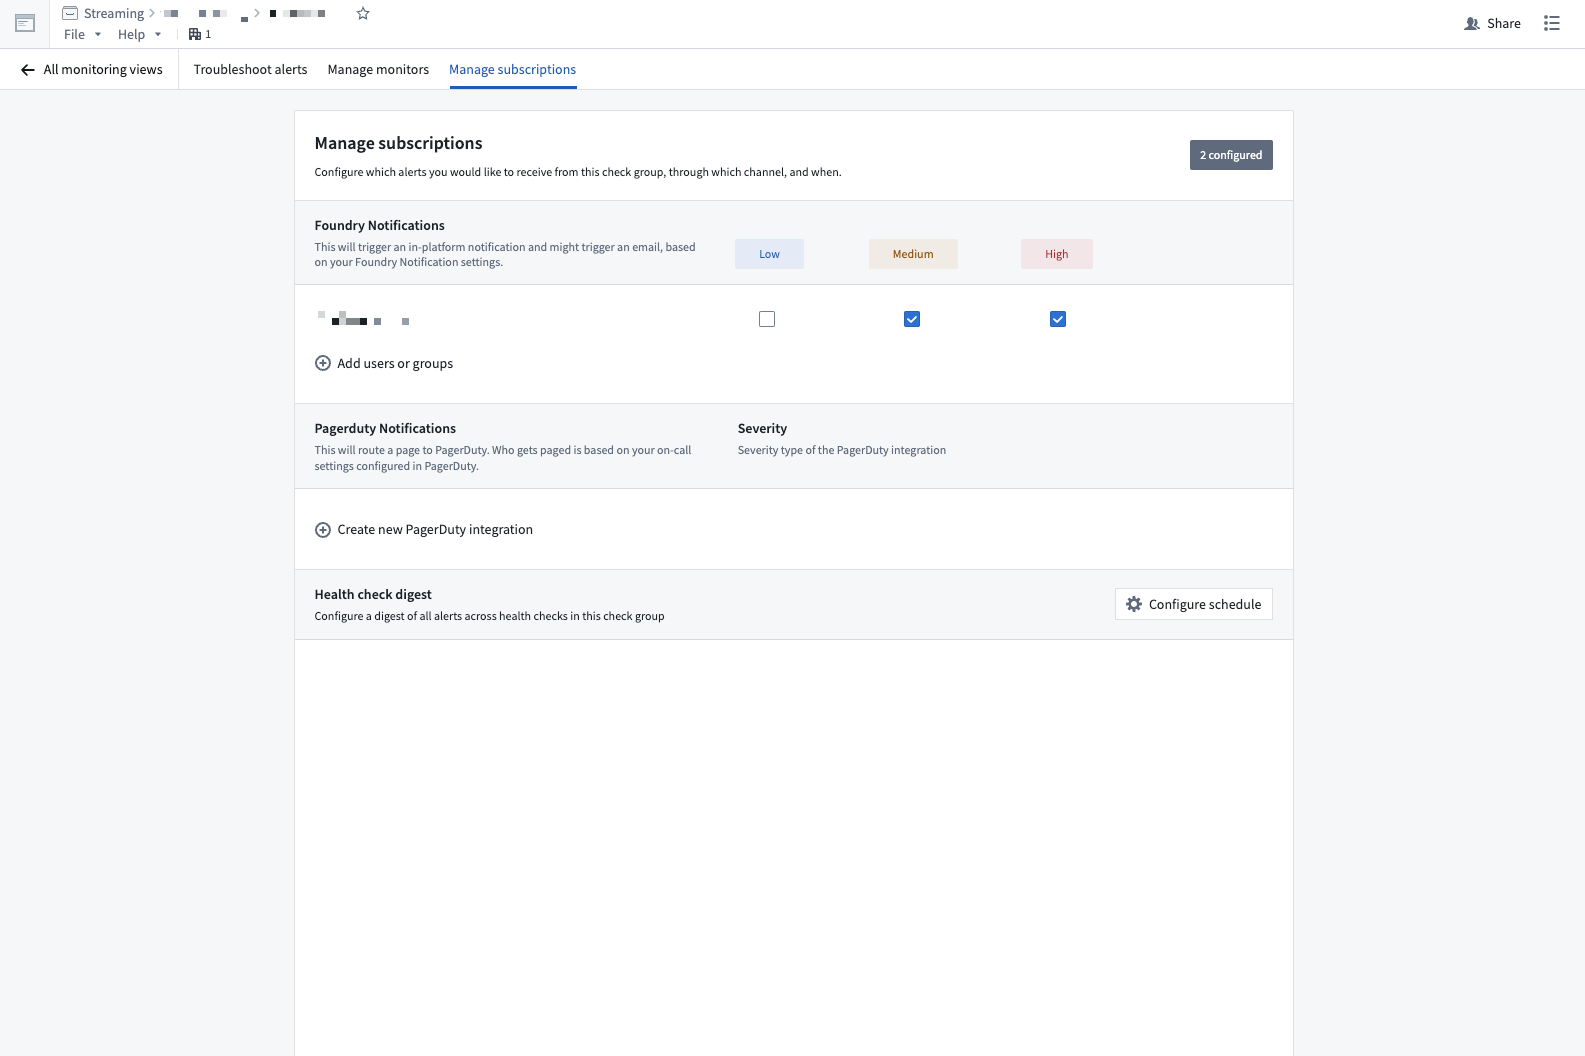
Monitor notifications
You can configure notifications through the monitoring view's Manage subscriptions tab.
To set email alerts:
- Select Add users to group.
- Search and select a user.
- Select the severities to get notified for.
To set PagerDuty alerts:
- Select Create new PagerDuty integration.
- Set the Integration Name.
- Create an integration in PagerDuty.
- Copy and paste the integration key into the Integration Key.
- Select the Severity of alerts.
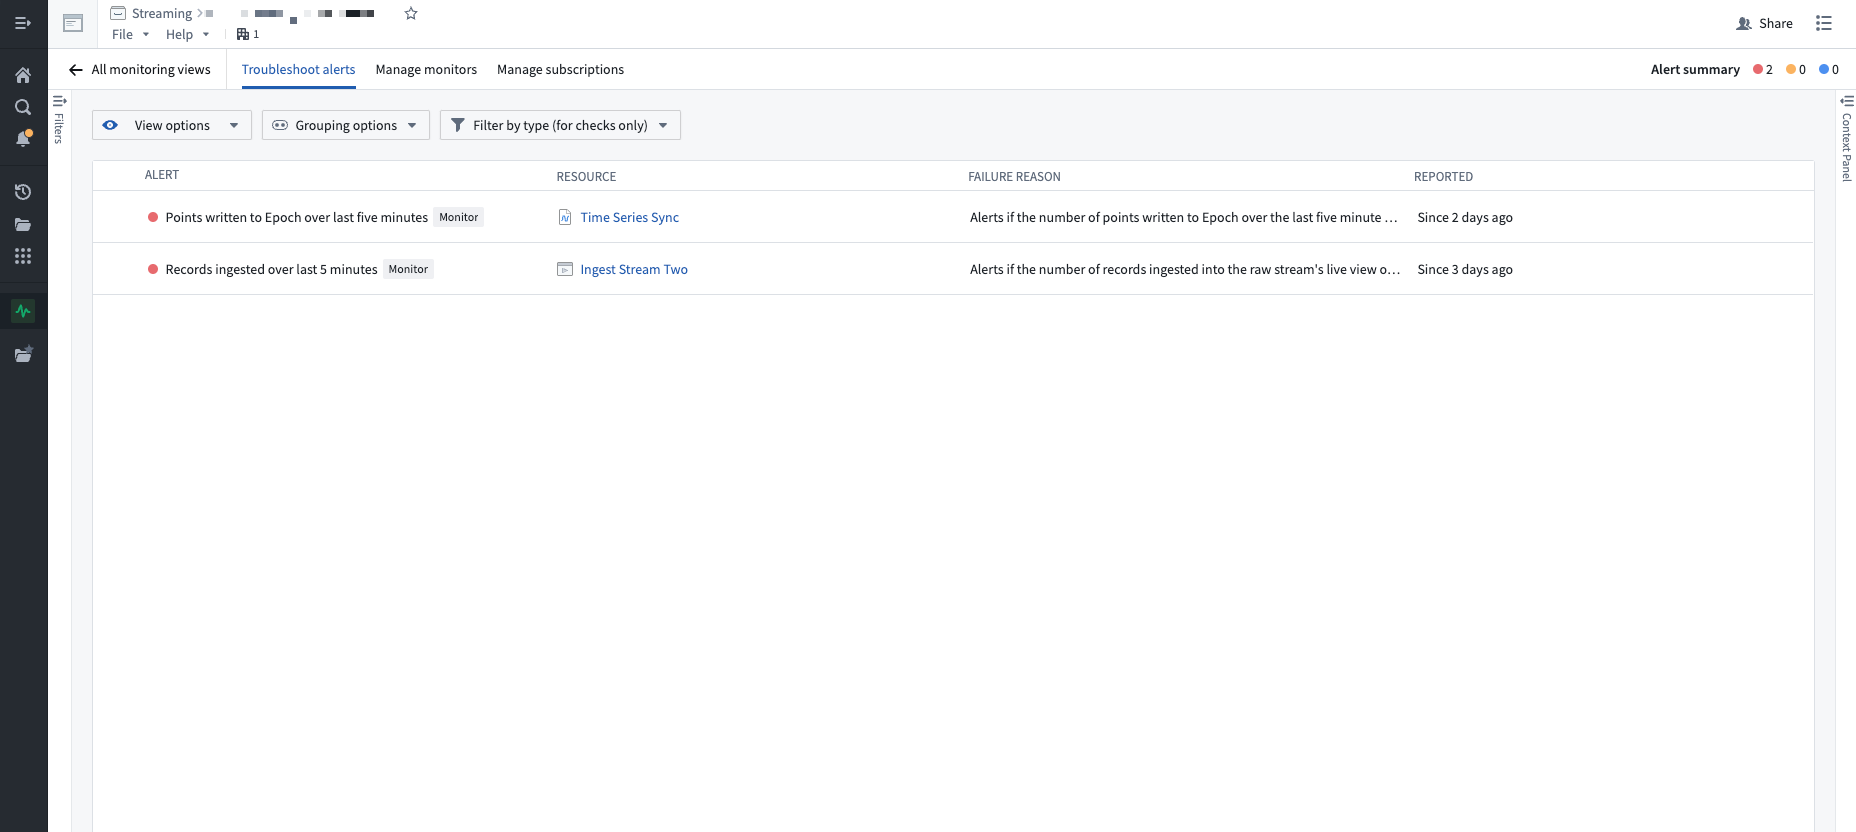
Firing alerts
You can view firing alerts in the Troubleshoot alerts tab of your monitoring view.
中文翻译
流监控(Stream monitoring)
流监控(Stream monitoring)功能可针对数据流的健康状态发出告警。
当数据流满足以下条件时,即被视为"健康":
- 从源系统中持续摄取新记录。
- 将记录处理并写入面向用户的Foundry应用程序。
- 无论是否有新记录进入,都能定期持久化状态。此条件仅适用于流水线(Pipeline)。
您可以通过设置摄取(Ingest)和输出(Output)告警来监控流水线的健康状况。当一段时间内摄取或输出的记录数量低于用户定义的阈值时,这些告警将被触发。
例如,摄取监控器可在过去五分钟内数据流未摄取任何记录时发出告警,而输出监控器则可在过去三十分钟内数据流输出记录少于1000条时发出告警。
创建监控器(Creating monitors)
- 打开数据健康(Data Health)应用程序。
- 选择监控视图(Monitoring Views)选项卡。
- 创建或选择一个现有的监控视图(Monitoring View)。
- 导航至管理监控器(Manage Monitors)选项卡。
- 选择添加新告警(Add new alert)。
- 选择添加监控规则(Add monitoring rules)。
配置摄取监控器(Configuring ingest monitors)
:::callout{theme="warning"}
您只应对具有确定性记录流的数据流应用监控器。
支持多种固定时间段,例如五分钟和三十分钟。
:::
摄取监控器(Ingest monitors)确保:
- 您的源系统正在生成记录并将其发送至Foundry。
- Foundry正在将记录写入摄取流(Ingest stream)的实时视图(Live view)。
配置方法如下:
- 按照创建监控器的说明操作。
- 选择流式数据集(Streaming dataset)作为资源类型。
- 添加要监控的摄取流,然后选择下一步(Next)。
- 在摄取流监控器(Ingest stream monitors)卡片中选择+ 添加(+ Add)。
- 选择持续时间为5分钟或30分钟的已摄取记录数(Records ingested)监控器。
- 设置阈值,然后选择下一步(Next)。
- 检查监控器设置,然后选择保存监控规则(Save monitoring rules)。
示例:
- 持续时间为五分钟、阈值为零的
已摄取记录数(Records ingested):当数据流在过去五分钟内向实时视图写入零条记录时发出告警。 - 持续时间为三十分钟、阈值为1000的
已摄取记录数(Records ingested):当数据流在过去三十分钟内向实时视图写入的记录数小于或等于1000条时发出告警。
配置流水线监控器(Configuring pipeline monitors)
您可以按照与配置摄取监控器相同的工作流程来配置流水线监控器(Pipeline monitors),但下文概述了流式流水线(Streaming pipelines)可用的监控器存在一些显著差异。
检查点指标(Checkpoint metrics)
检查点活性(Checkpoint Liveness):如果数据流在配置的时间范围内未进行检查点(Checkpoint)操作,则发出告警。此监控器强烈建议用于生产环境数据流,因为它是性能下降的高信号指标。了解更多关于检查点的信息。上次检查点持续时间(Last Checkpoint Duration):如果检查点持续时间超过配置的阈值,则发出告警。检查点触发失败(Checkpoint Trigger Failures):如果检查点连续触发失败,则发出告警。连续检查点失败(Consecutive Checkpoint Failures):如果检查点连续失败,则发出告警。
性能指标(Performance metrics)
总延迟(Total Lag):如果作业在输入方面落后于配置的记录数量,则发出告警,这表示性能下降。总吞吐量(Total Throughput):如果每个检查点的记录数量低于或高于配置的阈值,则发出告警,这表示上游输入发生变化。利用率(Utilization):如果数据流已利用容量的百分比超过设定阈值,则发出告警,您可以通过流式配置文件(Streaming profiles)进行配置。
配置输出监控器(Configuring output monitors)
输出监控器(Output monitors)确保您的流水线:
- 正在处理已摄取的记录。
- 正在将这些已处理的记录写入面向用户的Foundry应用程序。
:::callout{theme="neutral"} 在流监控处于测试阶段时,时间序列(Time series)和地理时间序列(Geotemporal series)是唯一可被监控的数据格式。 :::
时间序列(Time series)
要监控写入时间序列(Time series)的记录,您需要在时间序列同步(Time series sync)上设置告警。
- 按照创建监控器的说明操作。
- 选择时间序列同步(Time series sync)作为资源类型。
- 添加要监控的时间序列同步,然后选择下一步(Next)。
- 在监控器(monitors)卡片中选择+ 添加(+ Add)。
- 选择持续时间为5分钟或30分钟的写入纪元(Points written to Epoch)。
- 设置阈值,然后选择下一步(Next)。
- 检查监控器设置,然后选择保存监控规则(Save monitoring rules)。
示例:
- 持续时间为五分钟、阈值为零的
写入时间序列数据库的点数(Points written to Time Series DB):当时间序列同步在过去五分钟内写入零条记录时发出告警。 - 持续时间为三十分钟、阈值为1000的
写入时间序列数据库的点数(Points written to Time Series DB):当时间序列同步在过去三十分钟内写入的记录数小于或等于1000条时发出告警。
地理时间观测(Geotemporal observations)
要监控地理时间观测(Geotemporal observations),您需要在底层观测数据集(Observation dataset)上设置告警。
- 按照创建监控器的说明操作。
- 选择地理时间观测(Geotemporal observations)作为资源类型。
- 添加要监控的观测数据集,然后选择下一步(Next)。
- 在监控器(monitors)卡片中选择+ 添加(+ Add)。
- 选择持续时间为5分钟或30分钟的已发送的地理时间观测(Geotemporal observations sent)。
- 设置阈值,然后选择下一步(Next)。
- 检查监控器设置,然后选择保存监控规则(Save monitoring rules)。
示例:
- 持续时间为五分钟、阈值为零的
已发送的地理时间观测(Geotemporal observations sent):当地理时间同步在过去五分钟内向地理时间(Geotime)发送了零条观测时发出告警。 - 持续时间为三十分钟、阈值为1000的
已发送的地理时间观测(Geotemporal observations sent):当地理时间同步在过去三十分钟内向地理时间发送的观测数小于或等于1000条时发出告警。
:::callout{theme="neutral"}
- 请确保将监控器设置在底层观测数据集上,而不是错误数据集上。
- 已发送的地理时间观测(Geotemporal observations sent)仅确保记录已从地理时间摄取(Geotime ingest)发送出去。这并不保证地理时间服务在摄取后已处理该记录。
:::
查看指标(Viewing metrics)
要查看监控器底层的指标,请在监控视图(Monitoring view)的管理监控器(Manage monitors)选项卡中选择监控规则所在的行。
指标仅适用于具有单一目标范围的流式或时间序列监控器。
监控器通知(Monitor notifications)
您可以通过监控视图的管理订阅(Manage subscriptions)选项卡配置通知。
要设置电子邮件告警:
- 选择将用户添加到组(Add users to group)。
- 搜索并选择一个用户。
- 选择要接收通知的严重级别。
要设置PagerDuty告警:
- 选择创建新的PagerDuty集成(Create new PagerDuty integration)。
- 设置集成名称(Integration Name)。
- 在PagerDuty中创建一个集成。
- 复制集成密钥并粘贴到集成密钥(Integration Key)中。
- 选择告警的严重级别(Severity)。
触发告警(Firing alerts)
您可以在监控视图的排查告警(Troubleshoot alerts)选项卡中查看正在触发的告警。