Debug a failing pipeline(调试失败的流水线)
The ability to debug and resolve pipeline problems quickly is a core part of pipeline maintenance work. It ensures production pipelines feeding important organizational workflows remain reliable and meaningful.
This page provides a framework which you can use as the basis of a standard operating procedure (SOP) when receiving a notification for a health check failure during an on-call rotation as a pipeline maintainer.
Prerequisite knowledge
This page assumes you are familiar with a variety of Foundry tools and workflows. Links will be provided in the relevant sections:
It also assumes that your pipeline maintainer team records an incident log or other documentation for recurring issues in your pipeline. This is a best practice and should be implemented if there is not currently such a document.
Debugging framework overview
Always begin by asking the following three questions, in order:
- Mitigation: Can I mitigate this problem as soon as possible? Some examples would be to:
- Rebuild the schedule. We recommend rebuilding a schedule rather than a single dataset or failing job, as this will appear in your schedule history. Schedule history allows you to track the history of your pipeline, rather than the history of an individual dataset.
- If there’s too much queuing, seeking out and canceling overlapping or intensive schedules.
- If a manual upload is broken, revert the transaction to a known stable version.
- Classification: What is the problem category?
- The reason we classify a problem is to assist in root cause identification and to determine if the resolution will require involvement from another team.
- More details on how to think about problem categories and identify them below.
- Broader impact: Could this problem be affecting other parts of the platform?
:::callout{theme="success" title="Tip"} Read your pipeline’s documentation! Perhaps this problem has previously been solved. Or there may be warnings of what not to do during mitigation. For example, some builds can be very expensive and may impact the performance of your environment during peak usage times. These kinds of details should be well-documented for your whole team. :::
Problem category classification
After attempting to mitigate the problem, as a pipeline maintainer you will need to go deeper to understand and remedy the root cause. The reason classifying a problem is helpful during debugging, is that it helps us identify the root cause and most importantly, helps you quickly identify whether you can fix the issue or whether you’ll need to contact another team.
There are three categories of problems:
- Upstream issues: related to infrastructure or artifacts managed by others
- Outside of Foundry: Issues with upstream data sources
- Within Foundry: Issues caused by datasets/projects upstream of the pipeline in question
- Platform Issues: issues caused by the Foundry Platform services not working as expected.
- Change: anything that’s changed within the scope of the pipeline that you are responsible for monitoring. This is the most common category of problem and is often caused by user changes. Some examples include:
- Code changes
- Schedule changes
- Increased data size in pipeline
Steps to issue resolution by category of problem:
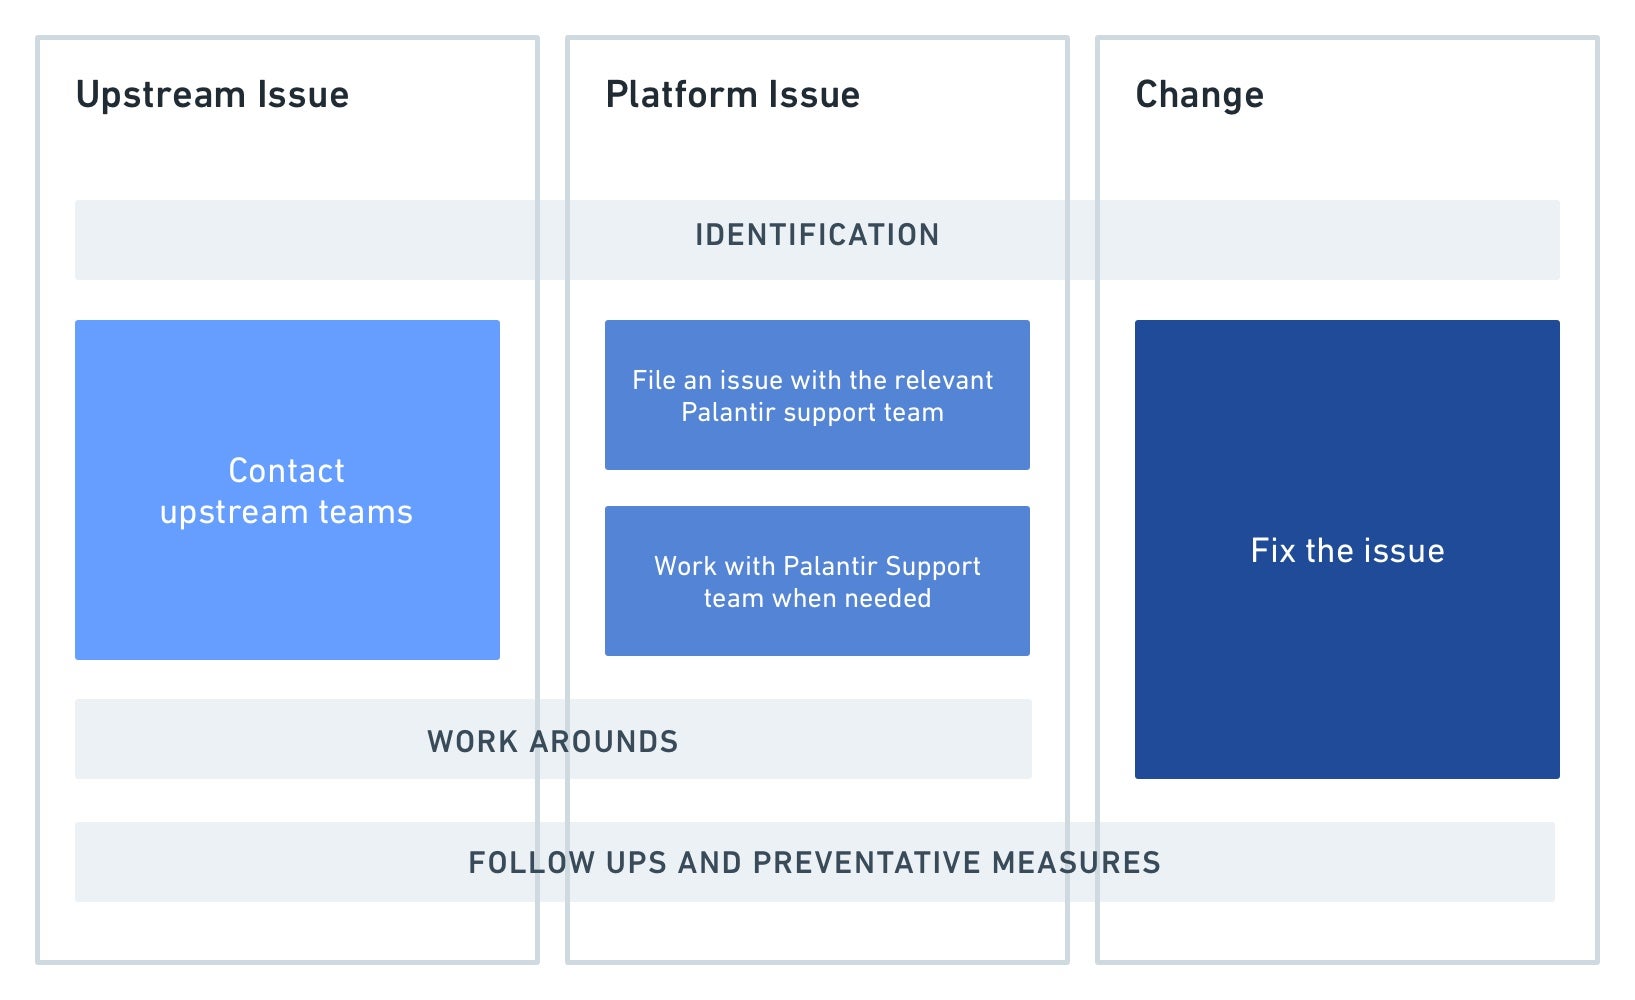
In detail, the steps highlighted above are:
-
Identification: When going through the steps above, it is important to identify very precisely what is broken. Answer questions like:
-
When did the issue begin?
- At what step in the pipeline did something fail?
- What health checks are failing?
- Did something in the pipeline change to cause this broken state?
This allows you to communicate effectively with other teams if needed for upstream issues and platform issues and reduces resolution time. It also improves debugging skills in the platform.
- Action:
- Upstream issue: Once you’ve confirmed the issue is indeed caused by delayed, missing or incorrect data from a project or datasource upstream from your pipeline, contact the team responsible for the upstream data.
- Tip: It’s helpful before you begin monitoring that you document the contact details of the upstream team. This makes it easy for the on-call person to contact them.
- Platform issue: if you’ve identified unexpected behavior from Foundry and ruled out any user-change in your pipeline, contact your Palantir representative. Provide them with as much specific information about the problem as you can, including the details of any changes that were observed. See the section below here for some tips on how to spot these.
-
Change: After identifying something has changed within the monitored pipeline, you are usually able to take an action to fix it. In some cases, it may be necessary to reach out to whoever has made the change for more information. See the next section for help identifying if something has changed in your pipeline.
-
[Optional] Downstream user communications: A step not mentioned in the above diagram is that when an issue has been classified and further root caused, it may be appropriate to notify downstream consumers of the pipeline. This depends on the problem impact, scope, duration and the use case of the pipeline.
-
Workarounds: if a fix from another team or from a user is going to take some time, it may be useful to implement medium-term workarounds to ensure the healthy part of your pipeline continues to run for downstream consumers. The exact temporary fix depends on the issue and needs of your users. Examples include:
- Isolate the problem by removing the broken dataset or pipeline branch from your schedule.
- Pinning another python library version if this is the root cause of issues. This can be done in the meta.yml by specifying an explicit version number next to the library name.
Identifying change in your pipeline
The most common issues that arises for a pipeline maintainer result as an unintended consequence of something changing within a pipeline you monitor. It is also the category where, as a pipeline maintainer, you have the most control and are able to fix the problem directly without needing to rely on another team.
In more detail, the steps to take are:
- Track down precisely where the issue is coming from in your pipeline as best you can. For example, try and identify the schedule, the dataset, the transaction, the code change, and so on.
-
Compare a healthy previous run to the current broken state to identify what changed. It can be useful to have a mental checklist of questions. Below is an example set of questions, along with some example tools that could help you find an answer:
-
Slower than usual? Is this caused by queuing or is the build actually taking longer to compute?
- Changes to file/data size?
- Code changes? Schema changes?
- Schedule changes?
- Ongoing platform incidents?
Tools
If you are not familiar with the tooling in Foundry used to answer some of the above questions, the list below provides examples of the most common patterns to use during your investigation. This list does not cover all possibilities but rather serves as a starting guide:
Is my job/build slower than usual?
- Builds application for comparing jobs for a given dataset. The progress details toggle in the top-right of a Build overview will allow you to see the progress of your build by queuing time vs compute time.
-
If a failed job was built as a part of a schedule, a schedule card will be shown in the bottom left of your Build details page. You can open a previous run of a schedule by clicking on a dot representing a previous build.
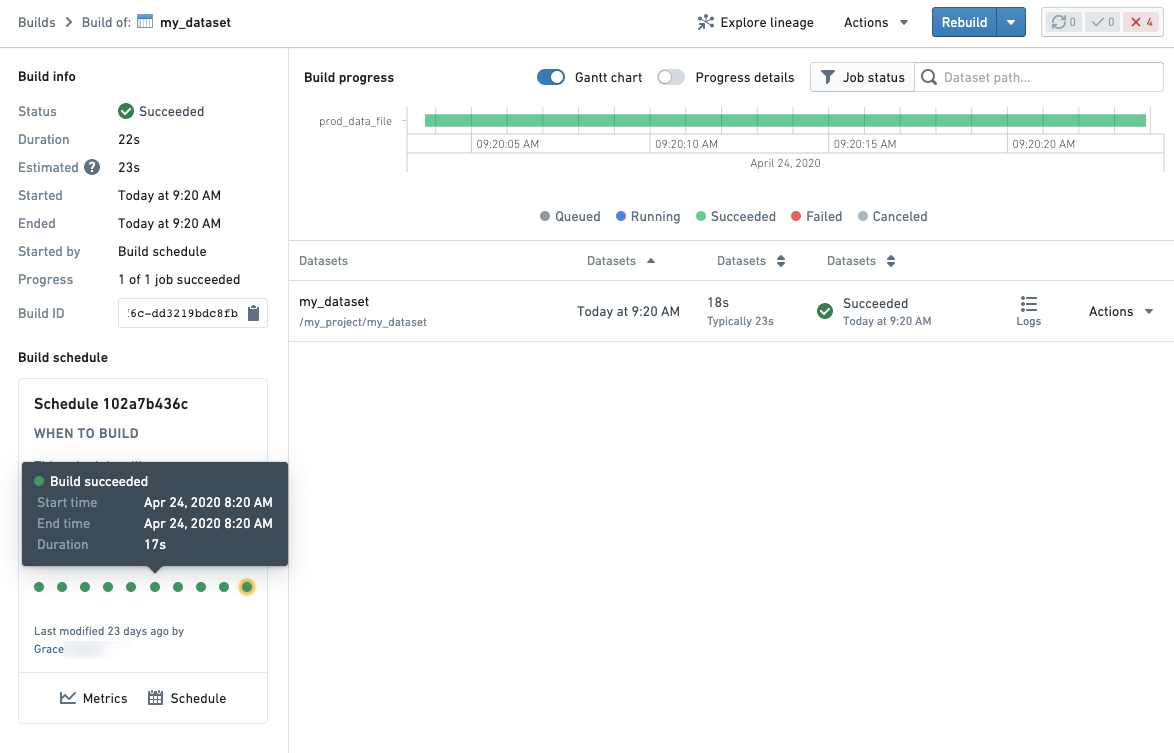
-
Schedule metrics which allows you to see historical runs of a schedule as well as metrics and graphs to compare runs
Are there any changes to the size of my dataset? Is my transform running with more data?
-
Dataset Preview: the history and compare tab of any Foundry dataset provides an overview of the history of a dataset as well as the ability to compare to previous transactions of your dataset to get an overview of what changed.

-
Contour provides access to the historical view to compare row number using the summary board or if you have a column that represents the date that data was added/created, you can create charts to compare the number of rows against the date added.
-
Spark details: By clicking on the Spark details button (see below) on any job, you will be able to see information that can help indicate if there is more data in your pipeline such as the
count of tasksmetric.

Has the code changed in my pipeline?
- Dataset Preview’s Compare tab allows you to see code changes on the direct transform file when comparing the historical transactions on a dataset.
- Within Code Repositories, the File changes (commit history) helper in the Code tab allows you to see code changes.
- The Data Lineage tool allows you to get a quick overview of schemas across your pipeline. The side panel Properties & Histogram can be especially useful to track which datasets across your pipeline contain a particular column.
:::callout{theme="neutral"} Code changes may occur in imported libraries in a transform if using a language that supports this such as Python or Java. If you don’t see a change on your transform, consider checking if there was a logic change in a library function. :::
Has my schedule been altered?
- The schedule card in various parts of the platform will allow you to see when the schedule was last changed.
- The schedule versions tab on the schedule's metrics page will allow you to identify exactly which changes were made to a schedule configuration.
Identifying platform issues
Checking for similar symptoms in other jobs, builds or related platform components can be a useful investigation path if you’re not sure what the problem is based on the symptoms you see.
In particular, you should look for answers to these questions:
- Is it reproducible?
- Does this issue happen consistently?
- Does it follow a pattern? For example, does it fail on Monday at 9am after the weekend each week?
- What’s the scope?
- If your job is slow or failing, are you seeing this with other transforms jobs? Or perhaps other Python jobs only?
Using Builds application to filter down job history across the platform can help you answer the above questions.
The ability to debug and resolve pipeline problems quickly is a core part of a pipeline maintainer’s work. It ensures production pipelines feeding important organizational workflows remain reliable and meaningful. If you find yourself following the guidelines outlined on this page and are unable to still identify the issue at hand, contact your Palantir representative.
中文翻译
调试失败的流水线
快速调试和解决流水线问题是流水线维护工作的核心部分。它确保为重要组织工作流提供数据的生产流水线保持可靠且有意义。
本页面提供了一个框架,您可以在作为流水线维护者进行轮值值班时,收到健康检查失败通知后,将其作为标准操作流程(SOP)的基础。
前置知识
本页面假设您熟悉多种Foundry工具和工作流。相关章节将提供链接:
- 代码仓库(Code Repositories)
- 构建应用(Builds application)
- 调度(Scheduling) 和 调度指标(schedule metrics)
- 数据血缘(Data Lineage)
同时假设您的流水线维护团队会记录流水线中重复出现的问题的事件日志或其他文档。这是最佳实践,如果目前没有此类文档,应予以实施。
调试框架概述
始终按顺序提出以下三个问题:
- 缓解措施(Mitigation): 我能否尽快缓解此问题?例如:
- 重建调度。我们建议重建调度而非单个数据集或失败的任务,因为这将显示在您的调度历史中。调度历史允许您跟踪流水线的历史,而非单个数据集的历史。
- 如果排队过多,查找并取消重叠或密集的调度。
- 如果手动上传损坏,将事务回滚到已知的稳定版本。
- 分类(Classification): 问题属于什么类别?
- 对问题进行分类是为了帮助识别根本原因,并确定解决方案是否需要其他团队的参与。
- 有关如何思考问题类别及识别它们的更多详情,请参见下文。
- 更广泛的影响(Broader impact): 此问题是否可能影响平台的其他部分?
:::callout{theme="success" title="提示"} 请阅读您的流水线文档!也许此问题之前已经解决过,或者可能有关于缓解期间不应做什么的警告。例如,某些构建可能非常昂贵,并可能在高峰使用时段影响环境性能。这些细节应为整个团队做好文档记录。 :::
问题类别分类
在尝试缓解问题后,作为流水线维护者,您需要深入理解并修复根本原因。在调试过程中对问题进行分类之所以有帮助,是因为它有助于我们识别根本原因,最重要的是,帮助您快速判断是自己能修复问题,还是需要联系其他团队。
问题分为三类:
- 上游问题(Upstream issues): 与其他人管理的基础设施或工件相关
- Foundry外部: 上游数据源的问题
- Foundry内部: 由所讨论流水线上游的数据集/项目引起的问题
- 平台问题(Platform Issues): 由Foundry平台服务未按预期工作引起的问题。
- 变更(Change): 在您负责监控的流水线范围内发生的任何变化。这是最常见的问题类别,通常由用户变更引起。例如:
- 代码变更
- 调度变更
- 流水线中数据量增加
按问题类别解决问题的步骤:
详细来说,上述步骤包括:
- 识别(Identification): 在执行上述步骤时,精确识别出问题的具体内容非常重要。回答如下问题:
- 问题何时开始?
- 流水线中哪一步失败了?
- 哪些健康检查失败?
- 流水线中是否有变化导致了此故障状态?
这使您能够在需要时就上游问题和平台问题与其他团队有效沟通,并缩短解决时间。同时也能提升您在平台上的调试技能。
- 行动(Action):
- 上游问题: 一旦确认问题确实是由流水线上游的项目或数据源的数据延迟、缺失或错误引起,请联系负责上游数据的团队。
- 提示: 在开始监控之前,记录上游团队的联系方式会很有帮助。这能让值班人员轻松联系到他们。
- 平台问题: 如果您发现了Foundry的意外行为,并排除了流水线中的任何用户变更,请联系您的Palantir代表。尽可能提供关于问题的具体信息,包括观察到的任何变更详情。有关如何发现这些问题的技巧,请参见下文部分。
-
变更: 在识别到监控的流水线内发生了某些变化后,您通常可以采取行动进行修复。在某些情况下,可能需要联系做出变更的人以获取更多信息。请参见下一节,了解如何判断流水线中是否有变化。
-
[可选] 下游用户沟通: 上述图表中未提及的一个步骤是,当问题已被分类并进一步定位根本原因后,可能适合通知流水线的下游消费者。这取决于问题的影响、范围、持续时间以及流水线的使用场景。
-
临时解决方案(Workarounds): 如果其他团队或用户的修复需要一些时间,实施中期临时解决方案以确保流水线的健康部分继续为下游消费者运行可能会很有用。具体的临时修复取决于问题本身和用户需求。例如:
- 从调度中移除损坏的数据集或流水线分支来隔离问题。
- 如果这是问题的根本原因,固定另一个Python库版本。这可以在meta.yml中通过指定库名称旁的显式版本号来完成。
识别流水线中的变更
流水线维护者遇到的最常见问题,是您监控的流水线内部发生某些变化而导致的意外后果。这也是作为流水线维护者,您拥有最大控制权,能够直接修复问题而无需依赖其他团队的类别。
更详细地说,需要采取的步骤如下:
- 尽可能精确地追踪问题在流水线中的来源。例如,尝试识别调度、数据集、事务、代码变更等。
-
将健康的先前运行与当前的故障状态进行比较,以识别发生了什么变化。 拥有一个心理检查清单会很有用。以下是一组示例问题,以及一些可以帮助您找到答案的示例工具:
-
比平时慢?这是由排队引起的,还是构建实际计算时间变长了?
- 文件/数据大小有变化?
- 代码变更?模式变更?
- 调度变更?
- 正在进行的平台事件?
工具
如果您不熟悉用于回答上述某些问题的Foundry工具,下面的列表提供了在调查过程中最常用模式的示例。此列表并未涵盖所有可能性,而是作为入门指南:
我的任务/构建是否比平时慢?
- 构建应用(Builds application) 用于比较给定数据集的任务。构建概览右上角的进度详情切换按钮允许您查看构建的排队时间与计算时间的进度。
-
如果失败的任务是作为调度的一部分构建的,构建详情页面左下角会显示一个调度卡片。您可以通过点击代表先前构建的点来打开调度的先前运行。
-
调度指标(Schedule metrics) 允许您查看调度的历史运行以及用于比较运行的指标和图表。
我的数据集大小是否有变化?我的转换是否在处理更多数据?
-
数据集预览(Dataset Preview):任何Foundry数据集的历史和比较选项卡都提供了数据集历史的概览,以及能够与数据集先前事务进行比较,以了解发生了什么变化。
-
Contour 提供历史视图的访问权限,以使用摘要面板(summary board)比较行数,或者如果您有表示数据添加/创建日期的列,可以创建图表来比较行数与添加日期。
-
Spark详情(Spark details):通过点击任何任务上的Spark详情按钮(见下文),您将能够看到有助于指示流水线中是否有更多数据的信息,例如
任务计数(count of tasks)指标。
我的流水线中的代码是否发生了变化?
- 数据集预览的比较(Compare) 选项卡允许您在比较数据集的历史事务时,查看直接转换文件上的代码变更。
- 在代码仓库(Code Repositories)中,代码选项卡(Code tab)中的文件变更(File changes)(提交历史)辅助工具允许您查看代码变更。
- 数据血缘(Data Lineage) 工具允许您快速了解流水线中的模式概览。侧面板属性与直方图(Properties & Histogram) 对于跟踪流水线中哪些数据集包含特定列尤其有用。
:::callout{theme="neutral"} 如果使用支持此功能的语言(如Python或Java),代码变更可能发生在转换中导入的库中。如果您在转换中没有看到变更,请考虑检查库函数中是否有逻辑变更。 :::
我的调度是否被修改过?
- 平台各处的调度卡片将允许您查看调度上次修改的时间。
- 调度指标页面上的调度版本选项卡(schedule versions tab) 将允许您精确识别对调度配置进行了哪些更改。
识别平台问题
如果您根据看到的症状不确定问题是什么,检查其他任务、构建或相关平台组件中是否有类似症状,可能是一条有用的调查路径。
特别是,您应该寻找以下问题的答案:
- 是否可重现(reproducible)?
- 此问题是否持续发生?
- 是否遵循某种模式?例如,是否每周一早上9点(周末之后)失败?
- 范围(scope) 是什么?
- 如果您的任务缓慢或失败,其他转换任务是否也出现此情况?或者仅限其他Python任务?
使用构建应用(Builds application) 过滤整个平台的任务历史可以帮助您回答上述问题。
快速调试和解决流水线问题是流水线维护者工作的核心部分。它确保为重要组织工作流提供数据的生产流水线保持可靠且有意义。如果您发现自己遵循了本页面概述的指南但仍无法识别问题,请联系您的Palantir代表。