Debug a failing stream(调试失败的流)
As you author streaming pipelines, you may encounter streaming failures. This page offers suggested workflows for debugging failing streams and discusses the tools available in Foundry to help you understand why a stream failed.
Types of failures
Failures can be classified into failure types, and each failure type can point to a different underlying cause. Below are some of the most common failure types and the reasons why they may occur.
- Immediate failure: A stream fails within 5 minutes of starting.
- Transient failure: A stream runs for some time, fails once, then restarts successfully and continues running.
- Persistent failure: A stream runs for some amount of time and then has a series of immediate failures that each happen within 5-10 minutes of the stream restarting.
Immediate failures
Streams that fail quickly usually have problems with the user-authored logic. For example, the failure could come from invalid casts, parsing exceptions, or other issues that prevent the streaming cluster from starting up successfully.
If a previously successful stream now fails, inspect any changes to the logic and upstream streams to find potential issues.
To determine the root cause of these issues, follow the steps outlined in the Check streaming cluster logs workflow below.
Transient failures
Failures on a stream that previously ran successfully but runs again after a restart usually points to infrastructure issues caused by networking outages. Outages are often caused by the cloud provider on which your Foundry instance is running (e.g. an AWS, Azure, or GCP outage). Applying a schedule to your streams will enable Foundry to automatically rerun your stream and continue processing from where it left off.
Persistent failures
Failures on a stream that previously ran successfully but now fails repeatedly without any logic changes are usually the most difficult to identify. However, they are generally caused by one of two factors: new input data to the stream is preventing the stream from making progress (e.g. invalid types, corrupt data, etc), or there is a persistent infrastructure issue (AWS outage, etc).
To check if the error is caused by the logic in the pipeline, follow the steps outlined in the Check streaming cluster logs workflow below.
Common debugging workflows
Below, we outline a handful of workflows you can use to solve common streaming issues. These checks do not need to be done in a specific order.
Check streaming cluster logs
Follow the steps for Retrieve stream logs and search the logs for any exceptions, errors, or “throwables”. These logs will usually provide a description of a potential underlying issue through keywords like “ERROR”, “throwable”, or “Exception”.
Check pipeline logic
Changes to pipeline logic can often cause breaks due to bugs in the user-authored code. Usually, the exception from the logs attained in the prior step will point to specific code that is causing the problem. If so, you can attempt to roll back any changes back to see if that fixes the problem.
Check input data
Occasionally, logic in your streaming pipeline can throw exceptions if it encounters unexpected data. An example of this behavior would be if the pipeline divides two columns by each other and returns a value with the divisor being 0 or null. Check the records from the end of the input stream to see if the data has changed in a way that could cause issues for the streaming pipeline. If you find changed data, consider adding filters or logic to clean the data or remove it.
Check stream details
Foundry detects common exceptions when streams fail and surfaces them in the stream details page. Check the details to see if any errors appear there.
:::callout{theme="neutral"} You can sometimes find more information about errors in the stream logs than in the details page. We recommend checking both locations for information about failures in your stream. :::


Retrieve stream logs
You may encounter a failure during your stream and need to access logs from a build to identity the cause. Build logs are often the best place to determine the cause of different types of stream failures.
To retrieve logs for a streaming job, first navigate to the stream details page in Dataset Preview.
Next, find the job you want to review, then click Download logs .

Choose whether you would like to download the logs with the earliest or latest log lines first.

Stream errors
Job repeatedly fails with unrecoverable error
Caused by: com.palantir.logsafe.exceptions.SafeIllegalStateException: Start transaction rid is not part of the current view.
This error is typically caused by a new snapshot of the input dataset being run in streaming.
Streaming sends records downstream as soon as the records are received, which makes records irreversible. When a new snapshot is created, a streaming job ignores previous transactions and uses only the new transaction. To discard old records in favor of a new snapshot, run a manual replay.
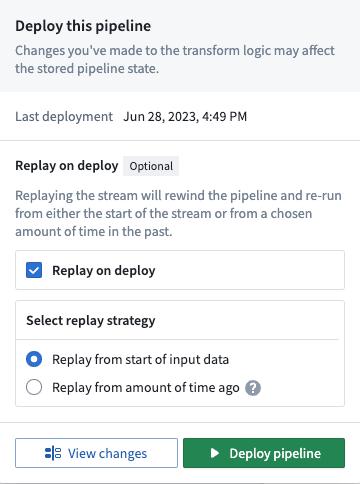
This issue is fixed by executing a new deploy of the pipeline that replays the stream by selecting the Replay on deploy option in the Deploy pipeline wizard.
中文翻译
调试失败的流
在编写流式管道时,您可能会遇到流处理失败的情况。本页面提供了调试失败流的建议工作流程,并讨论了 Foundry 中可用的工具,以帮助您理解流失败的原因。
失败类型
失败可以归类为不同的类型,每种失败类型可能指向不同的根本原因。以下是一些最常见的失败类型及其可能发生的原因。
- 即时失败(Immediate failure): 流在启动后5分钟内失败。
- 瞬时失败(Transient failure): 流运行一段时间后失败一次,然后成功重启并继续运行。
- 持续失败(Persistent failure): 流运行一段时间后,出现一系列即时失败,每次失败都发生在流重启后的5-10分钟内。
即时失败
快速失败的流通常与用户编写的逻辑有关。例如,失败可能源于无效的类型转换、解析异常或其他阻止流式集群成功启动的问题。
如果之前运行成功的流现在失败了,请检查逻辑和上游流的任何变更,以发现潜在问题。
要确定这些问题的根本原因,请按照下方检查流式集群日志工作流程中概述的步骤操作。
瞬时失败
之前成功运行但在重启后再次运行的流失败,通常指向由网络中断引起的基础设施问题。中断通常由您的 Foundry 实例所运行的云服务提供商引起(例如 AWS、Azure 或 GCP 中断)。为您的流设置调度计划将使 Foundry 能够自动重新运行您的流,并从上次中断的位置继续处理。
持续失败
之前成功运行但未做任何逻辑变更却反复失败的流通常最难定位。然而,它们通常由两个因素之一引起:流的新输入数据阻止了流的正常处理(例如无效类型、损坏数据等),或者存在持续的基础设施问题(AWS 中断等)。
要检查错误是否由管道中的逻辑引起,请按照下方检查流式集群日志工作流程中概述的步骤操作。
常见调试工作流程
下面,我们概述了一些可用于解决常见流式问题的工作流程。这些检查无需按特定顺序进行。
检查流式集群日志
按照获取流日志的步骤操作,并在日志中搜索任何异常、错误或"throwables"。这些日志通常会通过"ERROR"、"throwable"或"Exception"等关键词提供潜在底层问题的描述。
检查管道逻辑
管道逻辑的变更常常会因用户编写代码中的错误而导致中断。通常,上一步获取的日志中的异常会指向导致问题的具体代码。如果是这样,您可以尝试回滚任何变更,看看是否能解决问题。
检查输入数据
有时,流式管道中的逻辑在遇到意外数据时可能会抛出异常。这种行为的一个例子是,如果管道将两列相除并返回一个值,而除数为 0 或 null。检查输入流末尾的记录,看看数据是否发生了可能对流式管道造成问题的变化。如果发现数据有变化,考虑添加过滤器或逻辑来清理数据或将其移除。
检查流详情
Foundry 会在流失败时检测常见异常,并将其显示在流详情页面上。检查详情页面,看看是否有任何错误出现。
:::callout{theme="neutral"} 有时您可以在流日志中找到比详情页面更详细的错误信息。我们建议同时检查这两个位置,以获取有关流失败的信息。 :::
获取流日志
您可能会在流处理过程中遇到失败,需要访问构建日志以确定原因。构建日志通常是确定不同类型流失败原因的最佳位置。
要获取流式作业的日志,首先在数据集预览(Dataset Preview)中导航到流详情页面。
接下来,找到您要查看的作业,然后点击下载日志(Download logs)。
选择您希望先下载最早还是最新的日志行。
流错误
作业因不可恢复错误反复失败
Caused by: com.palantir.logsafe.exceptions.SafeIllegalStateException: Start transaction rid is not part of the current view.
此错误通常由输入数据集的新快照在流式处理中运行引起。
流式处理会在接收到记录后立即将记录发送到下游,这使得记录不可逆。当创建新快照时,流式作业会忽略先前的事务,仅使用新事务。要丢弃旧记录以使用新快照,请运行手动重播。
通过在部署管道(Deploy pipeline)向导中选择部署时重播(Replay on deploy)选项来执行管道的新部署,即可解决此问题。