Understand Spark details(理解 Spark 详情)
Apache Spark ↗ is the most commonly used execution engine in Foundry's data integration layer. In order to understand your pipeline's performance characteristics and find ways to optimize your pipeline, it's important to understand the details of how your code is executing in Spark. Foundry provides integrated tools to help you view and understand the performance of your jobs in Spark. This page outlines the Spark details that are available and provides guidance about what those details mean.
Getting to Spark details
For any dataset built in Foundry, follow these steps to view Spark details:
- View the Build report.
- From a Dataset Preview or from Data Lineage, select the History tab, select an individual build in the list, then select View build report.
- From the view of All builds, simply select a build in the list.
- Select a job. A build consists of one or more jobs, visible in the list below the Gantt chart. Select a job from the list, then select the Spark details button:

The Spark details page provides information regarding the execution of jobs in Spark. For each job, the Spark details page displays information in various categories as shown below:

Overview tab
The Overview tab provides the following information about a job:
- High-level job metrics
- Stage execution timeline and inter-stage dependencies
- Task concurrency chart
- Stage details
High-level job metrics
- Total runtime across all tasks: The sum of the runtime of all tasks in all stages
- Job duration: The duration of the Spark computations (time between the start of the first stage and the completion of the last stage)
With these two metrics, you can compute the parallelism ratio as
Total runtime across all tasks / Job duration
A ratio close to 1 indicates a poor parallelism.
- Disk spillage: The size of the data that has been moved from executors' RAM to disk, across all stages.
- This happens when the data cannot fit into the memory of the executor. Writing and reading to disk is a slow operation, therefore if your job spills, it will be significantly slower. Occasionally, depending on the type of computation that is happening, spilling can cause an executor to run out of memory and the job to fail.
-
Note that for large datasets, disk spillage is expected.
-
Shuffle write: The amount of data that has been shuffled during the job, across all stages.
- Shuffling is the process by which data gets moved between Spark stages and across partitions; for example, to compute a join (when none of the tables are broadcasted), perform aggregations, or apply repartitioning.
- Since shuffling leads to both network IO and disk IO, it can account for a large portion of a job's runtime.
- Therefore, a key goal of writing a performant Spark job is to minimize shuffling; for example, by ensuring that joins that can be broadcasted are in fact being broadcasted, by taking advantage of bucketing for a dataset that might often be joined or aggregated on the same keys in downstream jobs (in order to avoid downstream shuffling for this dataset), or by avoiding unnecessary repartitioning steps.
Stage execution timeline and inter-stage dependencies
At the beginning of a job, Spark interprets the code of the transform to create an execution plan, which can be represented as a set of stages with interdependencies. The following graph shows the execution timeline of the stages.
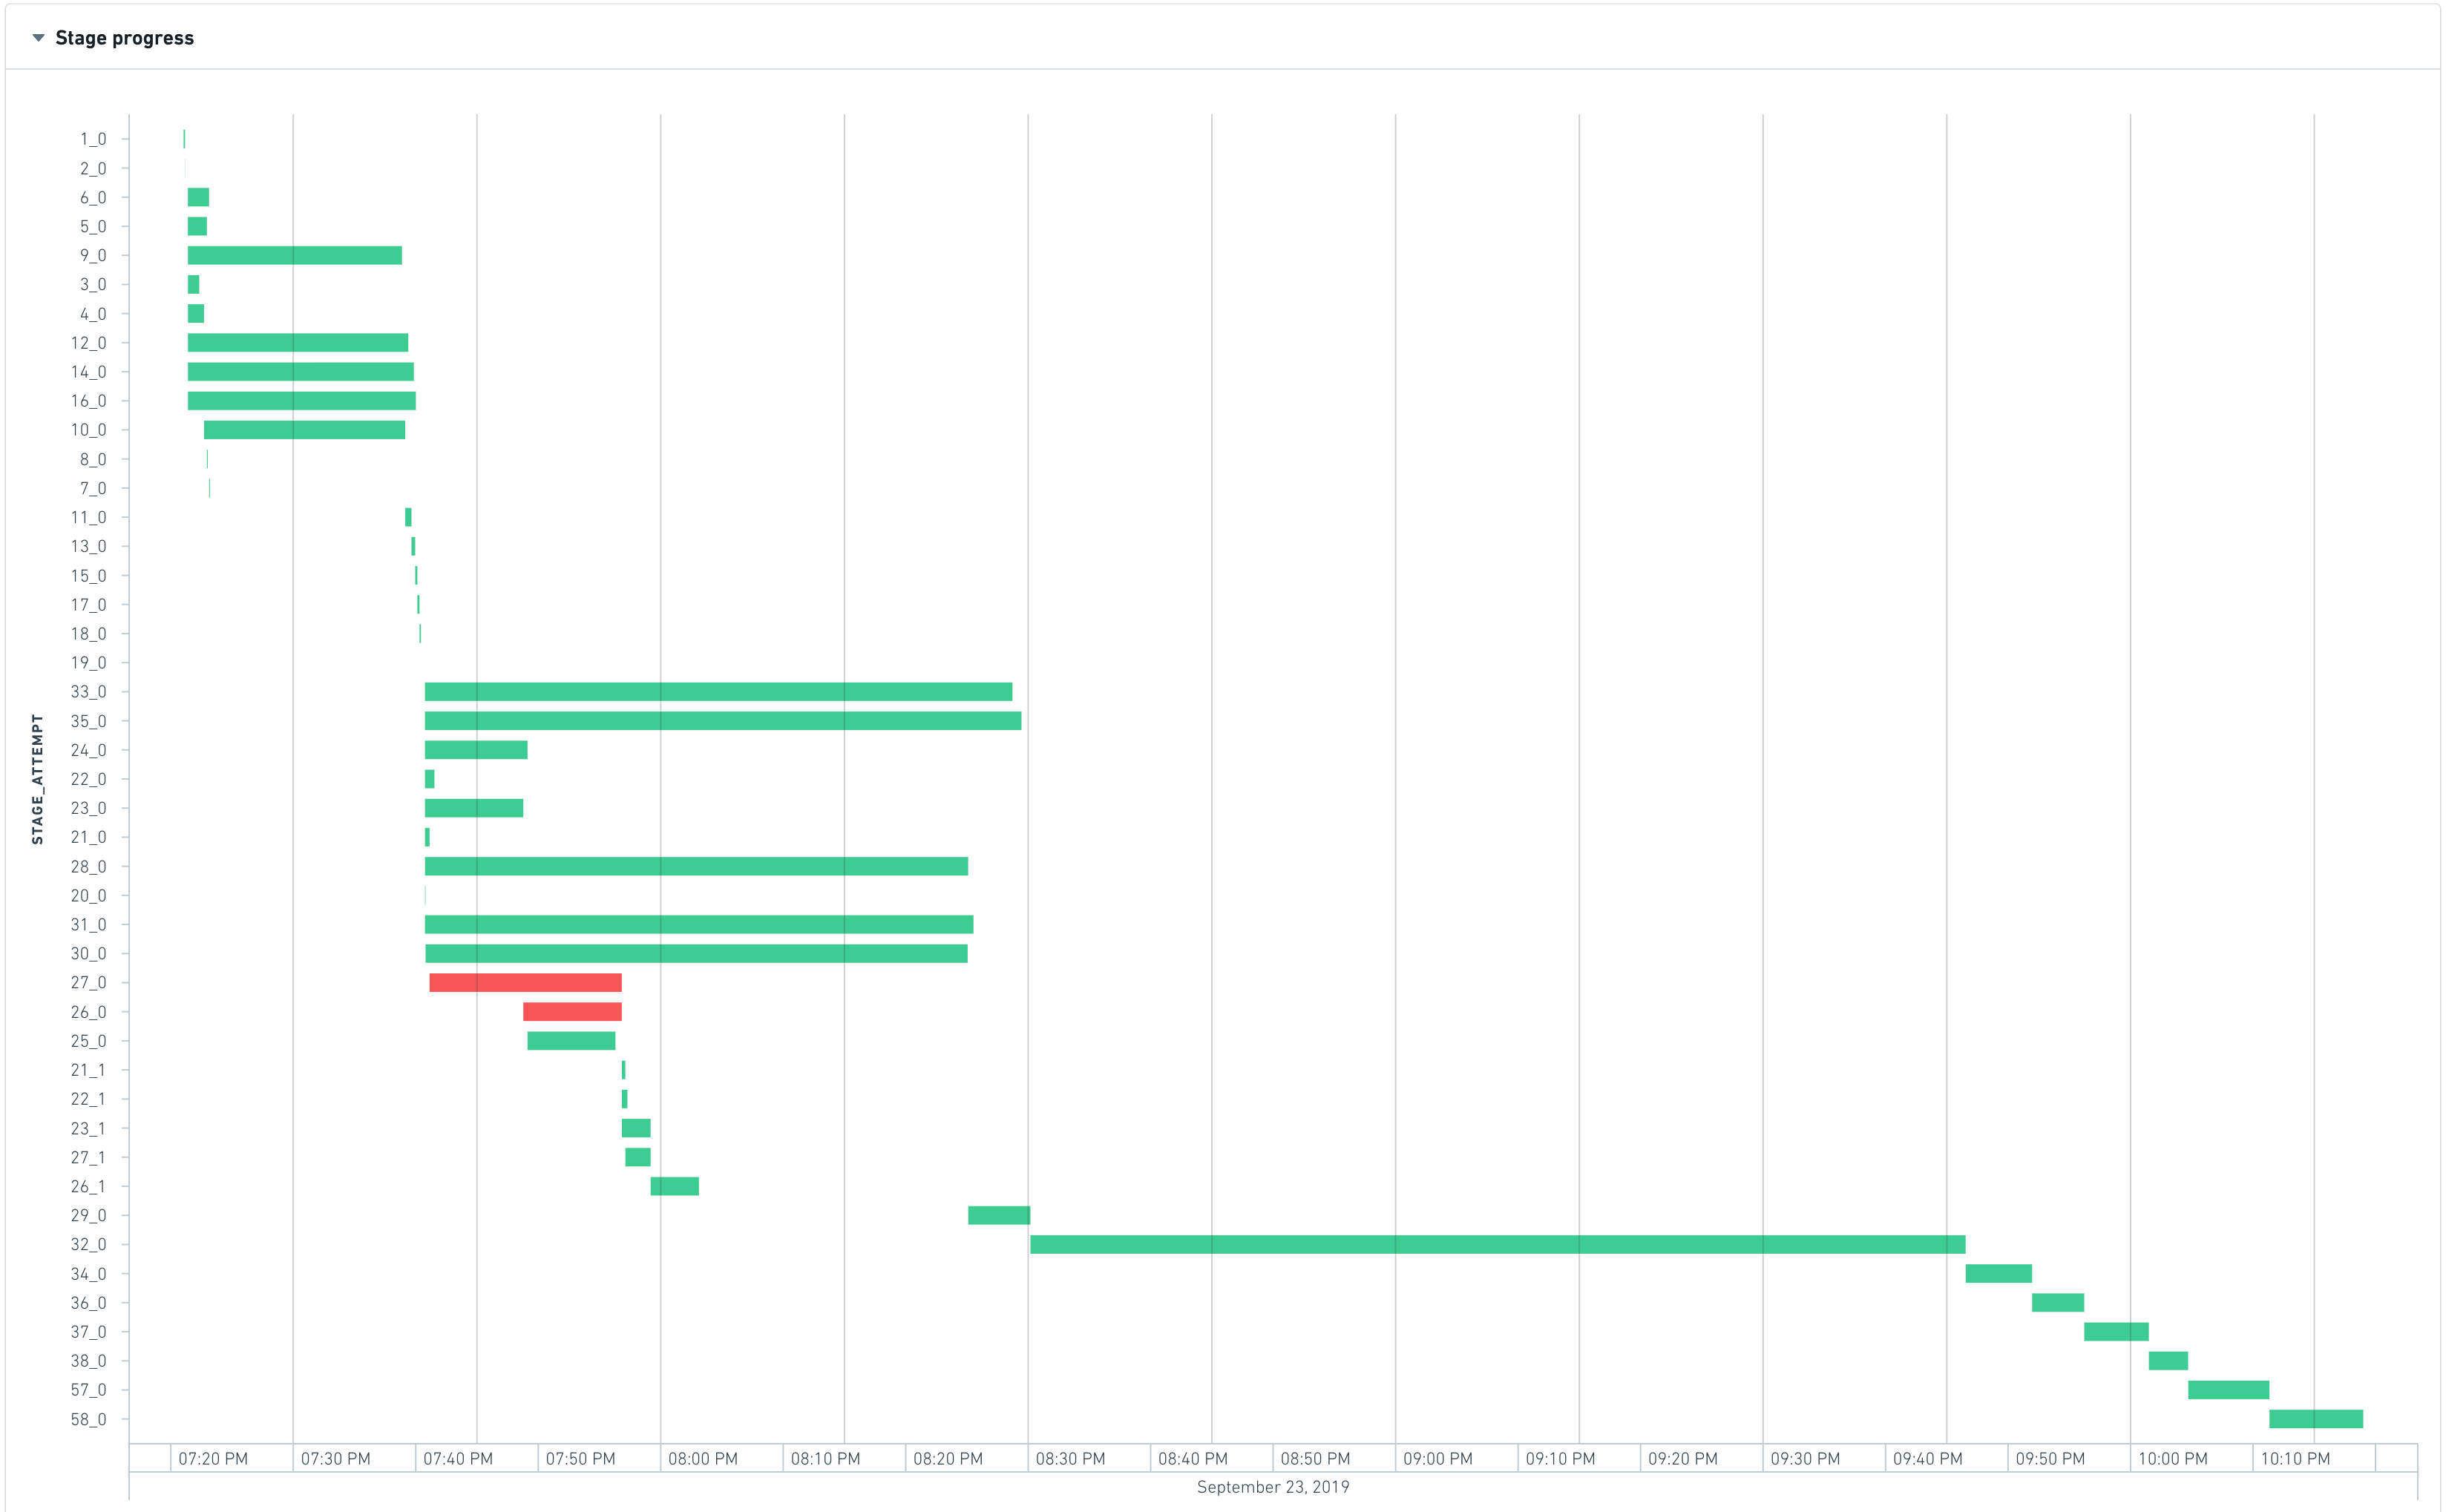
The most-left stage typically represents the loading of inputs, whereas the most-right stage typically represents the writing of the output. In the above example, stages 28, 30, 31, 32, 33, and 35 take a long time to execute, so they are good candidates for optimizing the runtime of this job.
Stages 28, 30, 31, 33, and 35 are able to run in parallel, which means that they do not have inter-dependencies. However stage 32 only starts when all the previous stages finish, which means:
- Decreasing the runtime of stage 35 will not yield any significant improvement as the waiting time is dominated by max_runtime(28, 30, 31, 33, 35). Therefore to see a visible improvement, all these stages would have to be accelerated.
- Stage 32 is the bottleneck of the job as it takes approximately 35 percent of the total job duration
Task concurrency chart
The task concurrency chart helps understand how well resources are used. It plots the stage concurrency over time. Similar to the job concurrency, the stage concurrency can be computed as:
Total runtime of tasks in the stage / Stage duration
The time axis of the task concurrency chart is shared with the Gantt chart of stages above so that it is easy to identify correlations.
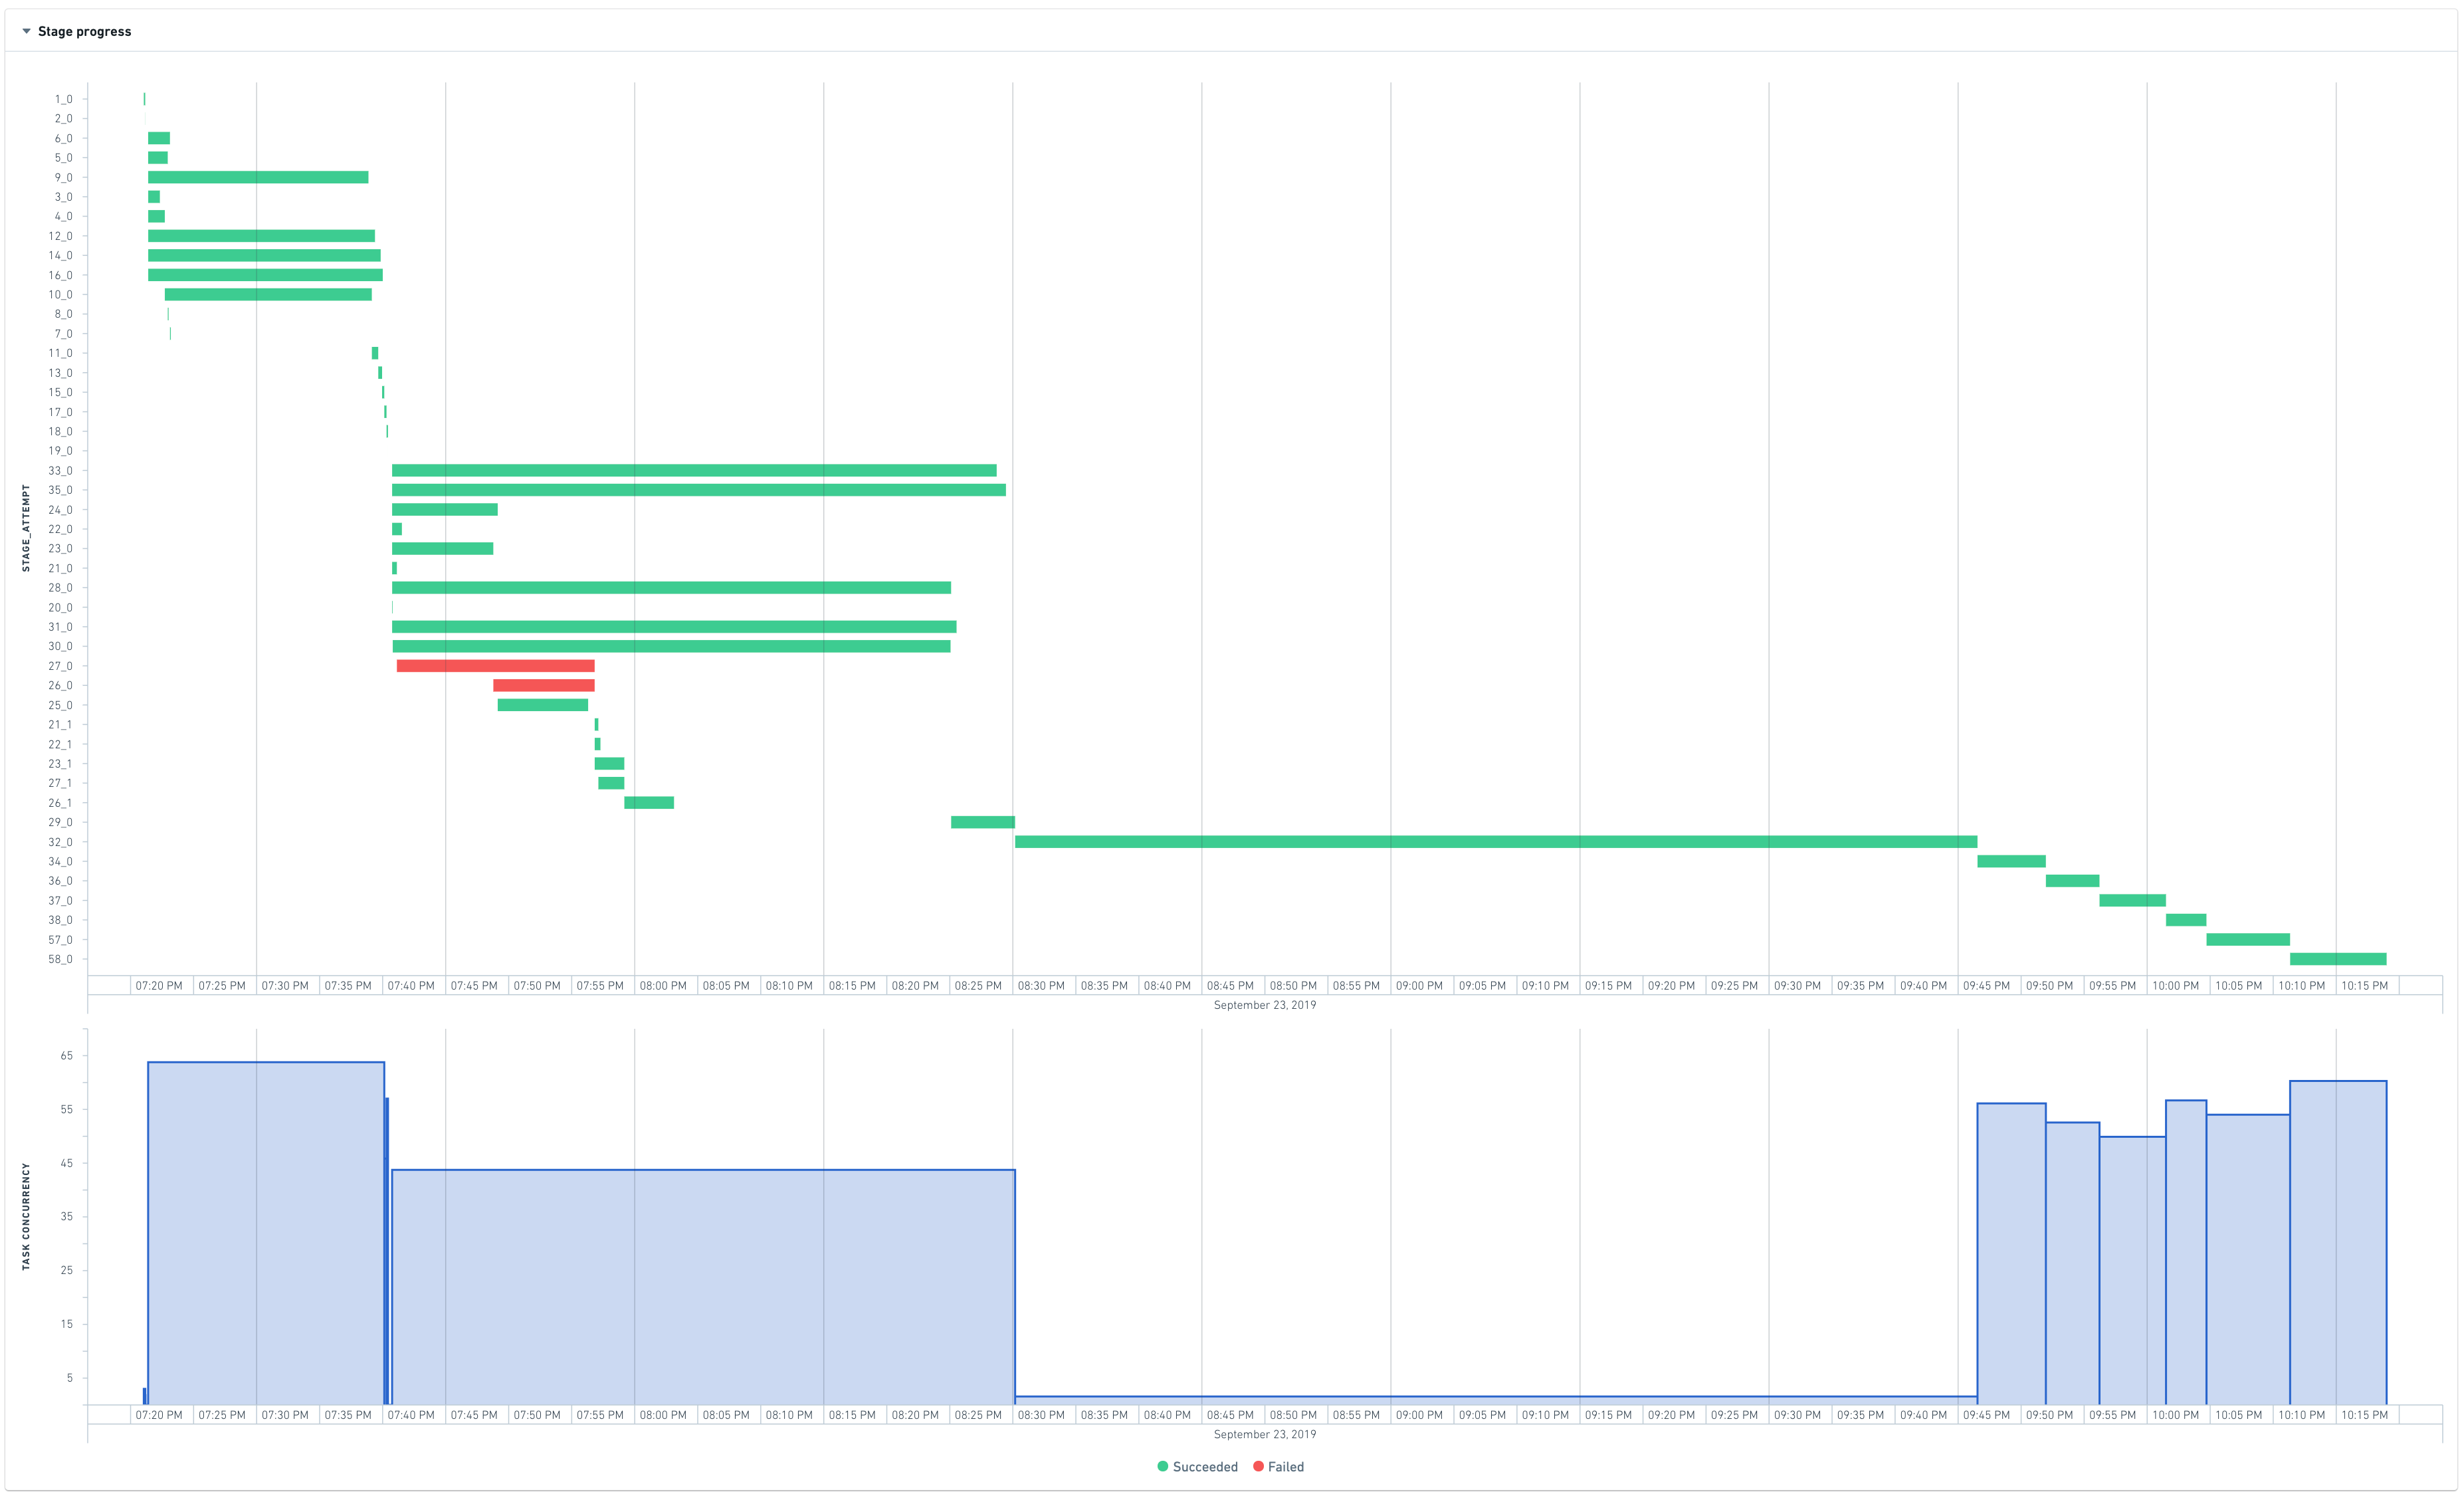
In the above chart, stage 32 has a concurrency of almost 1. This means that almost all the work performed in this stage happens in one (very long) task, indicating that the computation was not distributed.
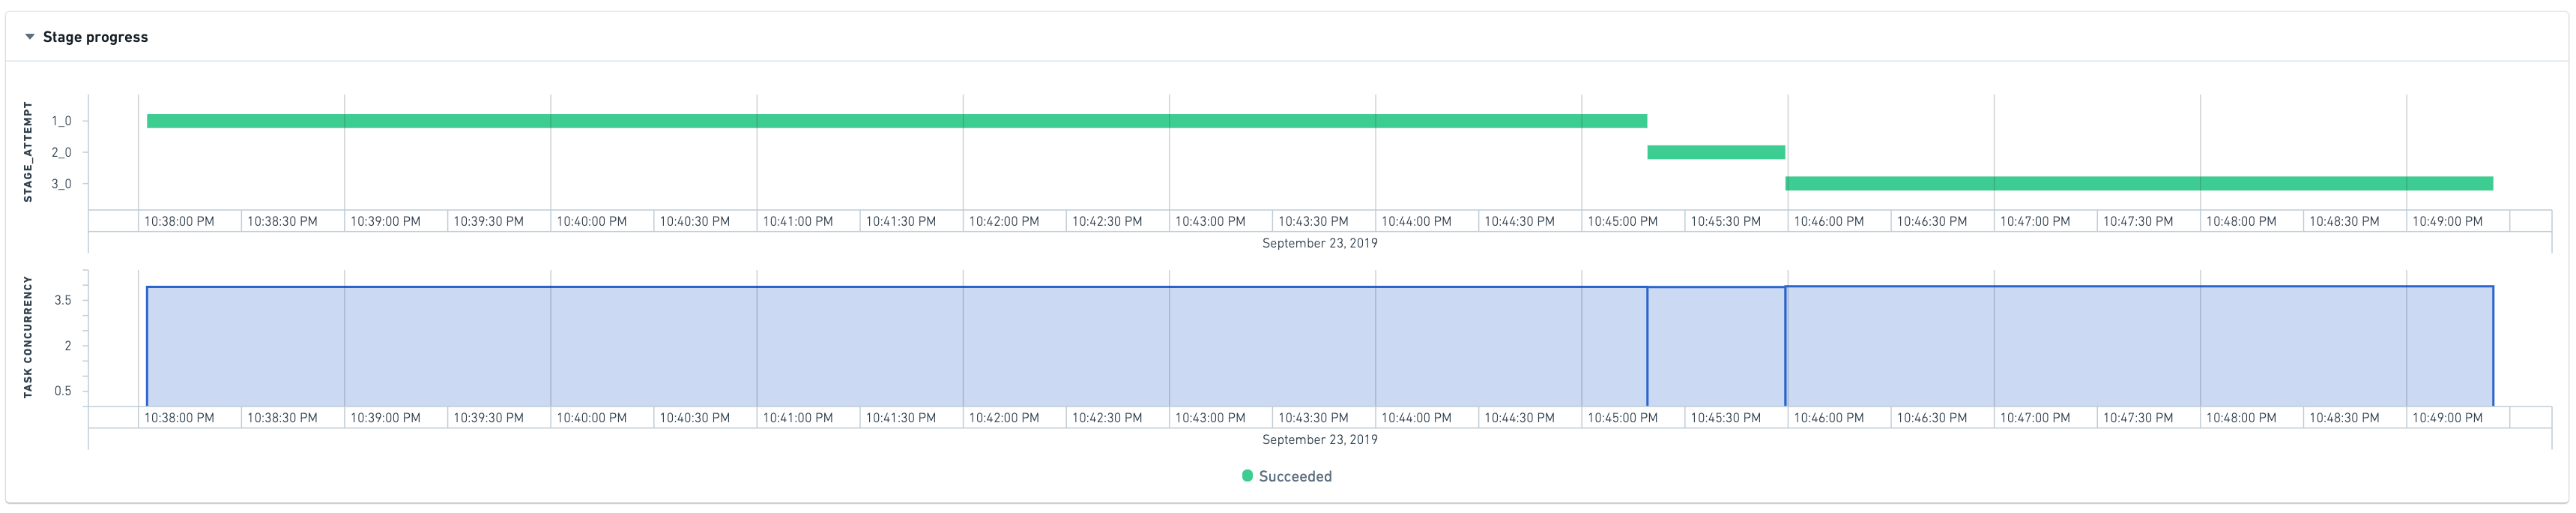
A perfectly distributed job would look like this:
Stage details
When trying to understand why a particular stage is failing or is slow, it can be useful to have more information. Unfortunately, automatically tracing what a stage is doing back to the original code or even the physical plan is not currently possible as Spark does not expose this lineage when converting the code into stages.
The stage overview still allows for some investigation of failed or long-running stages:

Half of the tasks take less than 2 seconds, but what is more interesting is the maximum runtime. One task is taking approximately 63% of the total runtime of the stage. This is consistent with the observation made on the previous charts that shows that this stage is a bottleneck and that almost all the work happens in one task.
To know more, it is possible to jump to the stage details:
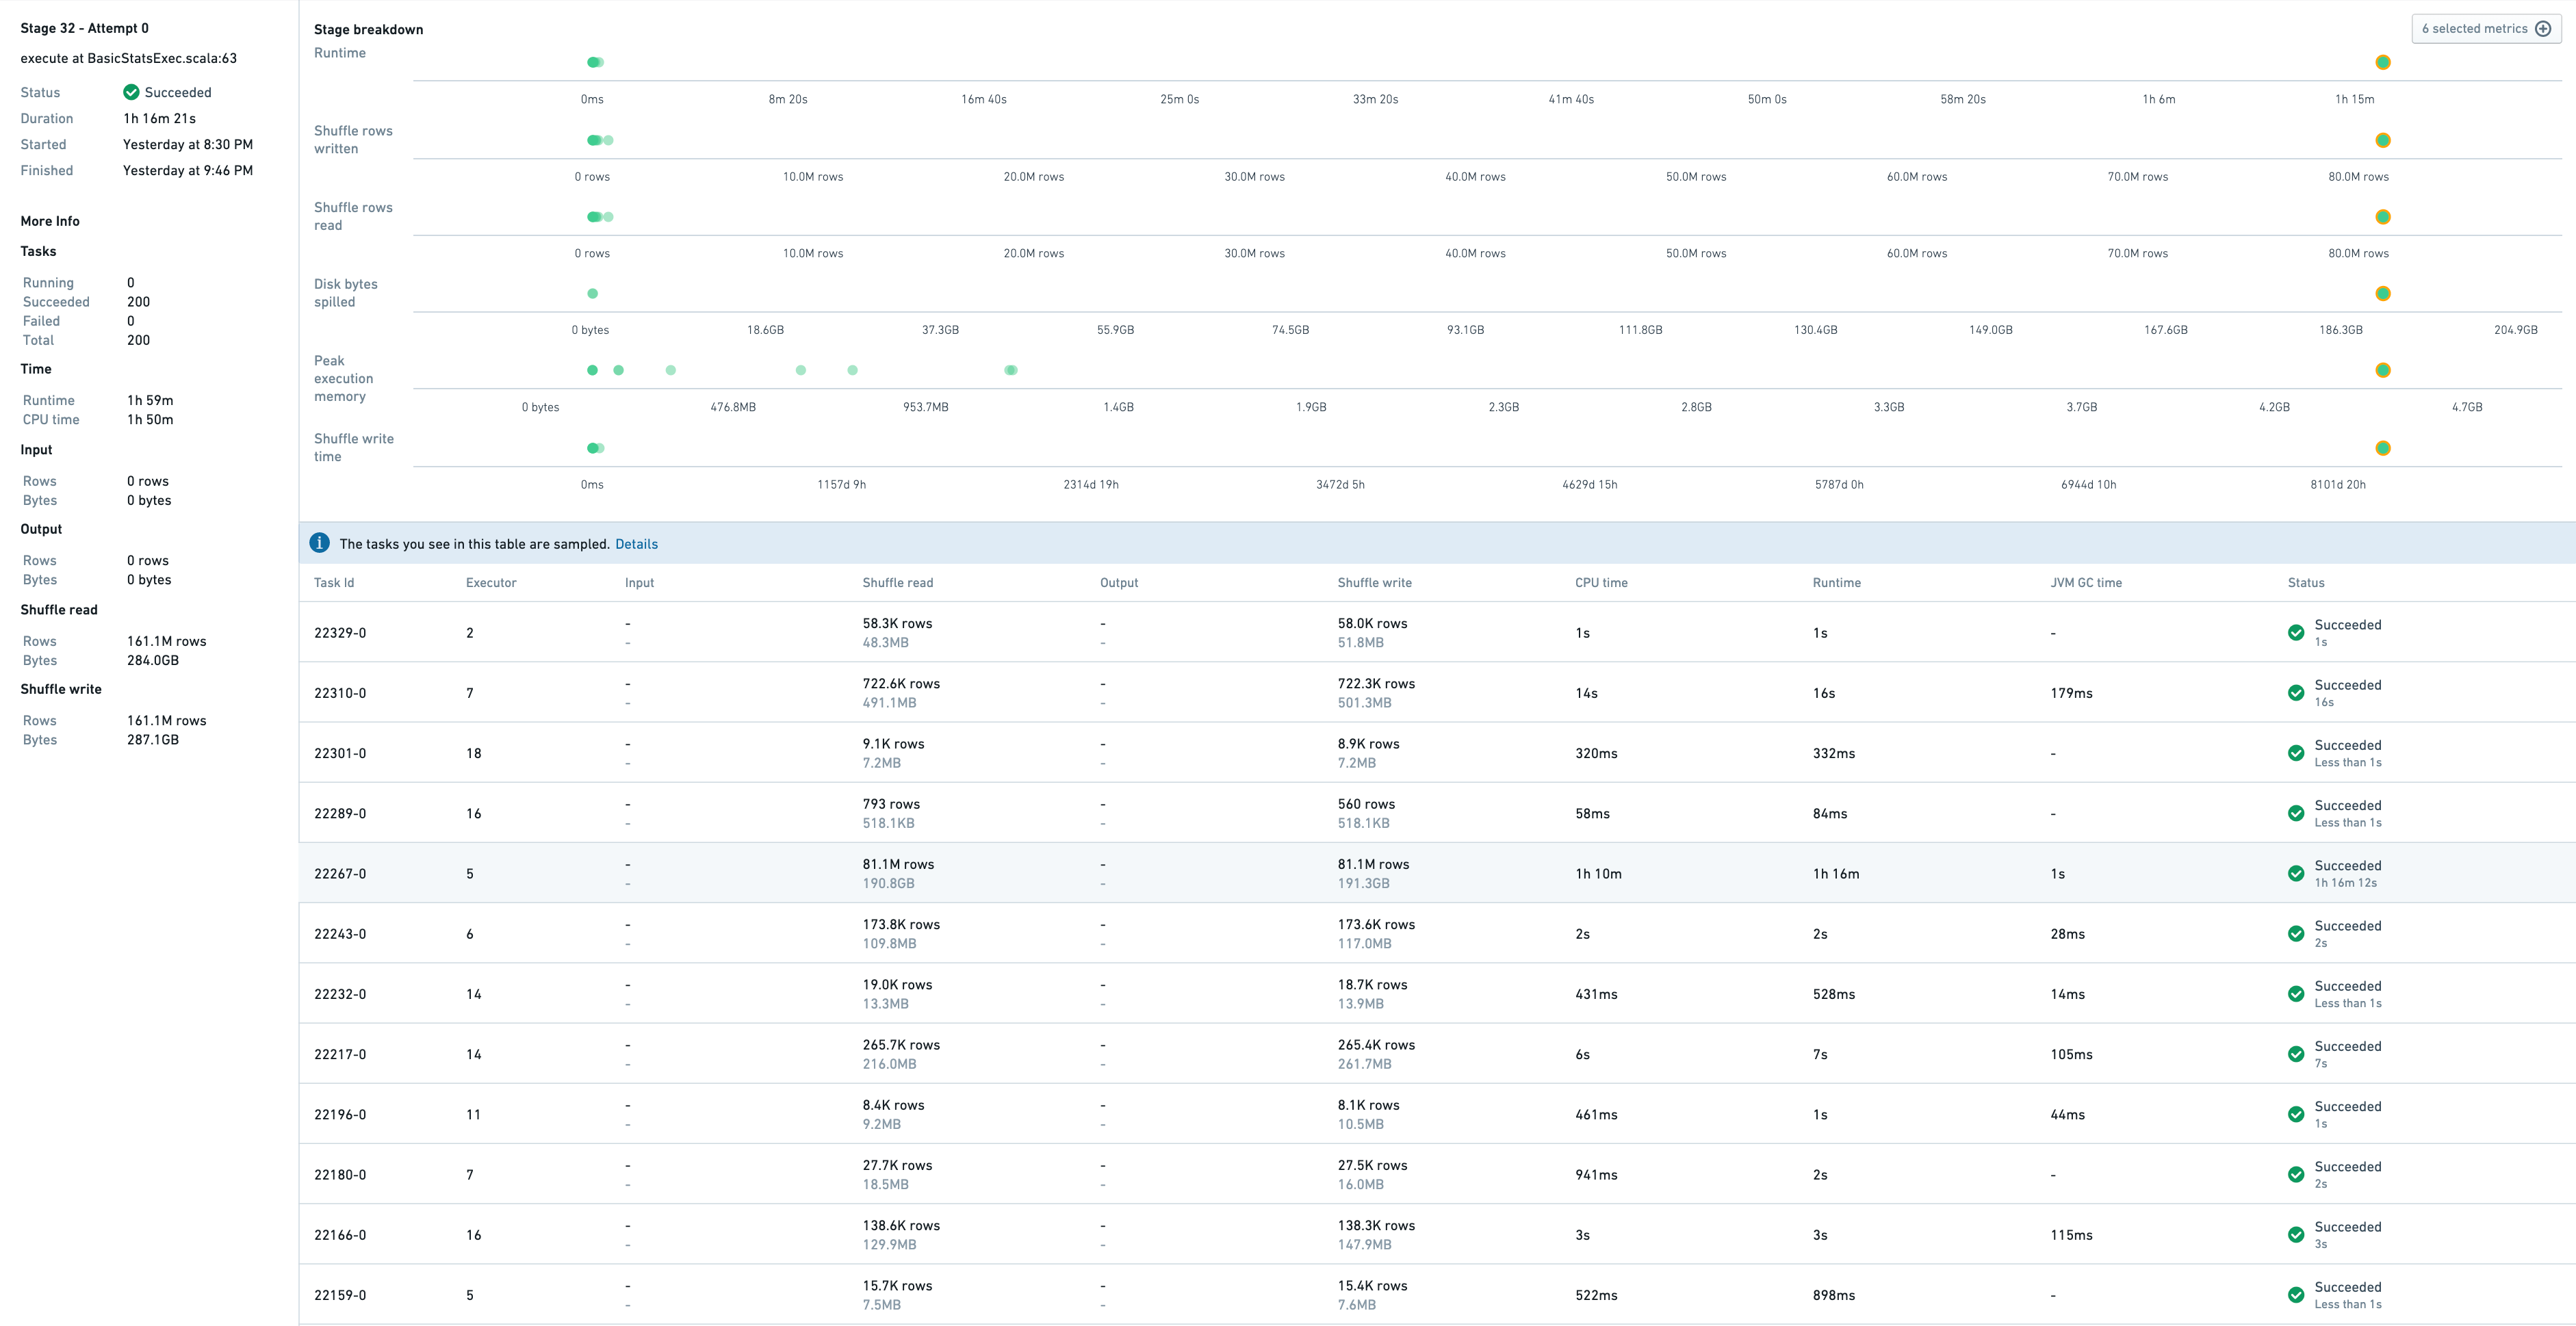
This shows a sample of tasks that have run in this stage, as well as metrics associated to stage itself.
Task 22267-0 takes 1h16, so it is the slowest one. Indeed, this task processes 81M rows whereas others process between 10K-700K rows. The symptoms of this skewness are:
- high disk spillage: 190GB vs 0 for other tasks
- high executor peak memory: 4.5GB vs 1GB for other tasks
Executors tab
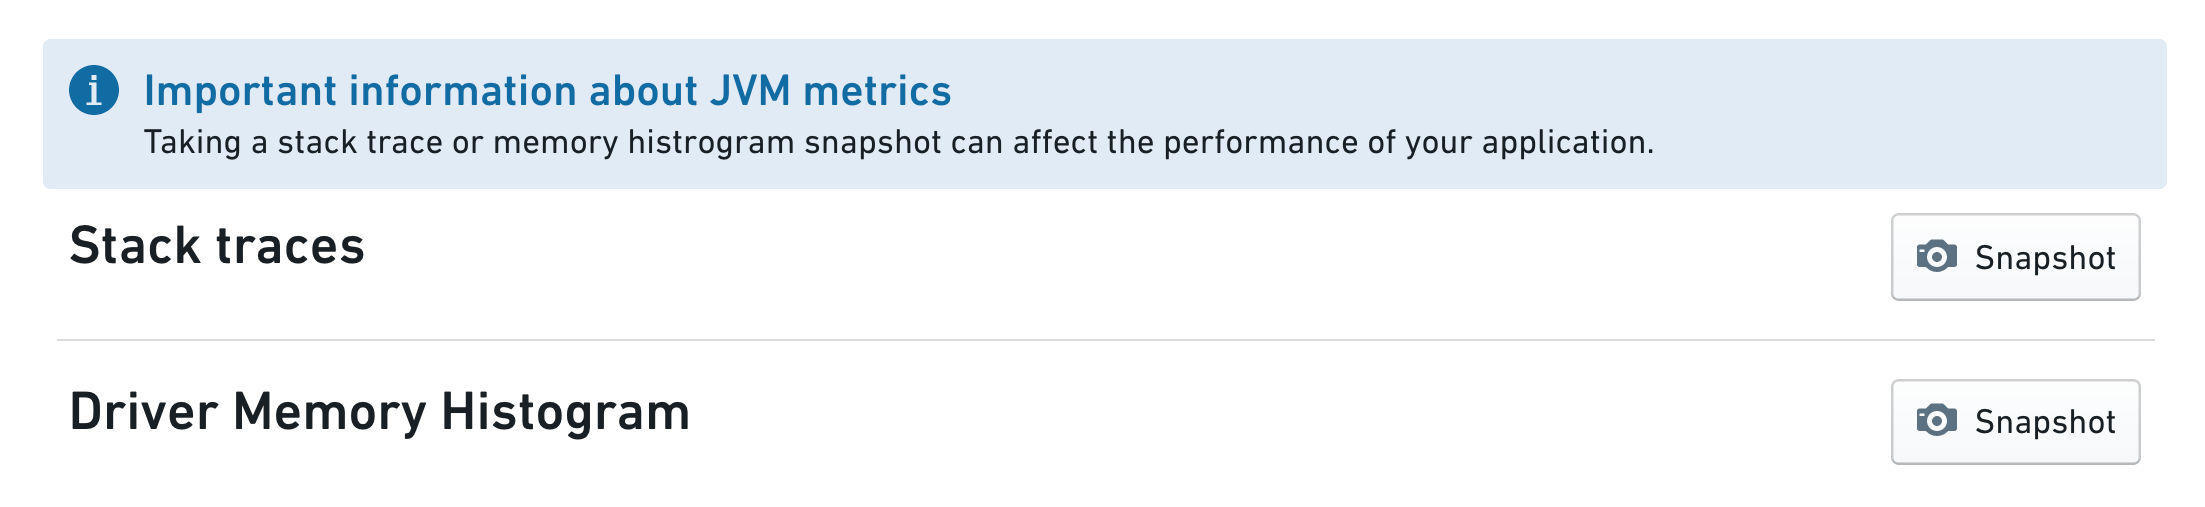
The Executors tab captures certain metrics from the Spark job's driver or executors, including stack traces and memory histograms. These metrics are useful when debugging performance issues with Spark jobs.
Selecting the Snapshot button captures either a Java stack trace or a driver-only memory histogram from the running job. The job has to be in a running state (if the job is completed, these metrics are no longer available to collect).
Stack traces are a way to see what each thread of your spark job is executing at that moment. For example if a job seems to be hanging (that is, not making progress when expected), taking a stack trace might reveal what is being executed at that time.
The Memory histogram shows the number of Java objects and their size in memory (in bytes) currently on the heap. It is useful in understanding how the memory is used and when debugging memory related issues.
Note that taking metrics may affect the performance of the running job. Collecting these metrics is additional work that needs to be done by the JVM. For example, taking a memory histogram triggers garbage collection.
中文翻译
理解 Spark 详情
Apache Spark ↗ 是 Foundry 数据集成层中最常用的执行引擎。为了理解管线的性能特征并找到优化管线的方法,了解代码在 Spark 中的执行细节至关重要。Foundry 提供了集成工具,帮助您查看和理解作业在 Spark 中的性能表现。本页面概述了可用的 Spark 详情,并提供了这些详情含义的指导说明。
查看 Spark 详情
对于在 Foundry 中构建的任何数据集,请按照以下步骤查看 Spark 详情:
- 查看构建报告(Build report)。
- 从数据集预览(Dataset Preview)或数据谱系(Data Lineage)中,选择 历史(History) 选项卡,在列表中选择单个构建,然后选择 查看构建报告(View build report)。
- 从所有构建(All builds)视图中,直接选择列表中的某个构建。
- 选择作业(Job)。一个构建由一个或多个作业组成,这些作业显示在甘特图(Gantt chart)下方的列表中。从列表中选择一个作业,然后选择 Spark 详情(Spark details) 按钮:
Spark 详情页面提供有关作业在 Spark 中执行情况的信息。对于每个作业,Spark 详情页面会按以下类别显示信息:
概览(Overview)选项卡
概览选项卡提供有关作业的以下信息:
- 高级作业指标(High-level job metrics)
- 阶段执行时间线和阶段间依赖关系(Stage execution timeline and inter-stage dependencies)
- 任务并发图表(Task concurrency chart)
- 阶段详情(Stage details)
高级作业指标(High-level job metrics)
- 所有任务的总运行时间(Total runtime across all tasks): 所有阶段中所有任务的运行时间总和
- 作业持续时间(Job duration): Spark 计算的持续时间(从第一阶段开始到最后一个阶段完成之间的时间)
通过这两个指标,可以计算并行度比率(parallelism ratio):
所有任务的总运行时间 / 作业持续时间
比率接近 1 表示并行度较差。
- 磁盘溢出(Disk spillage): 所有阶段中,从执行器(executor)的 RAM 移动到磁盘的数据大小。
- 当数据无法容纳在执行器的内存中时会发生这种情况。写入和读取磁盘是较慢的操作,因此如果作业发生溢出,其速度会显著变慢。偶尔,根据正在执行的计算类型,溢出可能导致执行器内存不足,从而导致作业失败。
-
请注意,对于大型数据集,磁盘溢出是预期现象。
-
Shuffle 写入(Shuffle write): 作业期间所有阶段中经过 Shuffle 的数据量。
- Shuffle 是数据在 Spark 阶段之间和分区之间移动的过程;例如,计算连接(当没有表被广播时)、执行聚合操作或应用重新分区。
- 由于 Shuffle 会导致网络 IO 和磁盘 IO,因此它可能占作业运行时间的很大一部分。
- 因此,编写高性能 Spark 作业的一个关键目标是尽量减少 Shuffle;例如,通过确保可以广播的连接确实被广播,利用分桶(bucketing)处理可能在下游作业中经常基于相同键进行连接或聚合的数据集(以避免该数据集在下游发生 Shuffle),或避免不必要的重新分区步骤。
阶段执行时间线和阶段间依赖关系(Stage execution timeline and inter-stage dependencies)
在作业开始时,Spark 会解释转换(transform)的代码以创建执行计划,该计划可以表示为一组具有相互依赖关系的阶段。下图显示了阶段的执行时间线。
最左侧的阶段通常表示输入加载,而最右侧的阶段通常表示输出写入。 在上述示例中,阶段 28、30、31、32、33 和 35 执行时间较长,因此它们是优化此作业运行时间的主要候选对象。
阶段 28、30、31、33 和 35 能够并行运行,这意味着它们之间没有相互依赖关系。然而,阶段 32 只有在所有先前阶段完成后才开始,这意味着:
- 减少阶段 35 的运行时间不会带来显著改善,因为等待时间由 max_runtime(28, 30, 31, 33, 35) 主导。因此,要看到明显的改进,必须加速所有这些阶段。
- 阶段 32 是作业的瓶颈,因为它大约占作业总持续时间的 35%。
任务并发图表(Task concurrency chart)
任务并发图表有助于了解资源的使用情况。它绘制了阶段并发度随时间变化的曲线。与作业并发度类似,阶段并发度可以计算为:
阶段中任务的总运行时间 / 阶段持续时间
任务并发图表的时间轴与上方阶段的甘特图共享,以便于识别相关性。
在上图中,阶段 32 的并发度几乎为 1。这意味着该阶段中几乎所有工作都在一个(非常长的)任务中完成,表明计算未被分布处理。
一个完美分布式的作业应如下所示:
阶段详情(Stage details)
当试图理解某个阶段为何失败或运行缓慢时,获取更多信息会很有帮助。遗憾的是,目前无法自动将阶段执行的操作追溯到原始代码甚至物理计划,因为 Spark 在将代码转换为阶段时不会暴露这种谱系(lineage)。
阶段概览仍然允许对失败或长时间运行的阶段进行一些调查:
一半的任务耗时不到 2 秒,但更有趣的是最大运行时间。一个任务大约占该阶段总运行时间的 63%。这与之前图表中观察到的现象一致,即该阶段是瓶颈,几乎所有工作都在一个任务中完成。
要了解更多信息,可以跳转到阶段详情:
这显示了在该阶段中运行的任务样本,以及与阶段本身相关的指标。
任务 22267-0 耗时 1 小时 16 分钟,因此是最慢的任务。实际上,该任务处理了 8100 万行数据,而其他任务处理的数据量在 1 万到 70 万行之间。这种倾斜(skewness)的症状包括:
- 高磁盘溢出:190GB,而其他任务为 0
- 高执行器峰值内存:4.5GB,而其他任务为 1GB
执行器(Executors)选项卡
执行器(Executors) 选项卡捕获来自 Spark 作业驱动程序(driver)或执行器的某些指标,包括堆栈跟踪(stack traces)和内存直方图(memory histograms)。这些指标在调试 Spark 作业的性能问题时非常有用。
选择 快照(Snapshot) 按钮可从正在运行的作业中捕获 Java 堆栈跟踪或仅驱动程序的(Driver-only)内存直方图。作业必须处于运行状态(如果作业已完成,则这些指标不再可收集)。
堆栈跟踪是一种查看 Spark 作业每个线程当前正在执行什么操作的方法。例如,如果某个作业似乎挂起(即未按预期推进),获取堆栈跟踪可能会揭示当时正在执行的操作。
内存直方图显示当前堆上的 Java 对象数量及其内存大小(以字节为单位)。它有助于理解内存的使用情况,并在调试与内存相关的问题时非常有用。
请注意,获取指标可能会影响正在运行的作业的性能。收集这些指标是 JVM 需要执行的额外工作。例如,获取内存直方图会触发垃圾回收(garbage collection)。