Getting started(入门指南)
Set up the dataset
This tutorial uses a publicly-available dataset (download titanic_dataset.csv) containing information about passengers on the Titanic.
The dataset includes name, age, sex, and other identifying information about passengers on the Titanic. Navigate to Foundry and open your personal Project. Create a folder named Code Workbook Tutorial and upload the Titanic dataset there, naming it titanic_dataset.
Set up a Code Workbook
Click the New button in the Project and select Code Workbook to create a new Workbook.
Import a dataset
Click Import Dataset to begin. In the dialog that appears, search for titanic_dataset. Choose the file you created during the setup process, which should be in /user/Code Workbook Tutorial/titanic_dataset.
Once you have identified the desired dataset, click on the file and then click Select to add the dataset to your graph.
Transforming data using Python
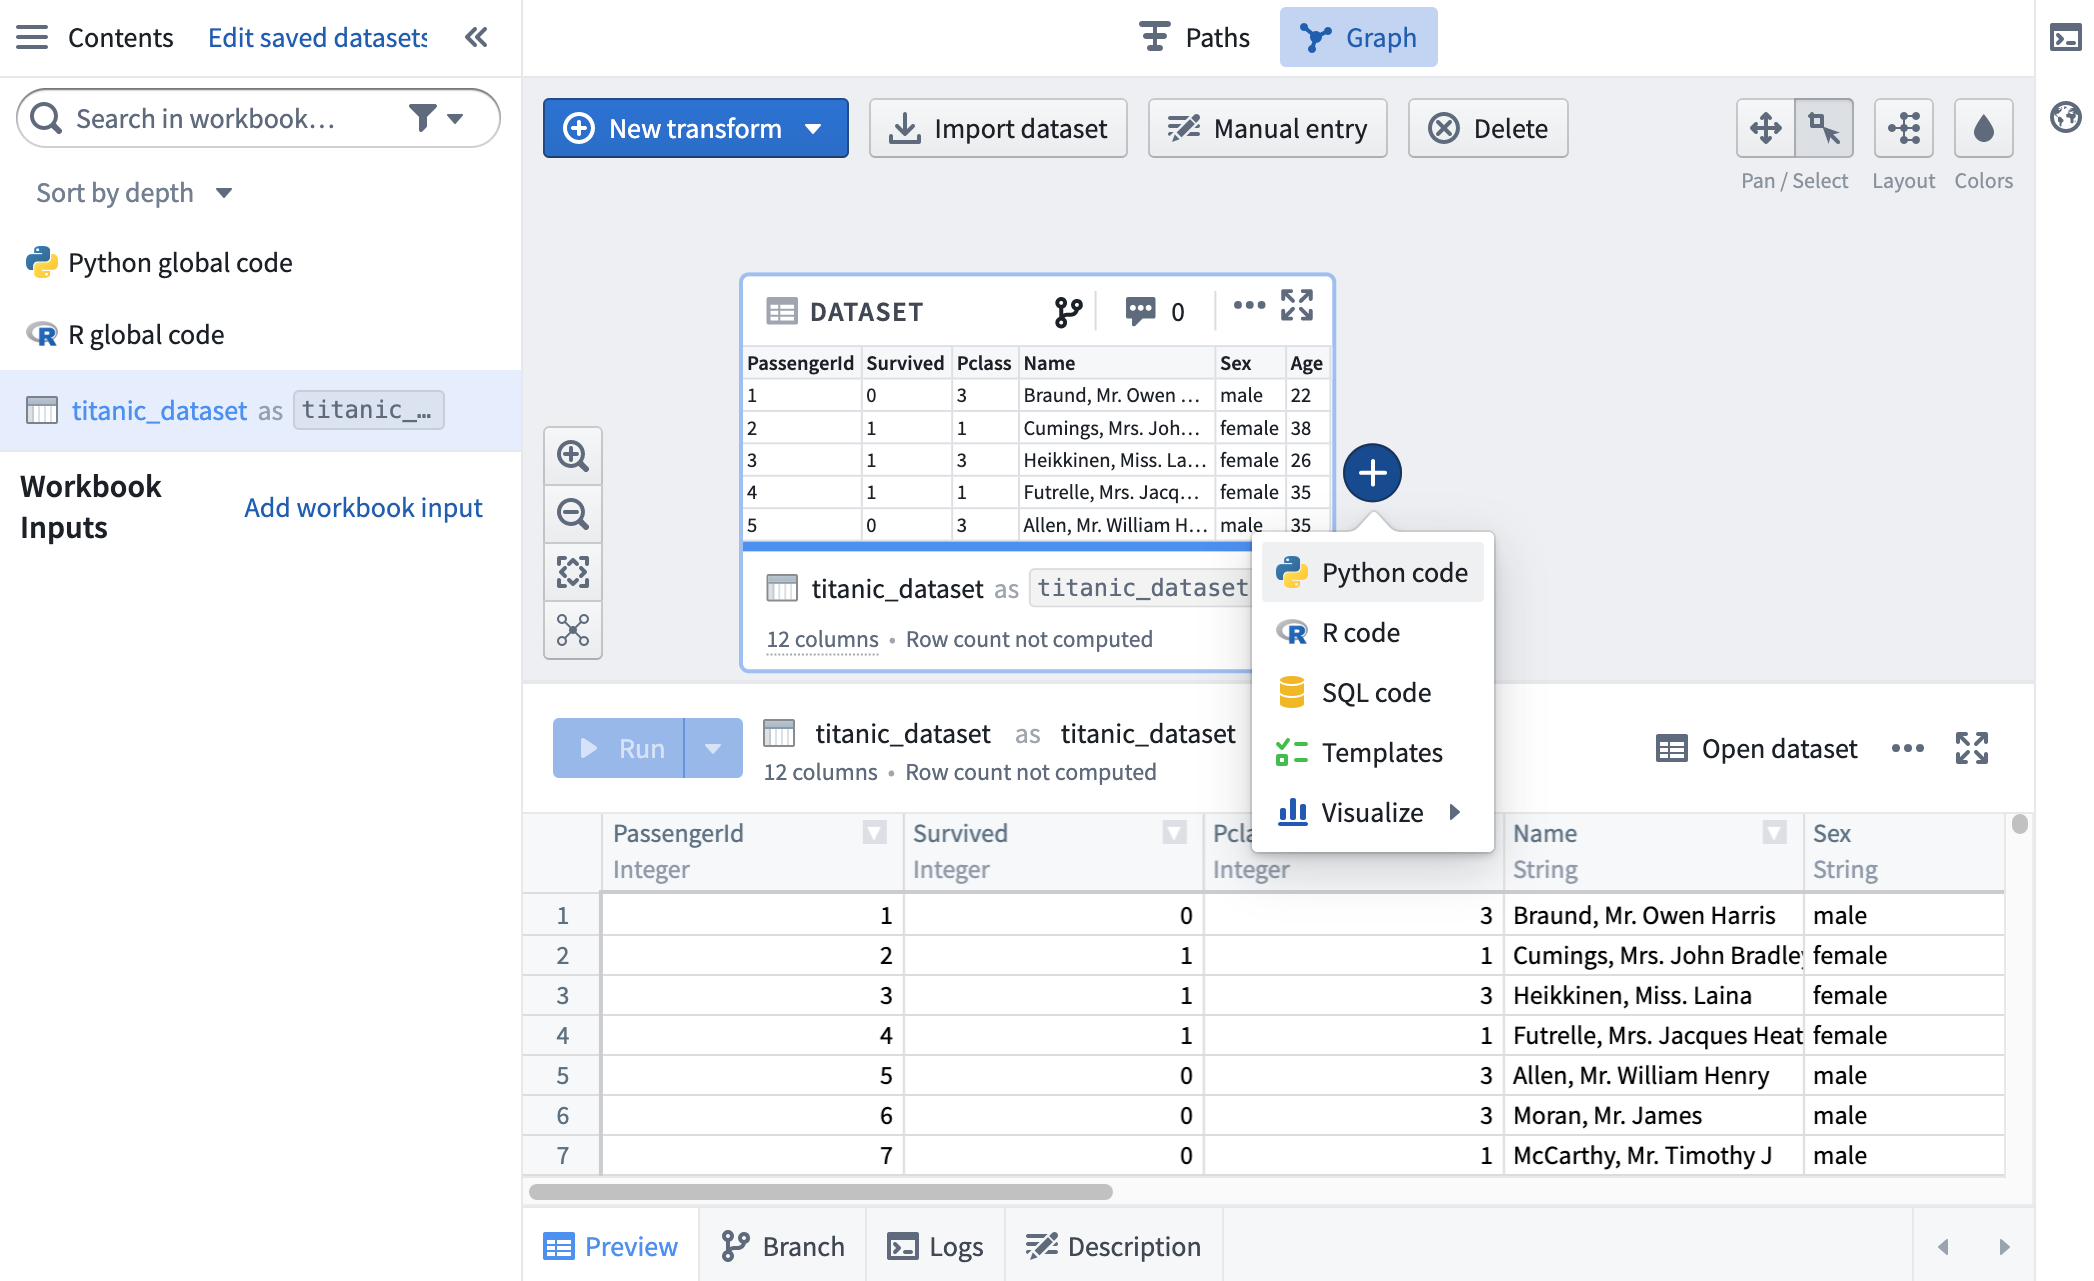
Now that titanic_dataset is imported into the workbook, we can transform it using code and pieces of reusable logic. Add a downstream transform by hovering over titanic_dataset and clicking the + sign. This brings up a dropdown showing various transformation options - choose Python.
A Python code node now appears on the graph, with a connecting line showing it is a child of titanic_dataset. Give this transform an alias, titanic_filtered, by clicking into the text box at the top of the logic tab.
By default, newly created transforms are not saved as datasets in Foundry. You can choose to save the results of a transform as a dataset by clicking on the Save as dataset toggle. Learn more about saving transforms as datasets. Transforms that are saved as datasets have two names: the alias, and the name of the Foundry dataset.
Using a Pandas dataframe
If you are more comfortable using Pandas syntax, you are able to use Pandas in Python nodes. Let's update titanic_filtered to use Pandas.
First, we need to change the input type of titanic_dataset. Click into the Inputs tab in the logic panel and expand the sidebar. You'll see that the Input Type is set as Spark dataframe. Click the dropdown and select Pandas dataframe to change the input type of titanic_dataset to a Pandas dataframe.
Next, let's update our code to work with a Pandas dataframe. We'll perform the same filter.
def titanic_filtered(titanic_dataset):
    output_df = titanic_dataset[(titanic_dataset['Survived'] == 1) & (titanic_dataset['Sex'] == 'female')]
    return output_df
This code will output a Pandas dataframe with the female Titanic survivors.
Using Console
The console provides a REPL (read-evaluate-print loop) for Code Workbook, enabling rapid, ad-hoc analysis of any transform or input dataset on the graph. To allow for quick iteration in your preferred language, there is a console for each enabled language in your workbook.
Open the console, located on the right hand side of the page. Choose the Python console:

You can quickly experiment with the data by executing commands in Python. You can also send code from a transform to run in the console by highlighting the code and using the keyboard shortcut Cmd+Shift+Enter (macOS) or Ctrl+Shift+Enter (Windows).
First, you must import the following PySpark SQL functions in the Python console:
import pyspark.sql.functions as F
Then, determine the maximum age of female Titanic survivors:
titanic_filtered.select(F.max('Age')).show()
You can also use the SQL console to calculate the same statistic:
SELECT max(Age) AS max_age FROM titanic_filtered
中文翻译
入门指南
设置数据集
本教程使用一个公开数据集(下载 titanic_dataset.csv),其中包含泰坦尼克号乘客的相关信息。
该数据集包括乘客的姓名、年龄、性别及其他身份信息。请导航至 Foundry 并打开您的个人项目(Project)。创建一个名为 Code Workbook Tutorial 的文件夹,并将泰坦尼克号数据集上传至该文件夹,命名为 titanic_dataset。
设置代码工作簿(Code Workbook)
在项目中点击 新建(New) 按钮,然后选择 代码工作簿(Code Workbook) 以创建一个新的工作簿。
导入数据集
点击 导入数据集(Import Dataset) 开始操作。在弹出的对话框中,搜索 titanic_dataset。选择您在设置过程中创建的文件,该文件应位于 /user/Code Workbook Tutorial/titanic_dataset。
找到所需数据集后,点击该文件,然后点击 选择(Select) 将数据集添加到您的图表中。
使用 Python 转换数据
现在 titanic_dataset 已导入工作簿,我们可以通过代码和可复用的逻辑片段对其进行转换。将鼠标悬停在 titanic_dataset 上,点击 + 号,添加一个下游转换(downstream transform)。此时会弹出一个下拉菜单,显示多种转换选项——请选择 Python。
此时图表上会出现一个 Python 代码节点,并用一条连接线显示它是 titanic_dataset 的子节点。点击逻辑选项卡顶部的文本框,为该转换设置别名 titanic_filtered。
默认情况下,新创建的转换不会作为数据集保存在 Foundry 中。您可以通过点击 另存为数据集(Save as dataset) 开关,选择将转换结果保存为数据集。了解更多关于将转换保存为数据集的信息。 保存为数据集的转换有两个名称:别名和 Foundry 数据集名称。
使用 Pandas 数据框(DataFrame)
如果您更习惯使用 Pandas 语法,可以在 Python 节点中使用 Pandas。让我们更新 titanic_filtered 以使用 Pandas。
首先,我们需要更改 titanic_dataset 的输入类型。点击逻辑面板中的 输入(Inputs) 选项卡,展开侧边栏。您会看到输入类型(Input Type)设置为 Spark 数据框(Spark dataframe)。点击下拉菜单,选择 Pandas 数据框(Pandas dataframe),将 titanic_dataset 的输入类型更改为 Pandas 数据框。
接下来,让我们更新代码以适配 Pandas 数据框。我们将执行相同的过滤操作。
def titanic_filtered(titanic_dataset):
    output_df = titanic_dataset[(titanic_dataset['Survived'] == 1) & (titanic_dataset['Sex'] == 'female')]
    return output_df
这段代码将输出一个包含泰坦尼克号女性幸存者的 Pandas 数据框。
使用控制台(Console)
控制台为代码工作簿(Code Workbook)提供了一个 REPL(读取-求值-输出循环)环境,支持对图表中的任何转换或输入数据集进行快速、临时的分析。为了便于使用您偏好的语言进行快速迭代,工作簿中每种启用的语言都配有对应的控制台。
打开页面右侧的控制台。选择 Python 控制台:
您可以通过在 Python 中执行命令来快速试验数据。您也可以选中转换中的代码,使用键盘快捷键 Cmd+Shift+Enter(macOS)或 Ctrl+Shift+Enter(Windows)将代码发送到控制台运行。
首先,您需要在 Python 控制台中导入以下 PySpark SQL 函数:
import pyspark.sql.functions as F
然后,计算泰坦尼克号女性幸存者的最大年龄:
titanic_filtered.select(F.max('Age')).show()
您也可以使用 SQL 控制台计算相同的统计量:
SELECT max(Age) AS max_age FROM titanic_filtered