Multi-node templates(多节点模板(Multi-node templates))
Code Workbook supports multi-node templates for templatized workflows. A template can be created from multiple other templates, and you can bind the values of parameters in these templates together.
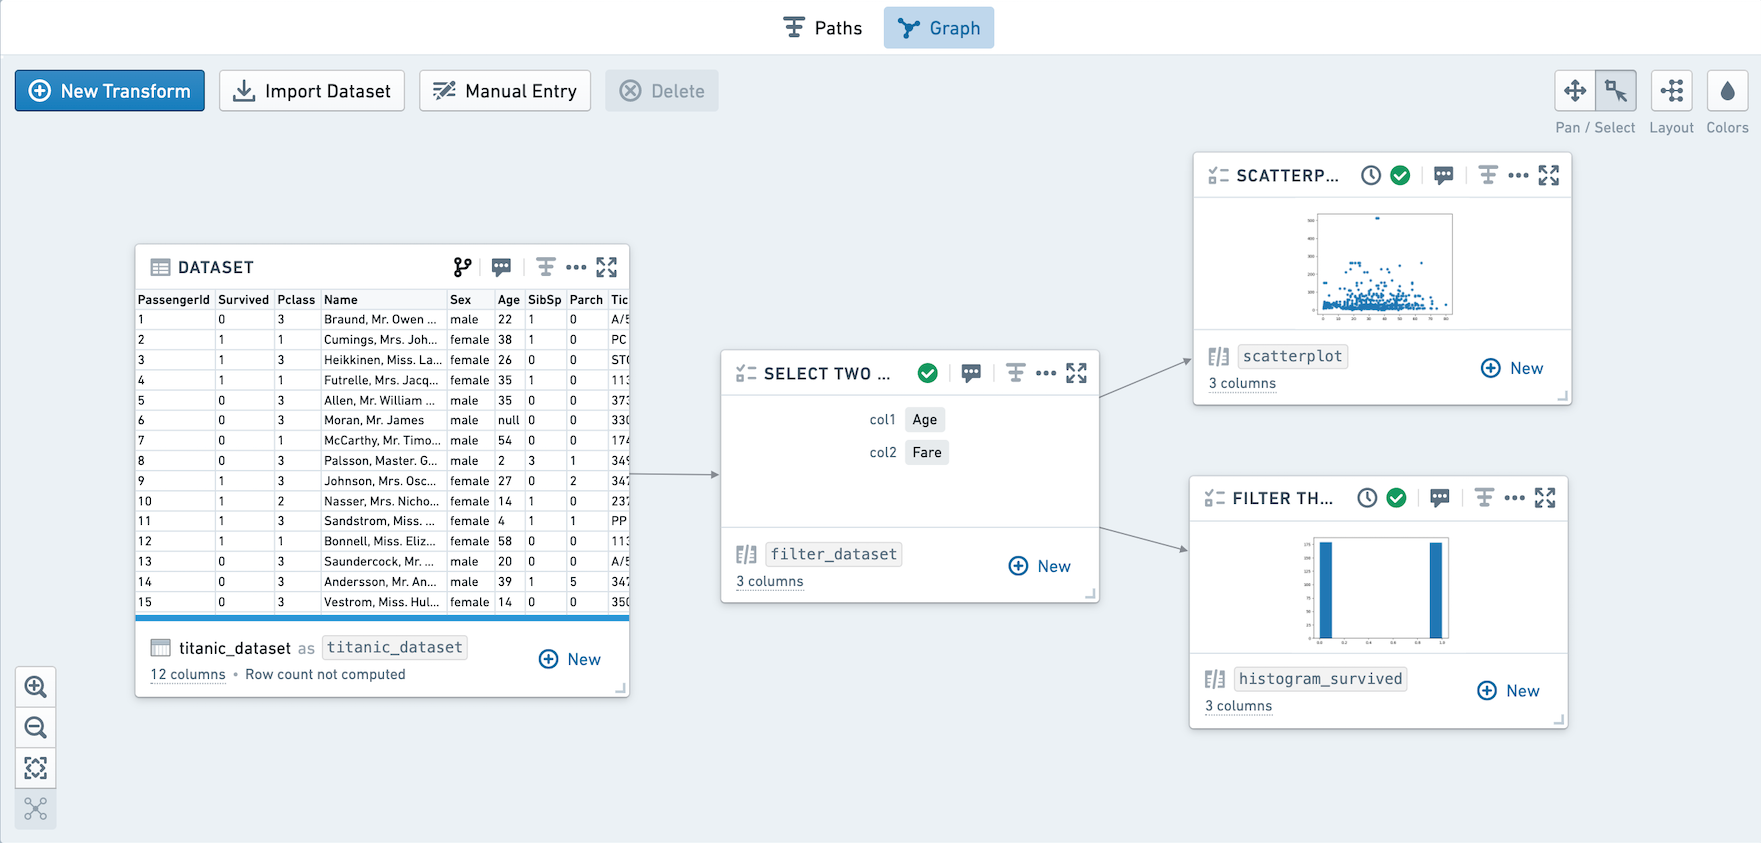
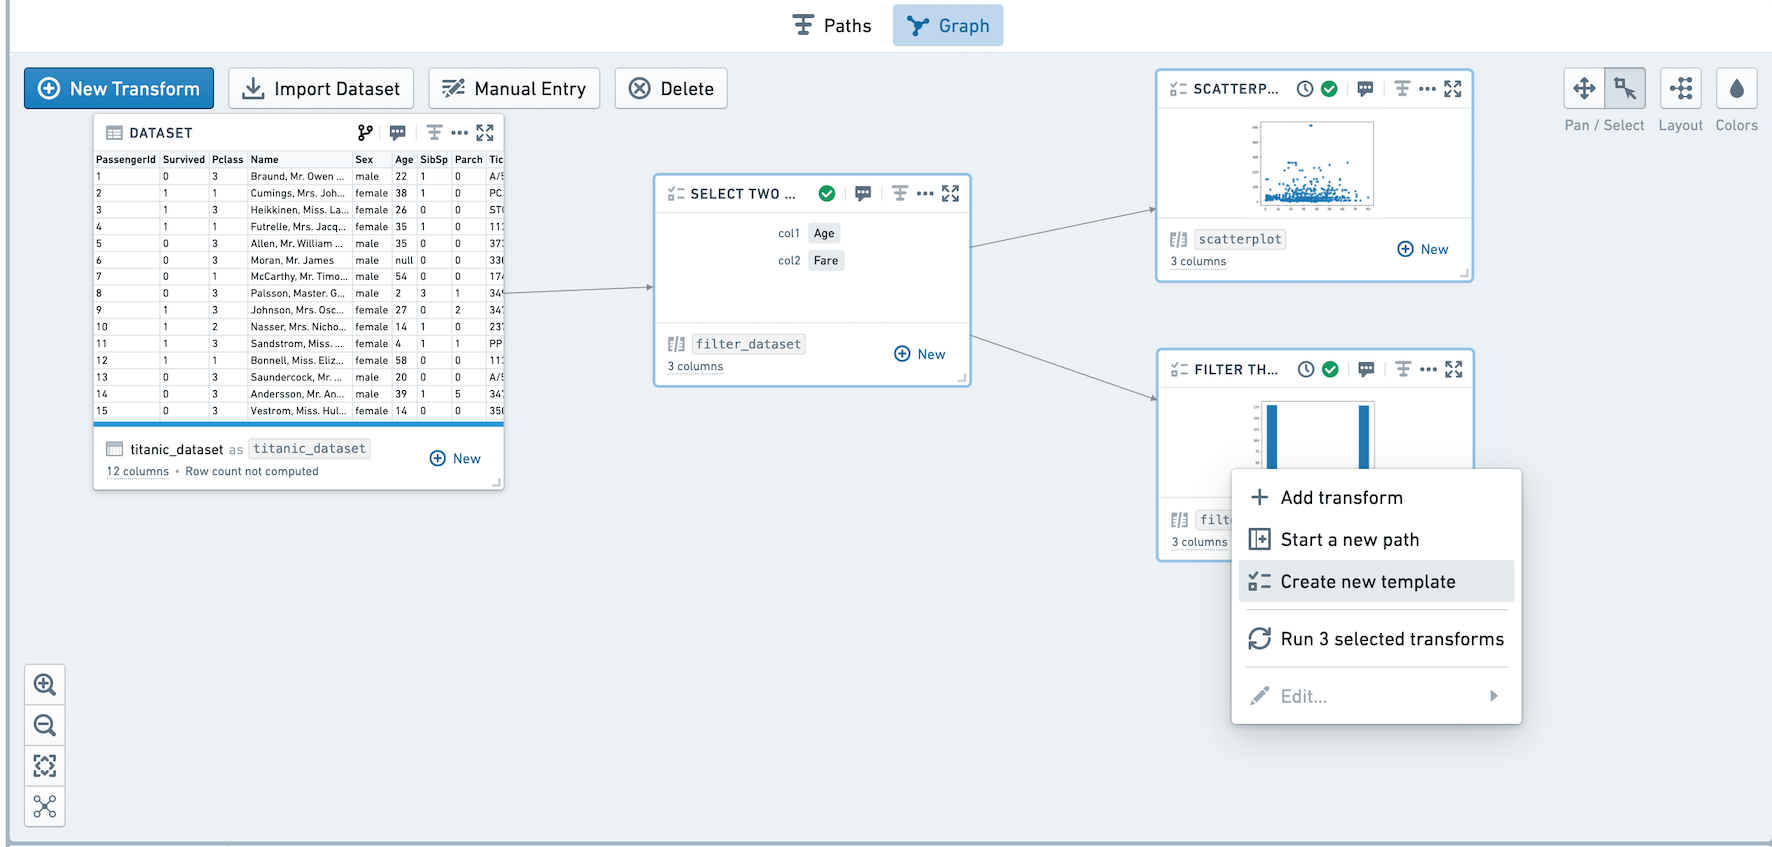
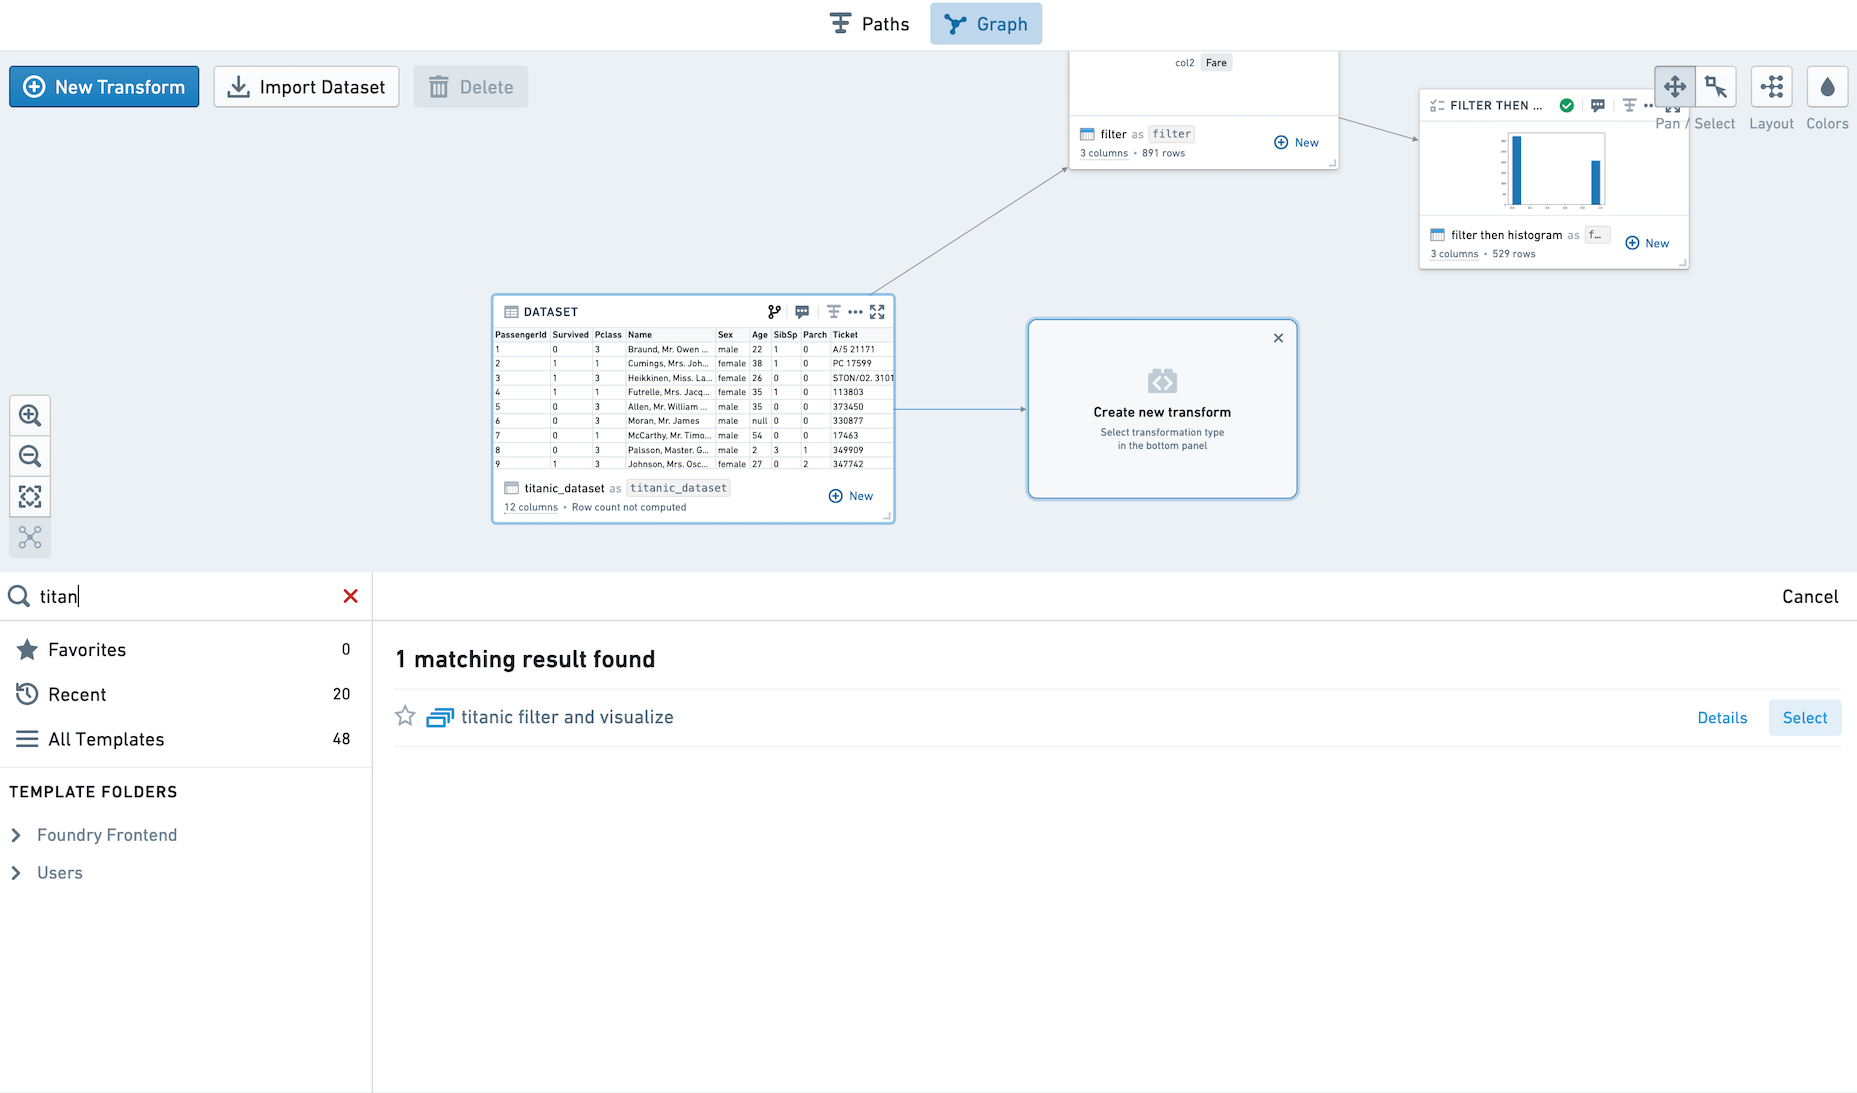
Let's walk through an example using titanic_dataset. We will templatize a workflow selecting two numeric columns and plotting them in two graphs. The first graph is a scatterplot of the two numeric columns. The second plot is a histogram of whether or not the passengers survived, based on filtering on the numeric columns.
Here's a visual overview of the workflow we are templatizing:
Creating Templates
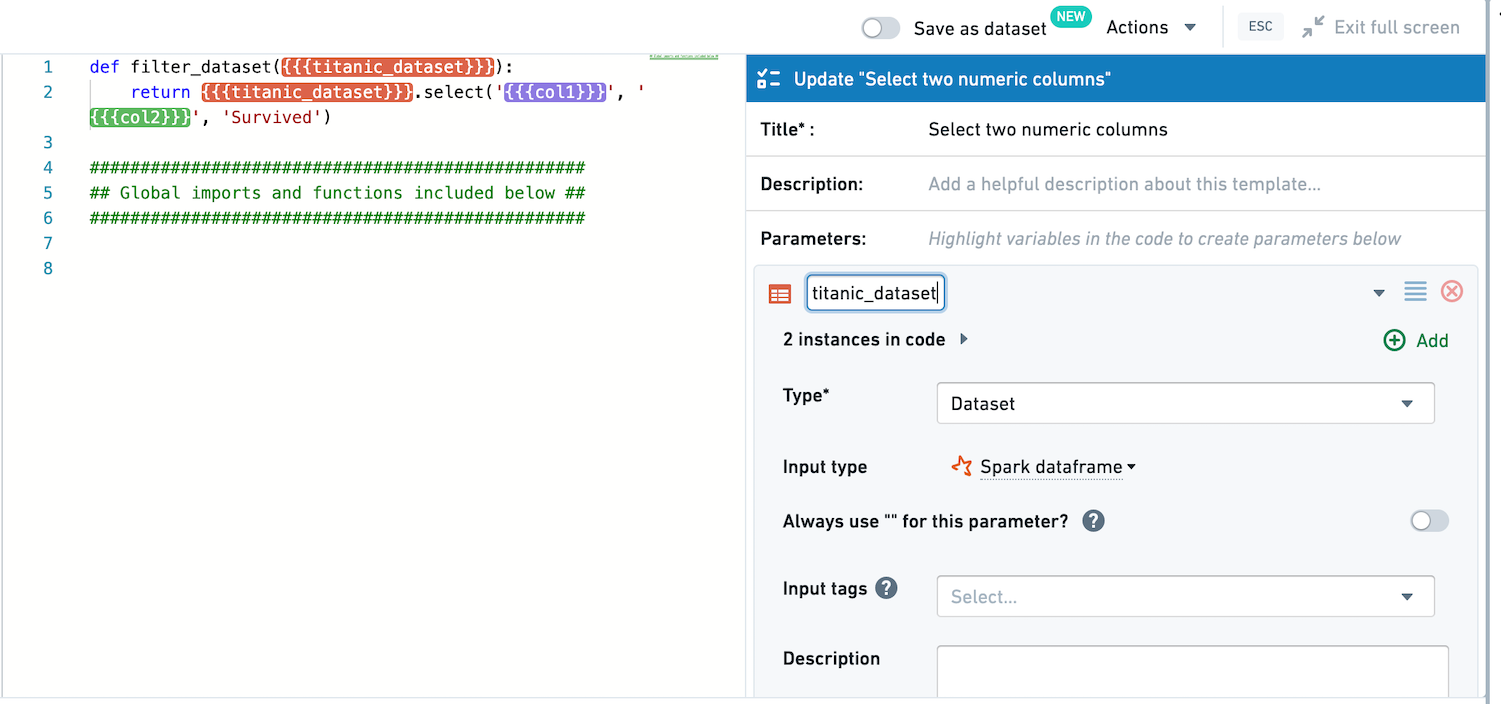
First, create a template selecting two numeric columns from the input dataset, along with Survived. Title this template Filter.
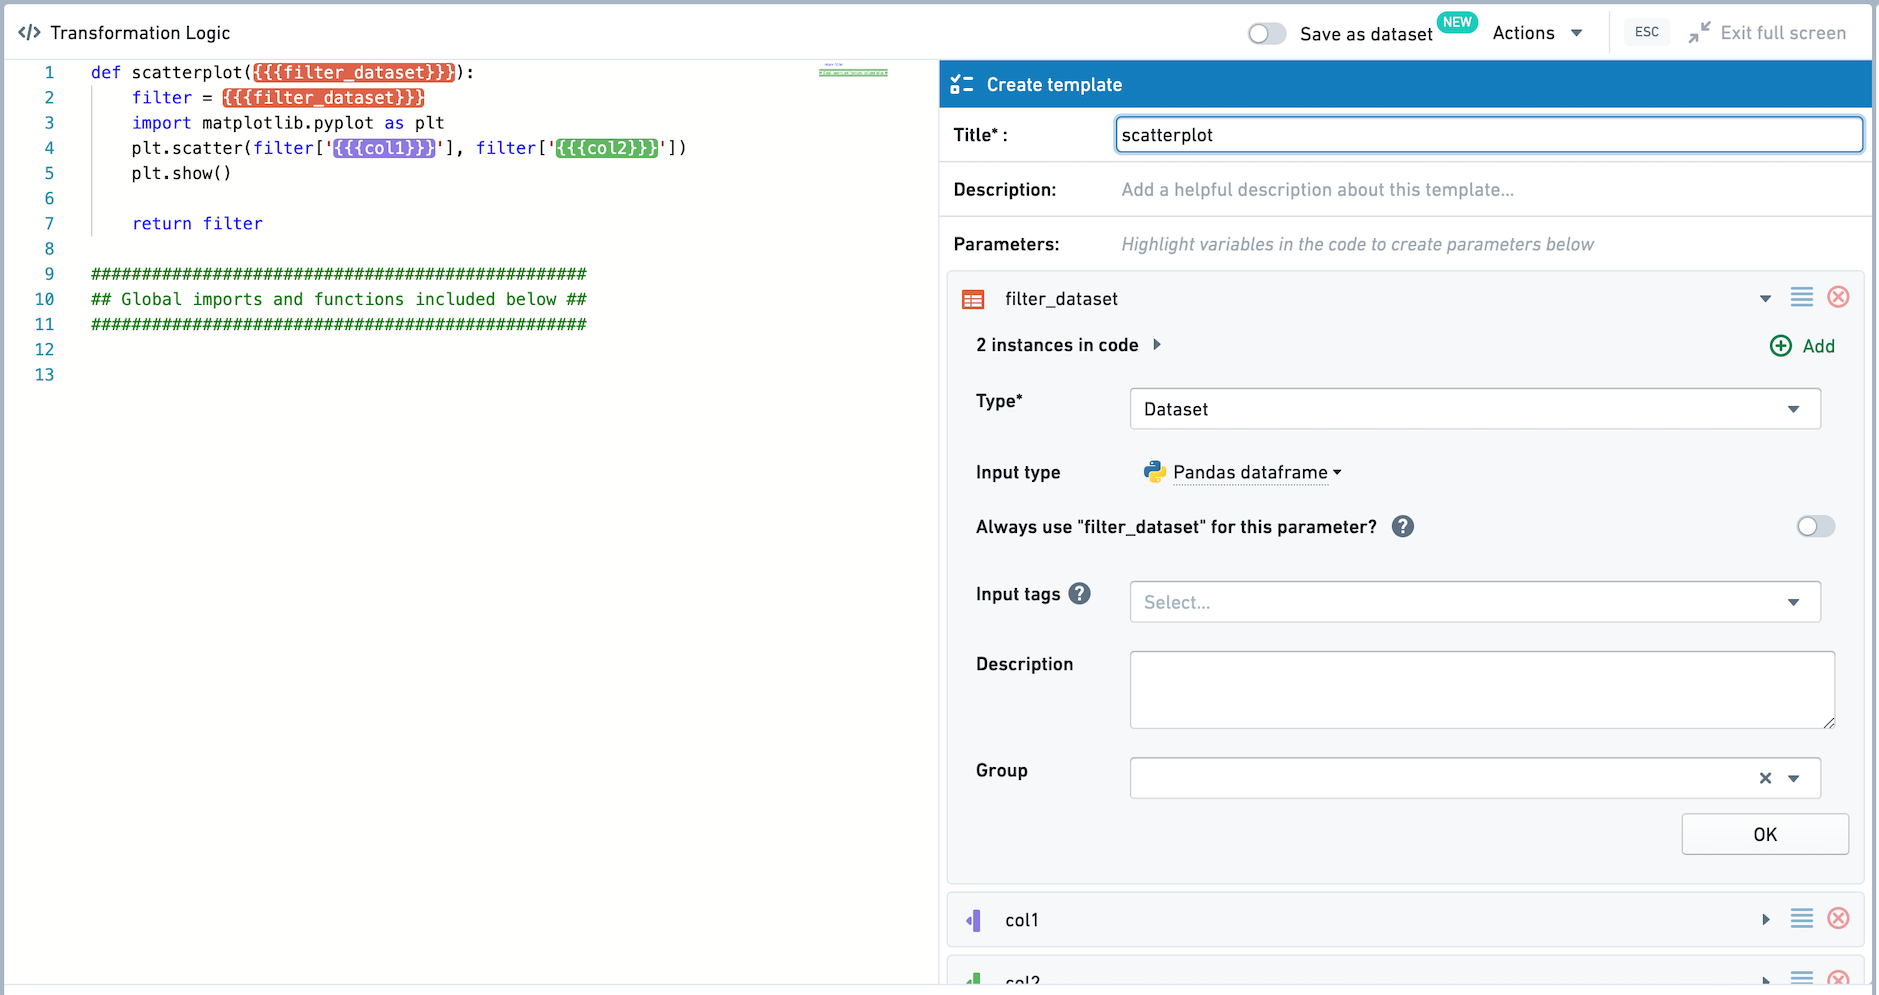
Second, create a template plotting a scatterplot of the two numeric columns. Title this template Scatterplot. Note that the input dataset is set to be read in as a Pandas dataframe.
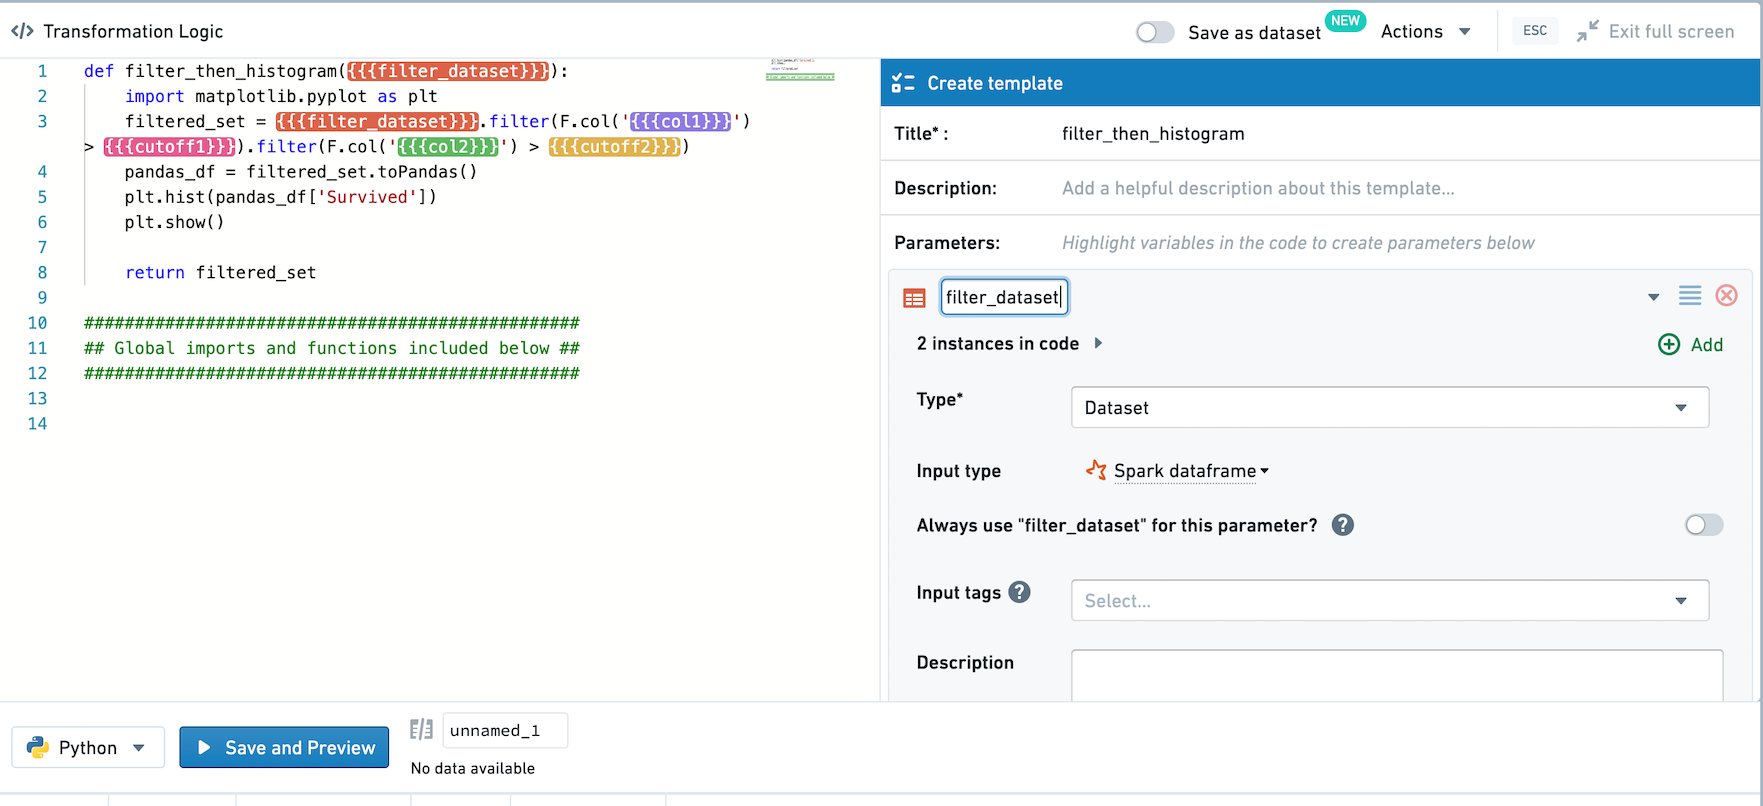
Finally, create a template that filters the input dataset based on the two numeric columns and two templatized inputs. Note that the input dataset is set to be read in as a Spark dataframe.
Creating Multi-Node Templates
Select all three templates and right-click to open the menu, then select Create new template. You should now see the template editor.
We want to link the values of the col1 parameters, and link the values of the col2 parameters. First, click into the Filter template. Click into col1, and select Create shared parameter in the dropdown.
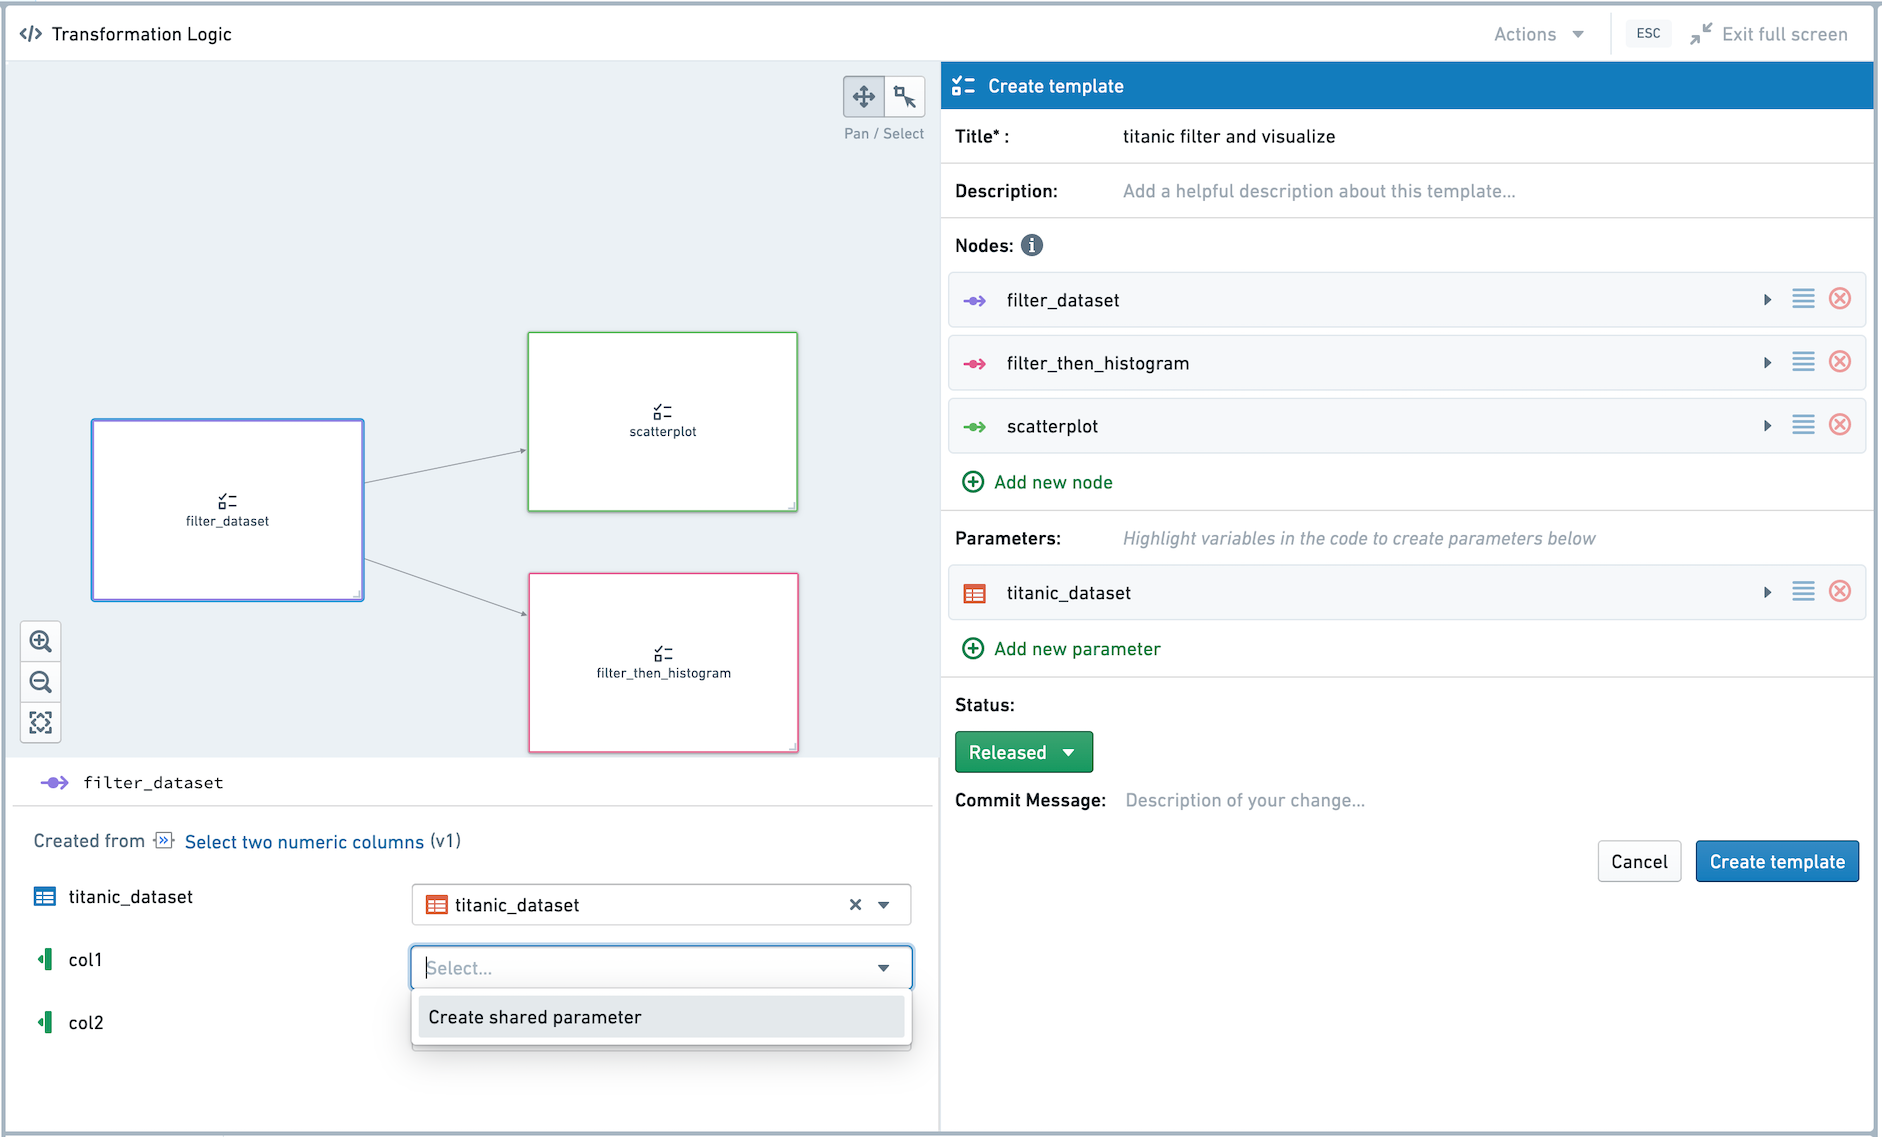
On the right-hand side, a new parameter titled col1 has been created. Select titanic_dataset as the source dataset in the right-hand pane. Then, click into the two other templates and choose to link col1 to the new col1 Multi-Node Template parameter. Repeat for col2, and then save the multi-node template.
Using Multi-Node Templates
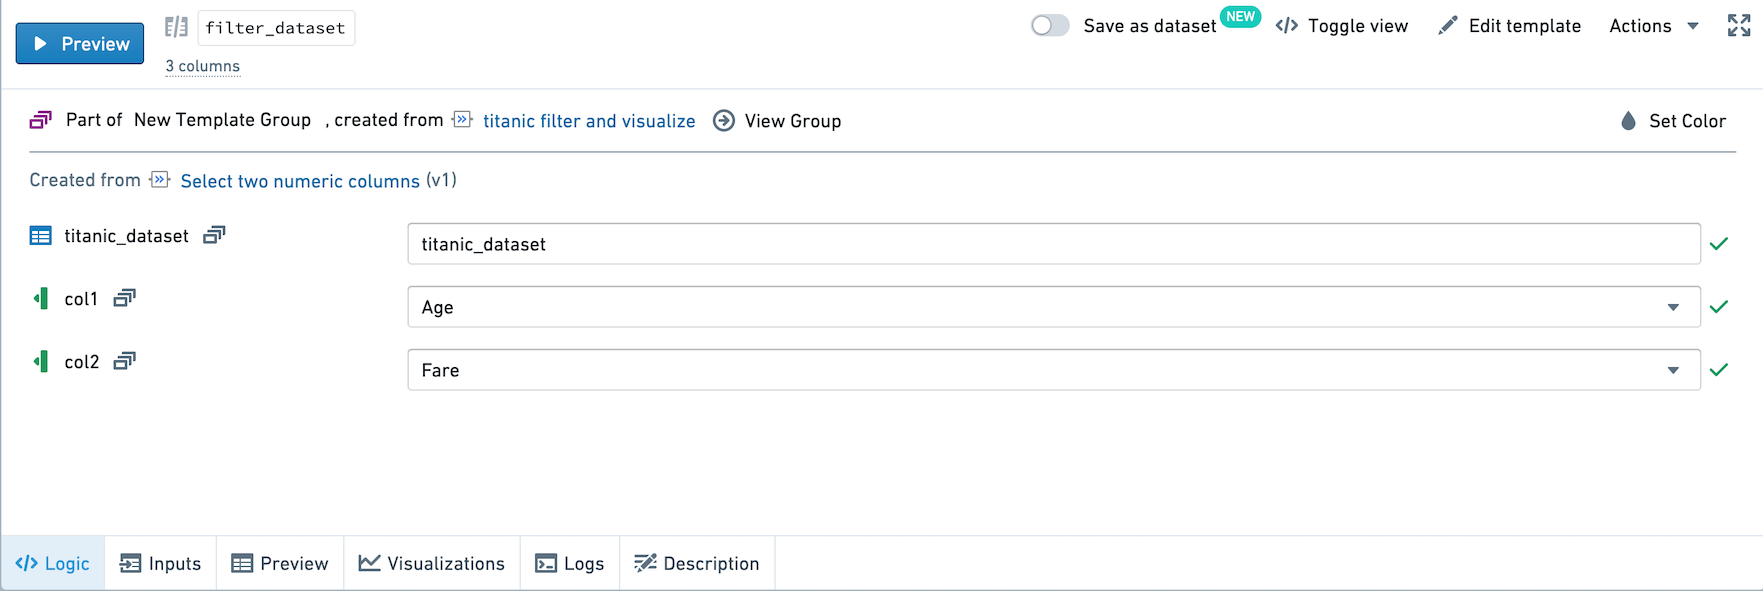
The three templates we previously created are now part of a multi-node template.
Click into the Filter template. Next to the col1 and col2 parameters, there is an icon indicating this parameter value is controlled by the multi-node template parameter.
Select View Group at the top of the pane. You now see a view highlighting the nodes in the Multi-Node Template, and listing the shared parameters in the template. You can change the value of col1 and col2 in this view, and all instances in the three nodes will also be changed.
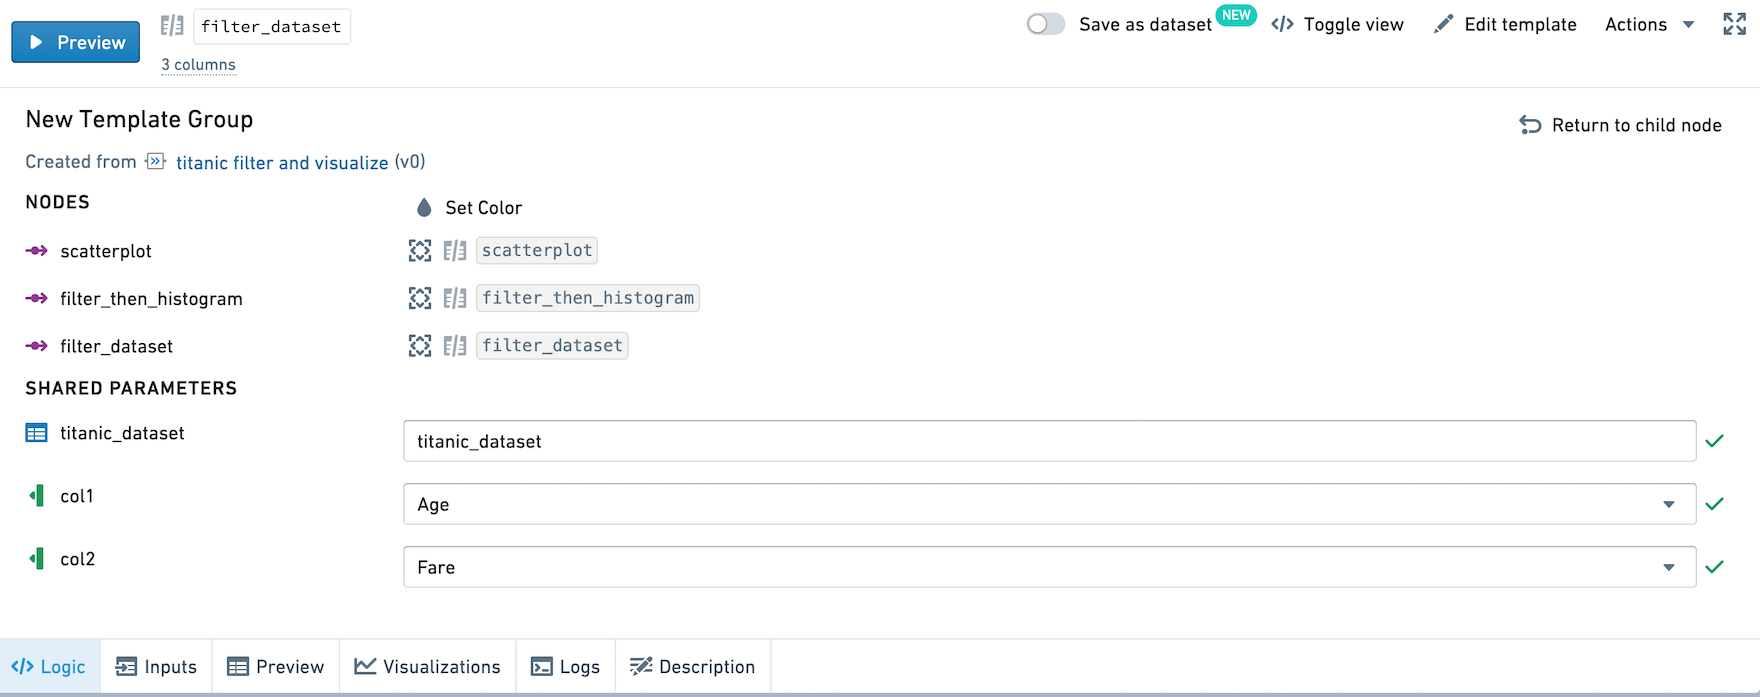
If you change the value of a shared parameter in the child node pane, the value will also be changed for all instances in the multi-node template.
Let's add a new instance of this template.
Let's analyze Fare and PClass. By selecting these two columns in the view for the child node, notice that you're setting the column values across the group.

Then, update the cutoff values in Filter then histogram. Run the templates, and we've now created the same graphs for a different set of numeric columns.
中文翻译
多节点模板(Multi-node templates)
Code Workbook 支持用于模板化工作流的多节点模板。一个模板可以由多个其他模板创建,并且您可以将这些模板中的参数值绑定在一起。
让我们通过一个使用 titanic_dataset 的示例来演示。我们将模板化一个工作流,该工作流选择两个数值列并在两个图表中绘制它们。第一个图表是两个数值列的散点图。第二个图表是基于数值列过滤后,乘客是否存活的直方图。
以下是我们要模板化的工作流的可视化概览:
创建模板(Creating Templates)
首先,创建一个模板,从输入数据集中选择两个数值列以及 Survived 列。将此模板命名为 Filter。
其次,创建一个模板,绘制两个数值列的散点图。将此模板命名为 Scatterplot。请注意,输入数据集被设置为以 Pandas 数据框(DataFrame)的形式读取。
最后,创建一个模板,该模板基于两个数值列和两个模板化输入来过滤输入数据集。请注意,输入数据集被设置为以 Spark 数据框(DataFrame)的形式读取。
创建多节点模板(Creating Multi-Node Templates)
选择所有三个模板,右键单击打开菜单,然后选择 Create new template。您现在应该会看到模板编辑器。
我们希望将 col1 参数的值关联起来,并将 col2 参数的值关联起来。首先,点击进入 Filter 模板。点击 col1,然后在下拉菜单中选择 Create shared parameter。
在右侧,已创建一个名为 col1 的新参数。在右侧窗格中选择 titanic_dataset 作为源数据集。然后,点击进入其他两个模板,并选择将 col1 链接到新的 col1 多节点模板参数。对 col2 重复此操作,然后保存多节点模板。
使用多节点模板(Using Multi-Node Templates)
我们之前创建的三个模板现在已成为一个多节点模板的一部分。
点击进入 Filter 模板。在 col1 和 col2 参数旁边,有一个图标指示此参数值由多节点模板参数控制。
选择窗格顶部的 View Group。您现在会看到一个视图,突出显示多节点模板中的节点,并列出模板中的共享参数。您可以在此视图中更改 col1 和 col2 的值,三个节点中的所有实例也会随之更改。
如果您在子节点窗格中更改共享参数的值,该值也会在多节点模板中的所有实例中更改。
让我们添加此模板的一个新实例。
让我们分析 Fare 和 PClass。通过在子节点的视图中选择这两列,请注意您正在跨组设置列值。
然后,更新 Filter then histogram 中的截止值。运行这些模板,我们现在已经为另一组数值列创建了相同的图表。