Transforms(转换(Transforms))
Transforms are pieces of logic that take one or more inputs and return a single output. Inputs and outputs can be Foundry datasets or models.
Code Workbook currently supports three types of transforms:
- Code transforms allow users to author arbitrary logic in their language of choice.
- Template transforms abstract away code behind a simple, form-based interface that can be reused between workbooks and users.
- Manual entry transforms allow users to input data into a node.
Adding transforms
There are several ways to add new transforms in Code Workbook.
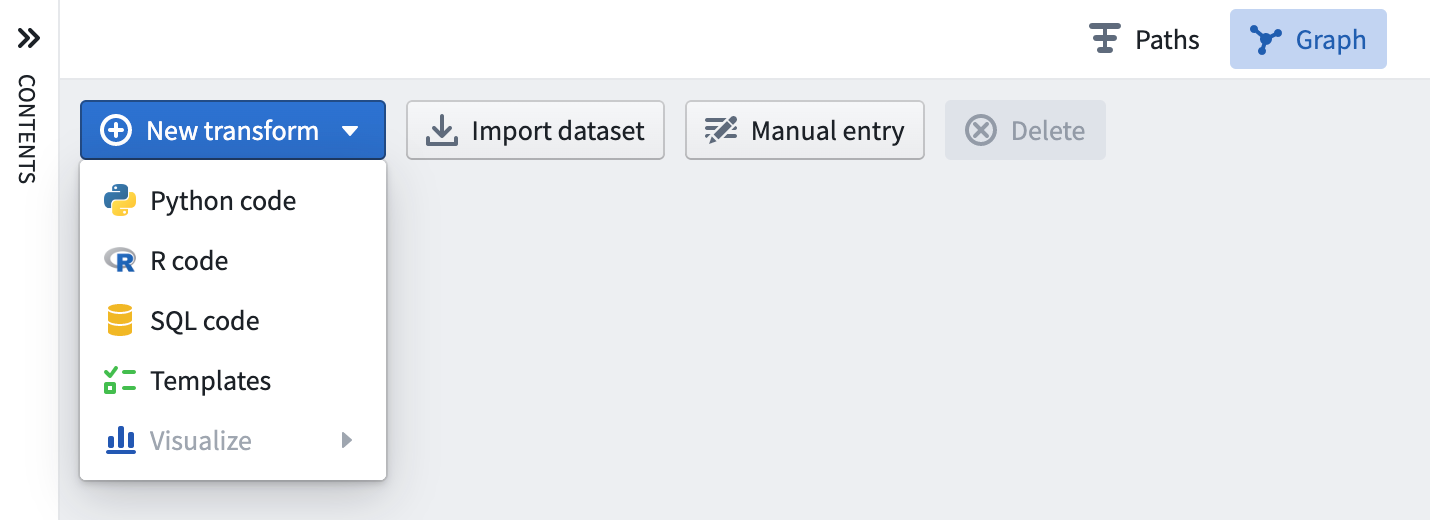
Use the New Transform button in the top-left of the graph, which will allow you to select the type of transform to add. For example, select Python code to add a new Python code node, or Templates to open the template browser.
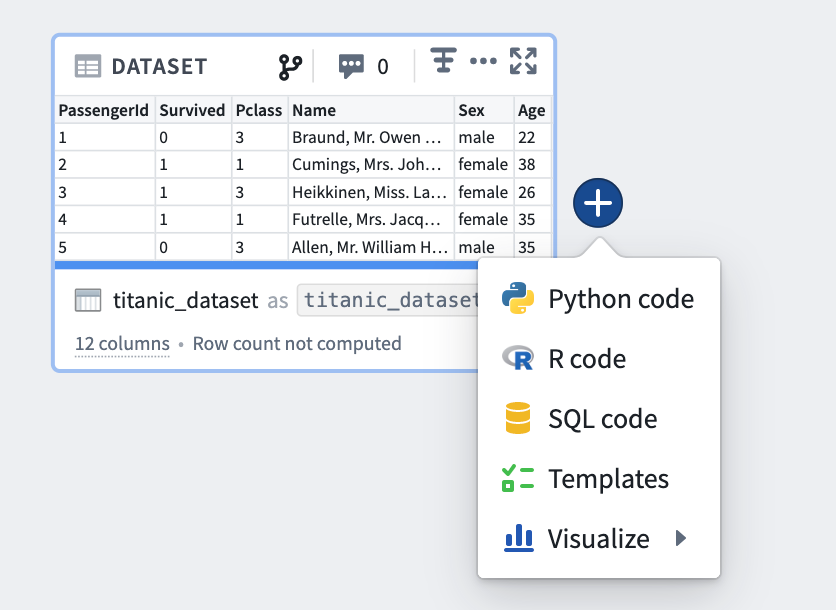
Alternately, hover over an existing transform on the graph and click on the blue + button that appears to open the selection dropdown. The newly created transform will be a child of the selected transforms.
Editing transforms
Editing names
Transforms in Code Workbook can be saved as datasets. Read more about data persistence.
Transforms that are not saved as datasets are identified by a workbook-specific alias that allows you to refer to the transform in code. For input datasets, and transforms that are saved as datasets, Code Workbook shows two different names for each dataset: the name of the underlying Foundry dataset, and a workbook-specific alias.
There are a few benefits to having aliases:
- You can refer to datasets in a way that is intuitive for the logic in your Workbook. For example, if you had two datasets called “Titanic” in different folders corresponding to different update frequencies, you could alias one of them as
titanic_historicaland the other astitanic_daily_feed. - You can freely edit dataset aliases without changing the dataset names for anybody using the same datasets elsewhere in Foundry.
- You can change the alias of a dataset on a branch and merge this change across branches.
To edit the dataset name or its alias, click on the name in the logic panel, enter the new name, and use the Enter key when finish editing. If you change a dataset name or alias, you will be prompted to automatically update the other name if you wish.
Adding inputs
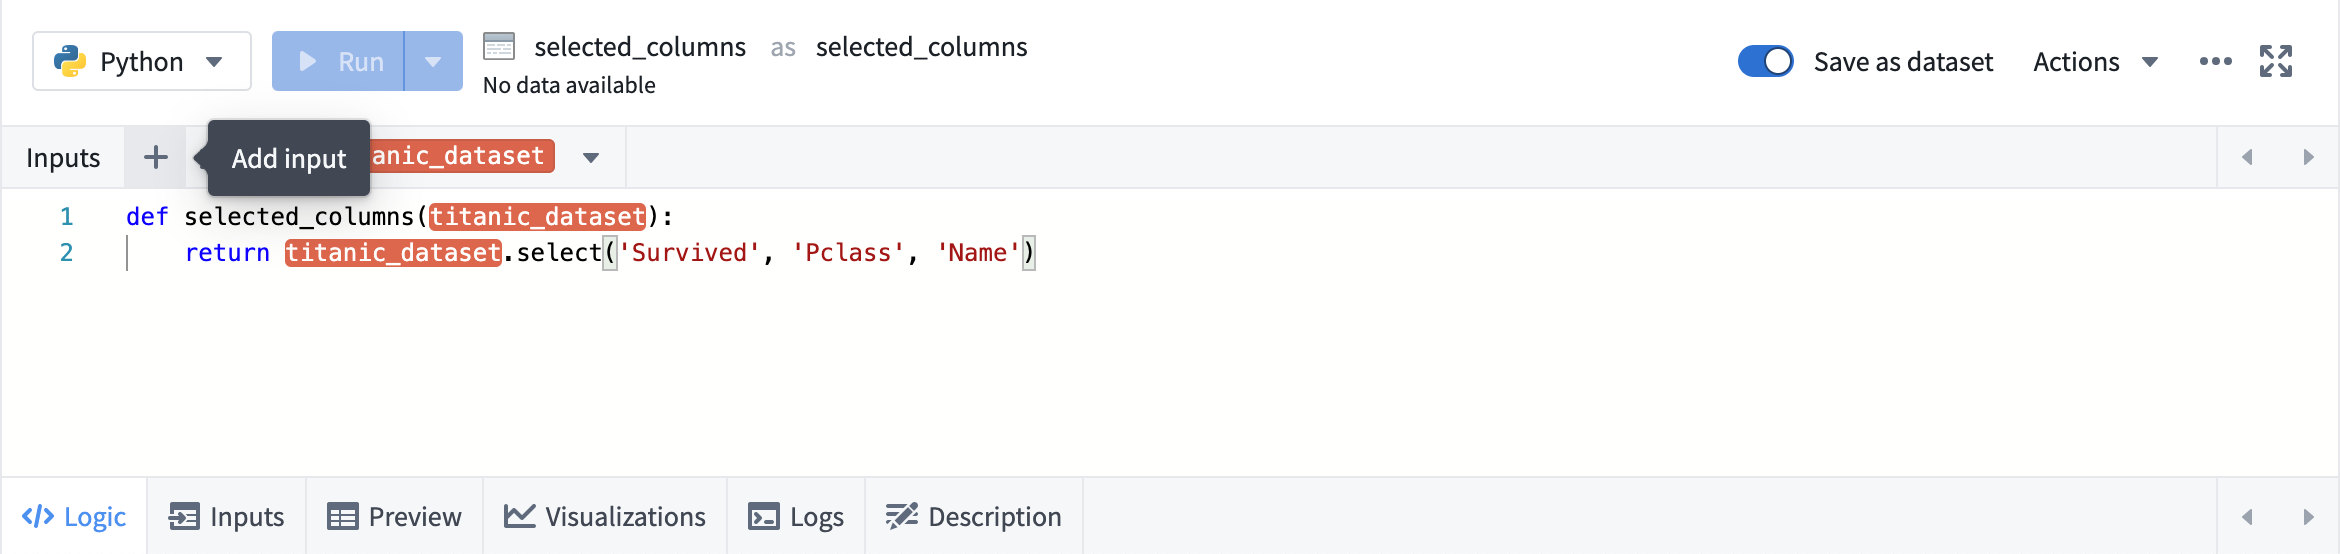
Clicking on any transform opens the logic panel. To add input, click the + button in the top input bar, and then click the desired input.
To add multiple inputs, use the button next to the +.
Code
Code transforms appear as a code editor prepopulated with basic structure for the language you are using in the current Workbook. See the Languages documentation for specific details about writing code in each language.
Global code
The Global code pane allows you to define code that executes before each code transform in your Workbook. The Global Code pane can be used to define variables and functions that will be available throughout the transforms in your Workbook.
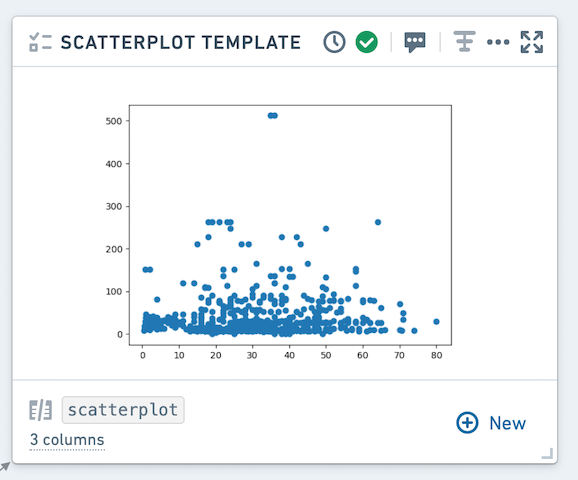
Templates
For Template transforms, the logic panel displays a form to edit Template parameters.
- After clicking a dataset parameter, click any dataset in the graph to set it as the value for that parameter.
- Column parameters depend on the input dataset being specified. After it is specified, you can choose from a dropdown list of column names.
- For value parameters such as integers and strings, you can type in a custom value.
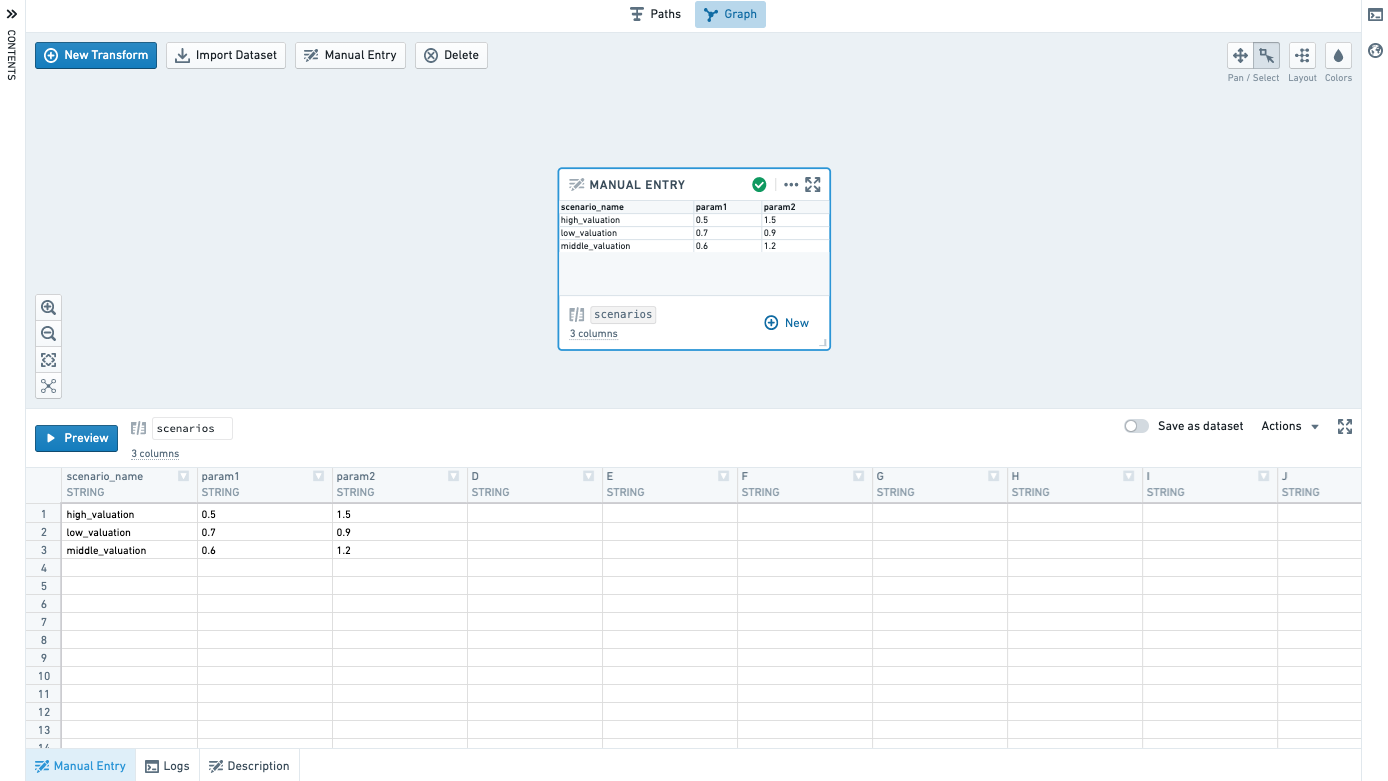
Manual entry
Add a manual entry node by clicking the Manual Entry button on the graph.

Enter data in the Manual Entry tab. Currently supported column types are Double, Integer, Boolean and String. Only 500 rows are supported.
Copy and paste to easily bring in data from other places.
Running transforms
Select Run in the bottom panel to execute the selected transform. To run all downstream transforms, select the arrow icon and choose Run all downstream.
Running a transform requires edit permissions on the workbook, as well as access to all of the Markings used by any dataset used by the workbook.
There are also several hotkeys available to quickly run code. Type ? to view the list of hotkeys.
There are two ways to run many transforms at once:
- Select multiple datasets in the graph by using Ctrl + Click or Cmd + Click. Then right-click anywhere on the graph and select Run N datasets from the menu.
- Click the settings icon (
 ) in the top bar and select Run all transforms.
When transforms are running, any printed output is streamed to the Logs tab. This allows you to print output in the middle of your transform and see results while your transform is still running, which can be useful for debugging or timing your logic.
Once saved to a dataset, any sorting of the data that was applied in code may not be persisted. In other words, if you run a transform that sorts data, the data may not be sorted in that order when you view it as a dataset, though other operations in the transform will have been applied.
Tabs
When working in the Graph or Full Screen Editor, use the bottom tabs on a node to navigate inputs and outputs of a transform.
Inputs
Use the Inputs tab to view the inputs to your transform, add additional inputs, or change the input types.
:::callout{theme="warning" title="Warning"} As with other Spark-based applications, Code Workbook does not by default maintain row order when reading datasets. Sort your data in code if your analysis requires a particular row order. :::
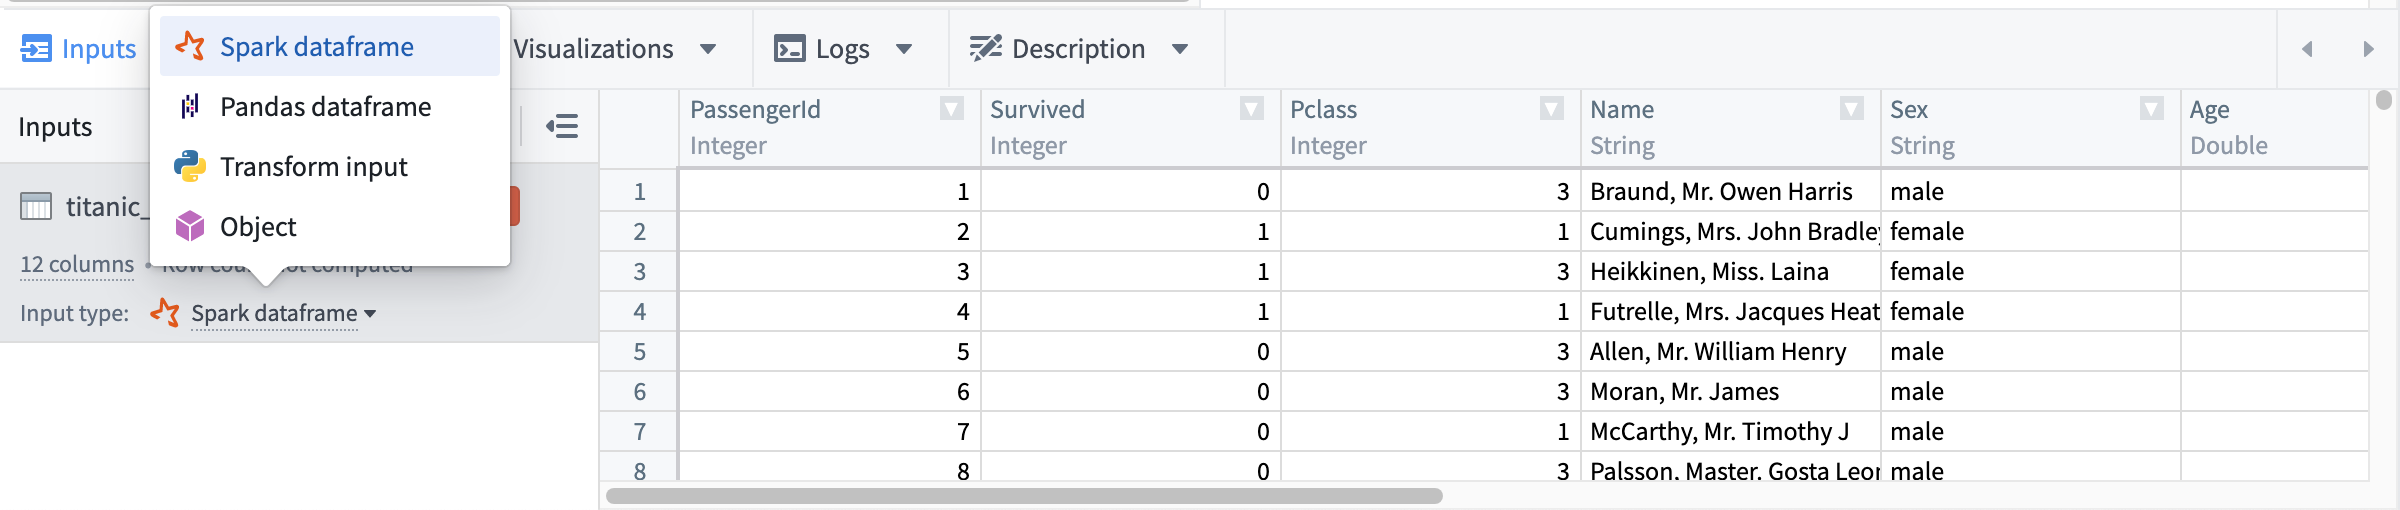
The following input types are available for each node language:
| Node language | Available input types |
|---|---|
| Python | Spark dataframe, Pandas dataframe, Python transform input, Object |
| SQL | Spark dataframe |
| R | Spark dataframe, R transform input, R data.frame, Object |
When a new transform is added, its input transforms will default to an input type based on the new transform's language and each input transform type, as detailed below:
| Input transform type | Downstream transform language | Default input type | Additional details |
|---|---|---|---|
| Import with no schema | Python | Python transform input | |
| R | R transform input | ||
| SQL | Spark dataframe | While you can create a SQL node with an input transform with no schema, SQL nodes only support Spark dataframe inputs and will not be effective in analyzing inputs with no schema. | |
| Import with schema | Python | Spark dataframe | |
| R | R data.frame | ||
| SQL | Spark dataframe | ||
| Import with custom file format, including models | Python | Object | See the model training tutorial for more information. Object input types in Code Workbook are custom file formats and are not related to ontology objects. |
| R | Object | See the model training tutorial for more information. Object input types in Code Workbook are custom file formats and are not related to ontology objects. | |
| SQL | Spark dataframe | While you can create a SQL node with an input transform that is a custom file format, SQL nodes only support Spark dataframe inputs and will not be effective in analyzing custom file format inputs. | |
| Derived nodes | N/A | Input node's output type | If the output type of the input node is incompatible with the derived node's language, derived nodes will use defaults as defined above for import node types. For example, if Node A returns a Pandas dataframe and derived Node B is an R node, Node B will default to reading Node A as an R data.frame. |
Preview
When you run your transform in Code Workbook, a 50-row preview is calculated to see the shape of your result. This preview is displayed in the preview tab before your dataset is finished writing to Foundry. After the dataset is persisted to Foundry, the preview tab will update to the full result.
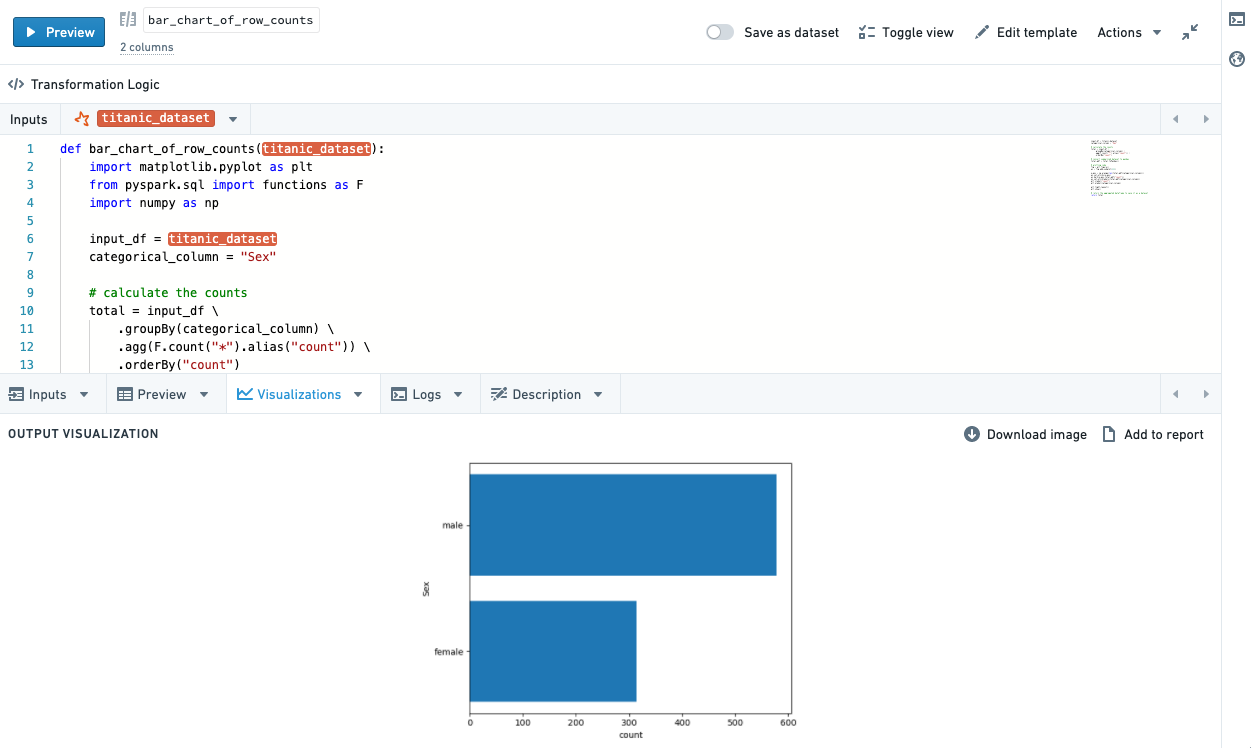
Visualizations
Depending on the language used in your transform, you can use plotting libraries to return visualizations that will propagate to the Code Workbook user interface. See the Languages documentation for details about how to do this in each language.
Resulting visualizations will be displayed in the graph by default, and are also available in the Visualizations bottom tab.
Using the context menu, you can toggle the view in the Graph between table and graph mode.
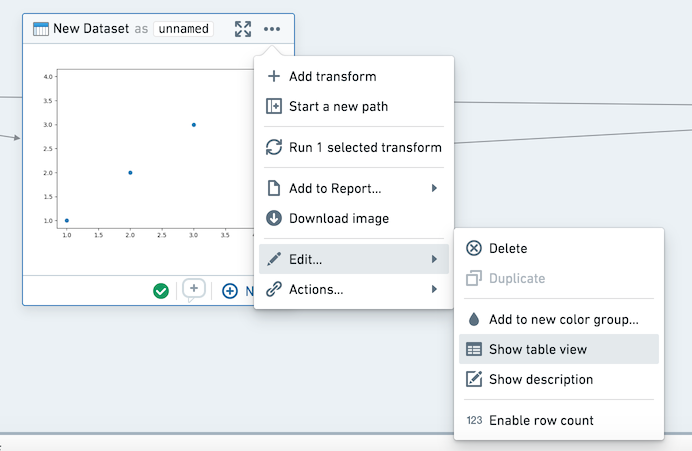
In the visualization tab, you can download your graph as an image or add it to a report. These actions are also available in the context menu.
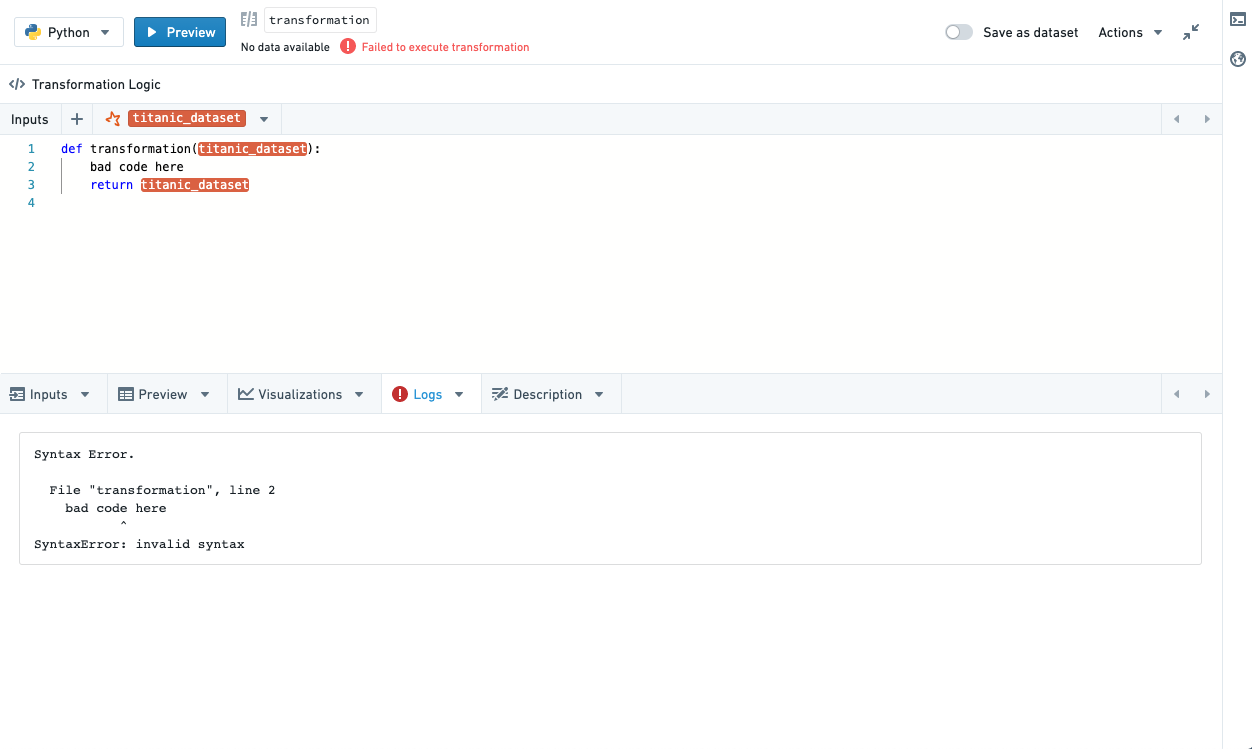
Logs
View print statements (standard out), warnings and errors (standard error) from running your transform. If there is standard error, the logs tab will be automatically selected and a small callout will appear to notify you there is warning/error output.
Description
Update the description for your dataset. Note that updating the description will update it across all branches - the description will also be available in the Open Dataset view.
You can use markdown to style your descriptions, and view them in the graph by clicking enabling Show Description in the right-click (action) menu. To show descriptions for all nodes in a workbook, click the Tools cog in the header and select Show all descriptions.
Models
Transforms that return models will automatically be written to Foundry as a model, allowing use of the Foundry ML interface. Refer to the Languages documentation for details about how to use models in each language.
Non-deterministic transforms
Some transformations are non-deterministic -- they return different results despite the same input data and transformation logic. Some functions that may lead to non-deterministic transforms include calls to the current timestamp, row number, monotonically increasing ID, and transformations after sorting on a column that contains duplicate values.
In Code Workbook, running a transform will start two jobs: one job calculates a 50 row preview, and the other job calculates the transformation on the full dataset and writes the result to Foundry. If there is a non-deterministic transform, the result you see in the 50 row preview may not match the result in the Foundry dataset.
When running non-deterministic code within a transformation, dataframes are not necessarily materialized. For example, assume you have a non-deterministic transform Transform A, which is the parent of Transforms B and C. If you run each transformation separately from within Code Workbook, each dataset will be written to Foundry sequentially, resulting in consistent results across transforms B and C. However, if you select "Run all downstream" on A, as A is not necessarily materialized when running B and C, you may see conflicting results. Running builds from within Data Lineage can prevent this as well, as each dataset will be materialized and sequentially calculated, as will converting to a Pandas dataframe.
Some examples of functions that result in non-deterministic transformations include current_date(), current_timestamp(), and row_count(), though other functions can result in non-determinism. More information on ways that Spark calculates transformations that may result in unexpected behavior can be found at the Apache Spark docs ↗.
中文翻译
转换(Transforms)
转换(Transforms) 是接受一个或多个输入并返回单个输出的逻辑片段。输入和输出可以是Foundry数据集或模型。
代码工作簿(Code Workbook)目前支持三种类型的转换:
- 代码(Code) 转换允许用户使用其选择的语言编写任意逻辑。
- 模板(Template) 转换将代码抽象为简单的、基于表单的界面,可在工作簿和用户之间重复使用。
- 手动输入(Manual entry) 转换允许用户将数据输入到节点中。
添加转换(Adding transforms)
在代码工作簿(Code Workbook)中有多种添加新转换的方法。
使用图表左上角的新建转换(New Transform)按钮,可以选择要添加的转换类型。例如,选择Python代码(Python code)添加新的Python代码节点,或选择模板(Templates)打开模板浏览器。
或者,将鼠标悬停在图表中的现有转换上,点击出现的蓝色+按钮打开选择下拉菜单。新创建的转换将成为所选转换的子节点。
编辑转换(Editing transforms)
编辑名称(Editing names)
代码工作簿(Code Workbook)中的转换可以保存为数据集。了解更多关于数据持久化的信息。
未保存为数据集的转换通过工作簿特定的别名(alias)来标识,允许您在代码中引用该转换。对于输入数据集和已保存为数据集的转换,代码工作簿(Code Workbook)会显示每个数据集的两个不同名称:底层Foundry数据集的名称和工作簿特定的别名。
使用别名有几个好处:
- 您可以使用对工作簿逻辑直观的方式引用数据集。例如,如果您有两个名为"Titanic"但位于不同文件夹(对应不同更新频率)的数据集,您可以将一个别名为
titanic_historical,另一个别名为titanic_daily_feed。 - 您可以自由编辑数据集别名,而不会更改在Foundry其他位置使用相同数据集的用户的名称。
- 您可以在分支上更改数据集的别名,并将此更改合并到其他分支。
要编辑数据集名称或其别名,请点击逻辑面板中的名称,输入新名称,编辑完成后按Enter键。如果您更改了数据集名称或别名,系统会提示您是否要自动更新另一个名称。
添加输入(Adding inputs)
点击任何转换都会打开逻辑面板。要添加输入,请点击顶部输入栏中的+按钮,然后点击所需的输入。
要添加多个输入,请使用+旁边的按钮。
代码(Code)
代码转换(Code transforms)显示为一个代码编辑器,其中预填充了当前工作簿所用语言的基本结构。请参阅语言文档了解每种语言编写代码的具体细节。
全局代码(Global code)
全局代码(Global code)面板允许您定义在工作簿中每个代码转换之前执行的代码。全局代码面板可用于定义将在工作簿的转换中可用的变量和函数。
模板(Templates)
对于模板转换(Template transforms),逻辑面板显示一个用于编辑模板参数的表单。
- 点击数据集参数后,点击图表中的任何数据集将其设置为该参数的值。
- 列参数取决于指定的输入数据集。指定后,您可以从列名的下拉列表中选择。
- 对于整数和字符串等值参数,您可以输入自定义值。
手动输入(Manual entry)
通过点击图表上的手动输入(Manual Entry)按钮添加手动输入节点。
在手动输入(Manual Entry)选项卡中输入数据。目前支持的列类型有双精度(Double)、整数(Integer)、布尔(Boolean)和字符串(String)。仅支持500行。
复制粘贴可以轻松从其他地方导入数据。
运行转换(Running transforms)
选择底部面板中的运行(Run)来执行选定的转换。要运行所有下游转换,请选择箭头图标并选择运行所有下游(Run all downstream)。
运行转换需要工作簿的编辑权限,以及访问工作簿使用的任何数据集所使用的所有标记(Markings)的权限。
还有一些快捷键可用于快速运行代码。输入?查看快捷键列表。
有两种方法可以一次运行多个转换:
- 使用Ctrl+单击或Cmd+单击在图表中选择多个数据集。然后在图表上任意位置右键单击,从菜单中选择运行N个数据集(Run N datasets)。
- 点击顶部栏中的设置图标(),选择运行所有转换(Run all transforms)。
当转换正在运行时,任何打印输出都会流式传输到日志(Logs)选项卡。这允许您在转换仍在运行时打印输出并查看结果,这对于调试或计时逻辑非常有用。
一旦保存到数据集,代码中应用的任何数据排序可能不会持久化。换句话说,如果您运行一个对数据进行排序的转换,当您将其作为数据集查看时,数据可能不会按该顺序排序,尽管转换中的其他操作已经应用。
选项卡(Tabs)
在图(Graph)或全屏编辑器(Full Screen Editor)中工作时,使用节点上的底部选项卡导航转换的输入和输出。
输入(Inputs)
使用输入(Inputs)选项卡查看转换的输入、添加额外输入或更改输入类型。
:::callout{theme="warning" title="警告"} 与基于Spark的其他应用程序一样,代码工作簿(Code Workbook)在读取数据集时默认不保持行顺序。如果您的分析需要特定的行顺序,请在代码中对数据进行排序。 :::
每个节点语言可用的输入类型如下:
| 节点语言 | 可用输入类型 |
|---|---|
| Python | Spark数据框(Spark dataframe), Pandas数据框(Pandas dataframe), Python转换输入(Python transform input), 对象(Object) |
| SQL | Spark数据框(Spark dataframe) |
| R | Spark数据框(Spark dataframe), R转换输入(R transform input), R数据框(R data.frame), 对象(Object) |
添加新转换时,其输入转换将根据新转换的语言和每个输入转换类型默认为输入类型,详情如下:
| 输入转换类型 | 下游转换语言 | 默认输入类型 | 其他详情 |
|---|---|---|---|
| 无模式的导入(Import with no schema) | Python | Python转换输入(Python transform input) | |
| R | R转换输入(R transform input) | ||
| SQL | Spark数据框(Spark dataframe) | 虽然您可以创建具有无模式输入转换的SQL节点,但SQL节点仅支持Spark数据框输入,无法有效分析无模式的输入。 | |
| 带模式的导入(Import with schema) | Python | Spark数据框(Spark dataframe) | |
| R | R数据框(R data.frame) | ||
| SQL | Spark数据框(Spark dataframe) | ||
| 带自定义文件格式的导入(Import with custom file format),包括模型 | Python | 对象(Object) | 更多信息请参阅模型训练教程。代码工作簿(Code Workbook)中的对象输入类型是自定义文件格式,与本体论(Ontology)对象无关。 |
| R | 对象(Object) | 更多信息请参阅模型训练教程。代码工作簿(Code Workbook)中的对象输入类型是自定义文件格式,与本体论(Ontology)对象无关。 | |
| SQL | Spark数据框(Spark dataframe) | 虽然您可以创建具有自定义文件格式输入转换的SQL节点,但SQL节点仅支持Spark数据框输入,无法有效分析自定义文件格式输入。 | |
| 派生节点(Derived nodes) | 不适用(N/A) | 输入节点的输出类型 | 如果输入节点的输出类型与派生节点的语言不兼容,派生节点将使用上述导入节点类型的默认值。例如,如果节点A返回Pandas数据框(Pandas dataframe)而派生节点B是R节点,节点B将默认将节点A读取为R数据框(R data.frame)。 |
预览(Preview)
当您在代码工作簿(Code Workbook)中运行转换时,会计算一个50行的预览以查看结果形状。在数据集完成写入Foundry之前,此预览会显示在预览选项卡中。数据集持久化到Foundry后,预览选项卡将更新为完整结果。
可视化(Visualizations)
根据转换中使用的语言,您可以使用绘图库返回可视化结果,这些结果将传播到代码工作簿(Code Workbook)用户界面。请参阅语言文档了解每种语言如何实现此功能。
生成的可视化结果默认显示在图表中,也可在可视化(Visualizations)底部选项卡中查看。
使用上下文菜单,您可以在图表中切换表格和图形模式之间的视图。
在可视化选项卡中,您可以将图形下载为图像或添加到报告中。这些操作也可在上下文菜单中使用。
日志(Logs)
查看运行转换时的打印语句(标准输出)、警告和错误(标准错误)。如果有标准错误,日志选项卡将自动选中,并出现一个小提示通知您存在警告/错误输出。
描述(Description)
更新数据集的描述。请注意,更新描述将更新所有分支的描述——该描述也将在打开数据集(Open Dataset)视图中可用。
您可以使用Markdown来样式化描述,并通过在右键单击(操作)菜单中启用显示描述(Show Description)在图表中查看。要显示工作簿中所有节点的描述,请点击标题中的工具齿轮并选择显示所有描述(Show all descriptions)。
模型(Models)
返回模型的转换将自动作为模型写入Foundry,从而允许使用Foundry ML界面。请参阅语言文档了解如何在每种语言中使用模型。
非确定性转换(Non-deterministic transforms)
某些转换是非确定性的——尽管输入数据和转换逻辑相同,它们会返回不同的结果。可能导致非确定性转换的一些函数包括调用当前时间戳、行号、单调递增ID,以及在包含重复值的列上排序后的转换。
在代码工作簿(Code Workbook)中,运行转换将启动两个作业:一个作业计算50行预览,另一个作业计算完整数据集的转换并将结果写入Foundry。如果存在非确定性转换,您在50行预览中看到的结果可能与Foundry数据集中的结果不匹配。
在转换中运行非确定性代码时,数据框不一定被物化。例如,假设您有一个非确定性转换Transform A,它是Transform B和C的父节点。如果您从代码工作簿(Code Workbook)中分别运行每个转换,每个数据集将按顺序写入Foundry,从而在转换B和C之间产生一致的结果。但是,如果您在A上选择"运行所有下游(Run all downstream)",由于在运行B和C时A不一定被物化,您可能会看到冲突的结果。从数据沿袭(Data Lineage)中运行构建也可以防止这种情况,因为每个数据集将被物化并按顺序计算,转换为Pandas数据框也是如此。
导致非确定性转换的一些函数示例包括current_date()、current_timestamp()和row_count(),但其他函数也可能导致非确定性。有关Spark计算可能导致意外行为的转换方式的更多信息,请参阅Apache Spark文档 ↗。