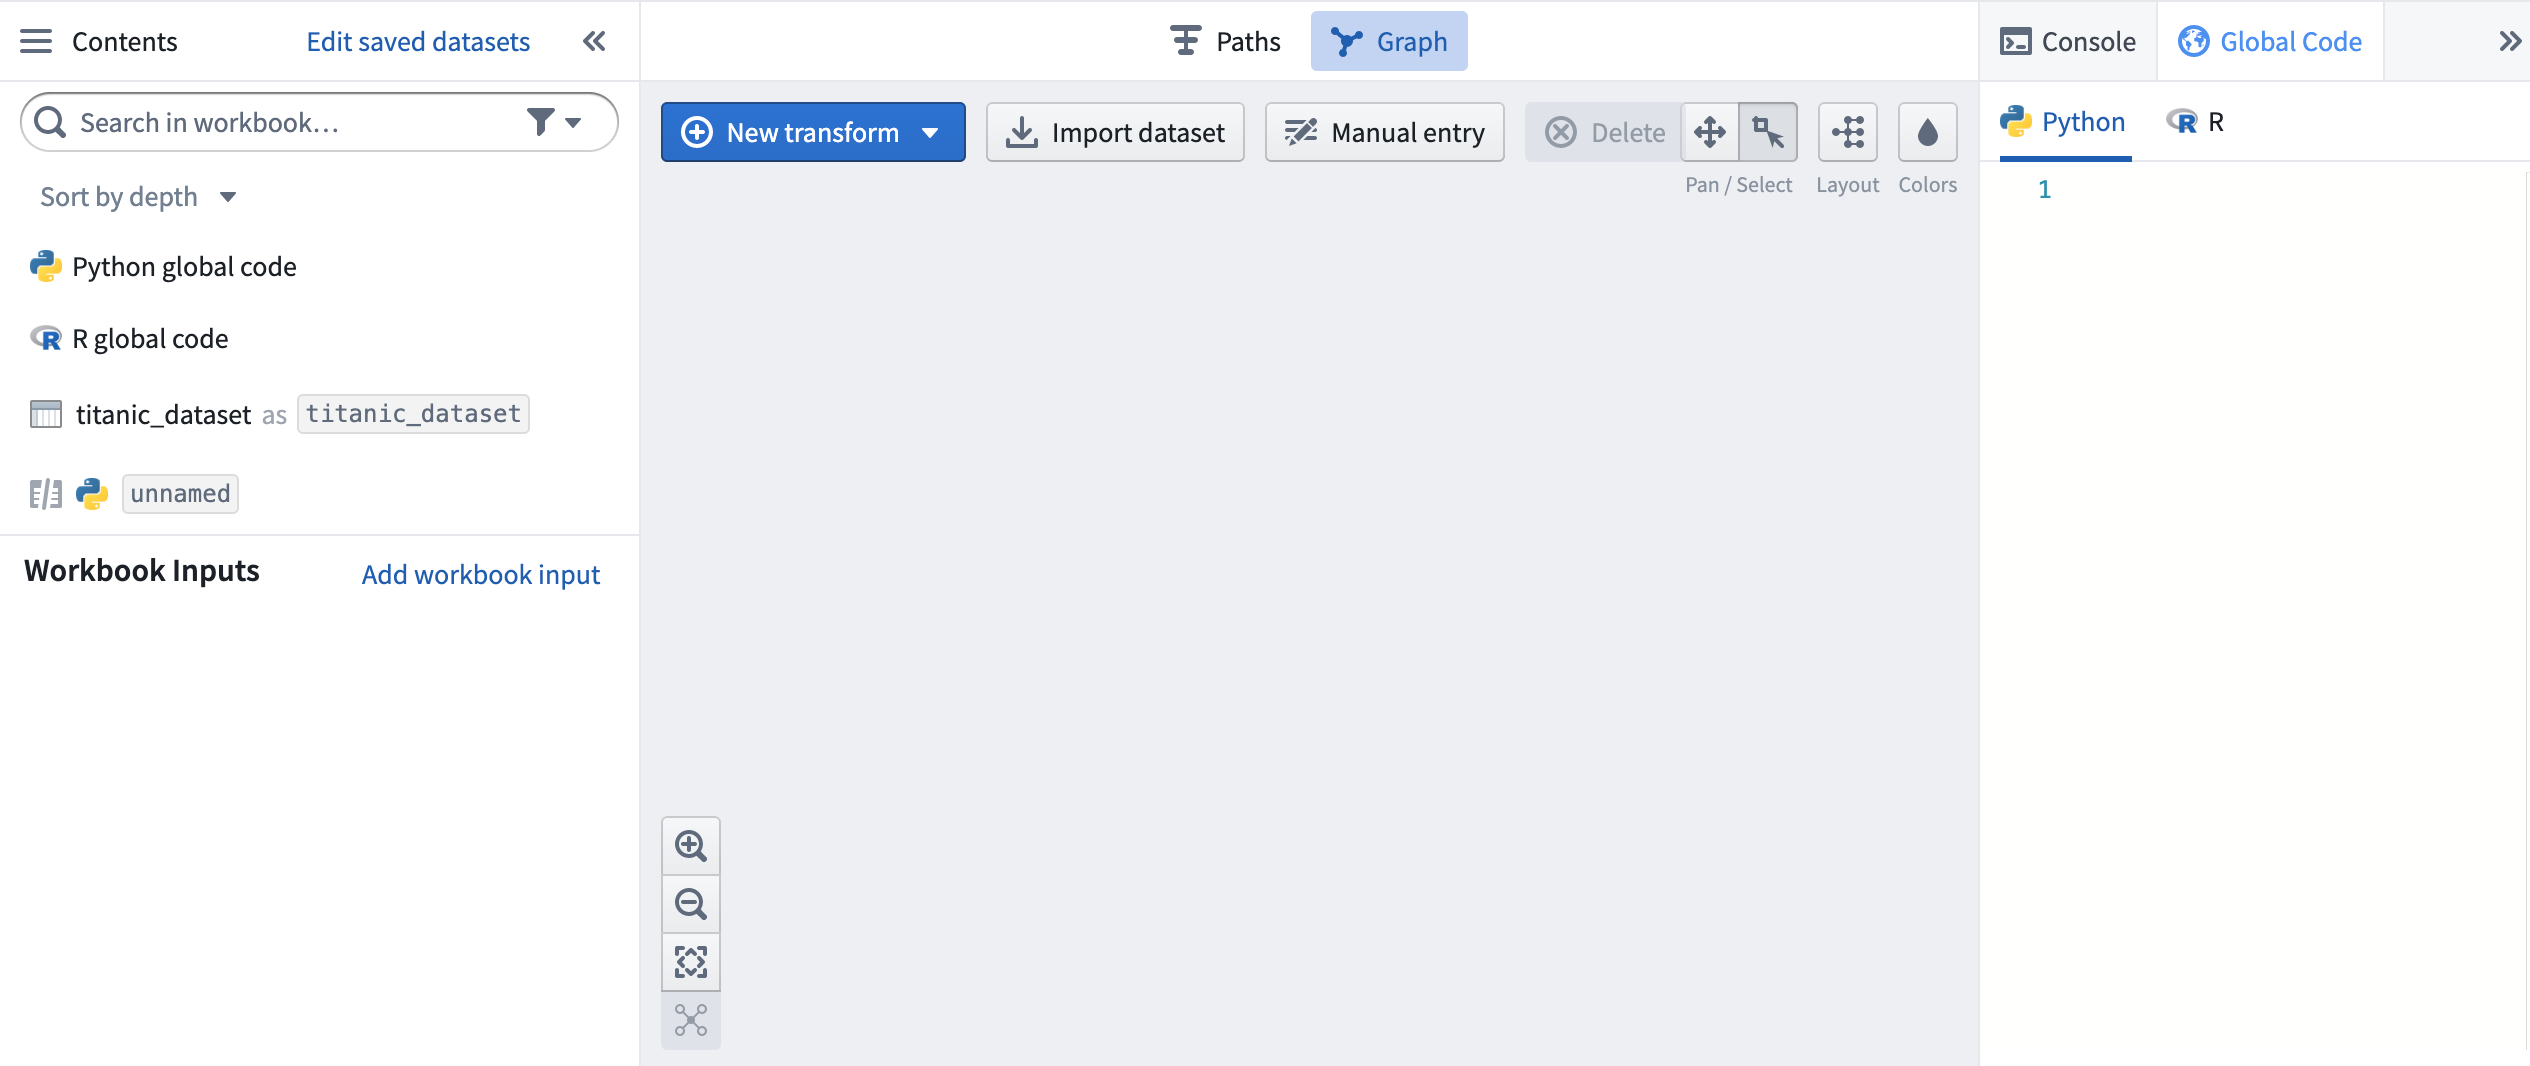
Workbooks(工作簿(Workbooks))
The main resource you interact with in Code Workbook is a Workbook. Workbooks are used to import datasets from Foundry and transform these input datasets for purposes such as:
- Cleaning and joining raw data imported from some external source to produce curated datasets for other users.
- Analyzing processed datasources to derive useful insights.
- Training and applying models to do predictive analysis.
- Creating parameterized visualizations to display in a report.
Graph
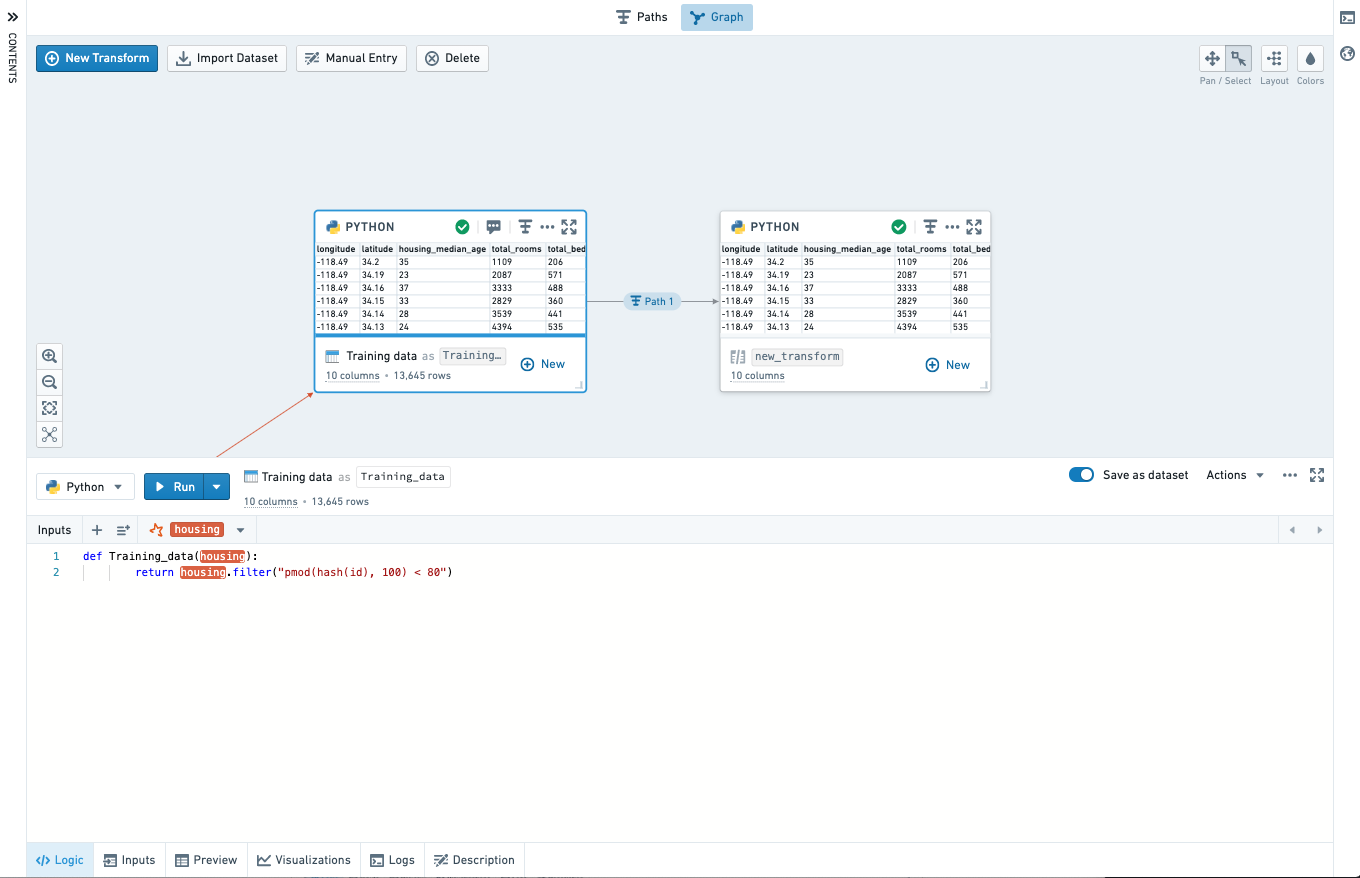
The core component of the Workbook interface is the Graph. The Graph represents how data flows through logical steps in your Workbook to produce outputs.
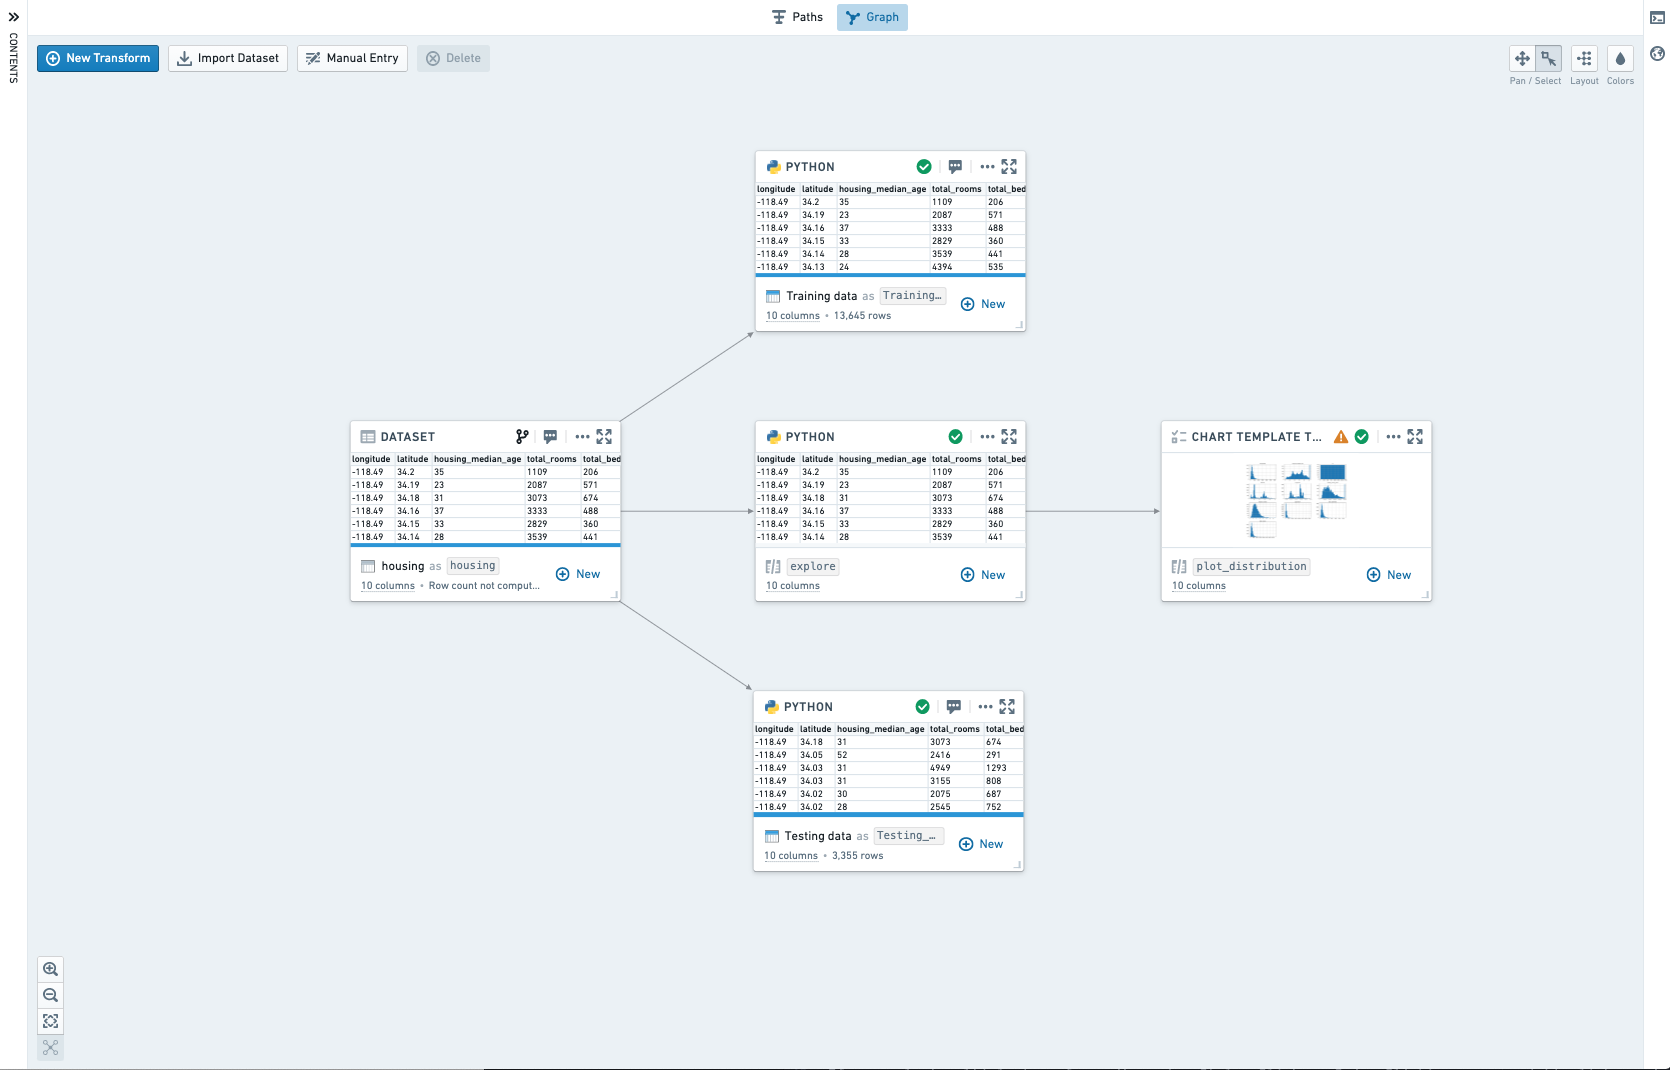
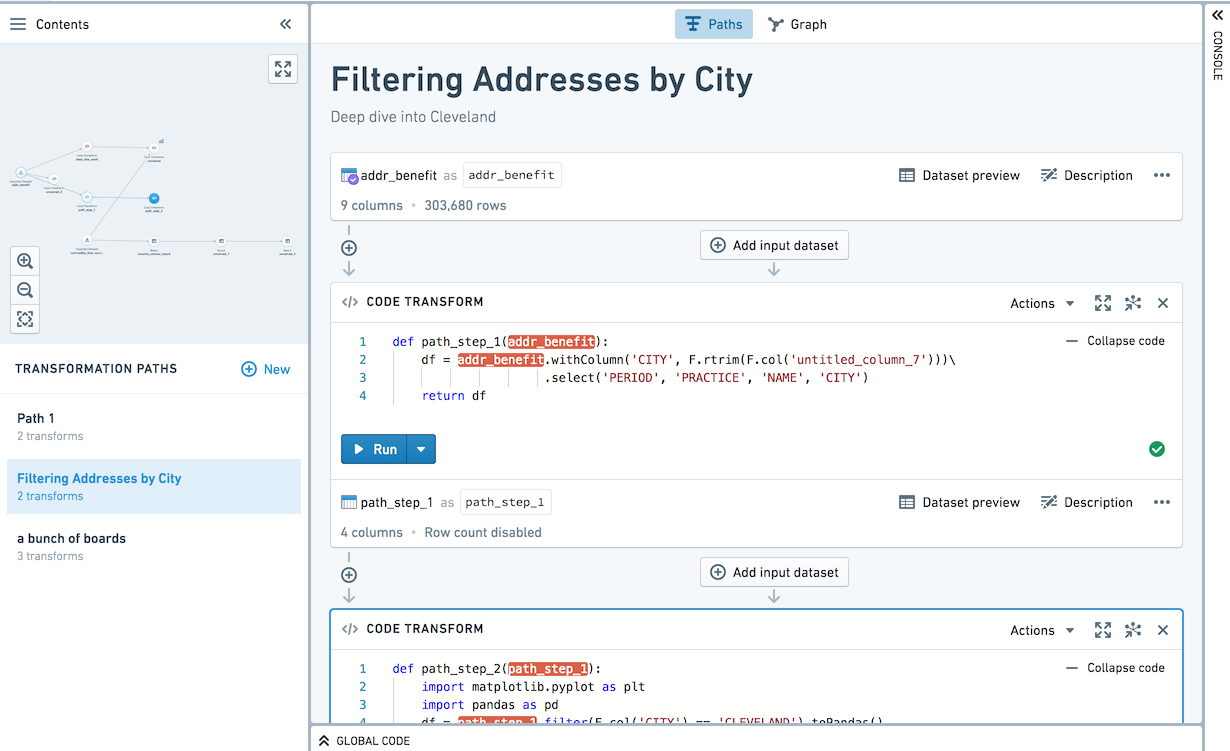
Input datasets are imported from elsewhere in Foundry to be used as source data in the workbook. Other than input datasets, each node in the graph represents a transform. A transform is a piece of logic that can return an output dataframe or model, and possibly render a visualization. A transform may be saved as a derived dataset. When a transform is saved as a derived dataset, running the transform will automatically write the results to Foundry, allowing them to be used outside of this Code Workbook and easily shared with others.
There are three types of transforms available in Code Workbook:
- Code transforms allow you to write code to process inputs and return results.
- Template transforms provide a form-based interface to transformation code, making it simple to reuse and share code.
- Manual entry transforms allow users to input data into a node.
Navigating the graph
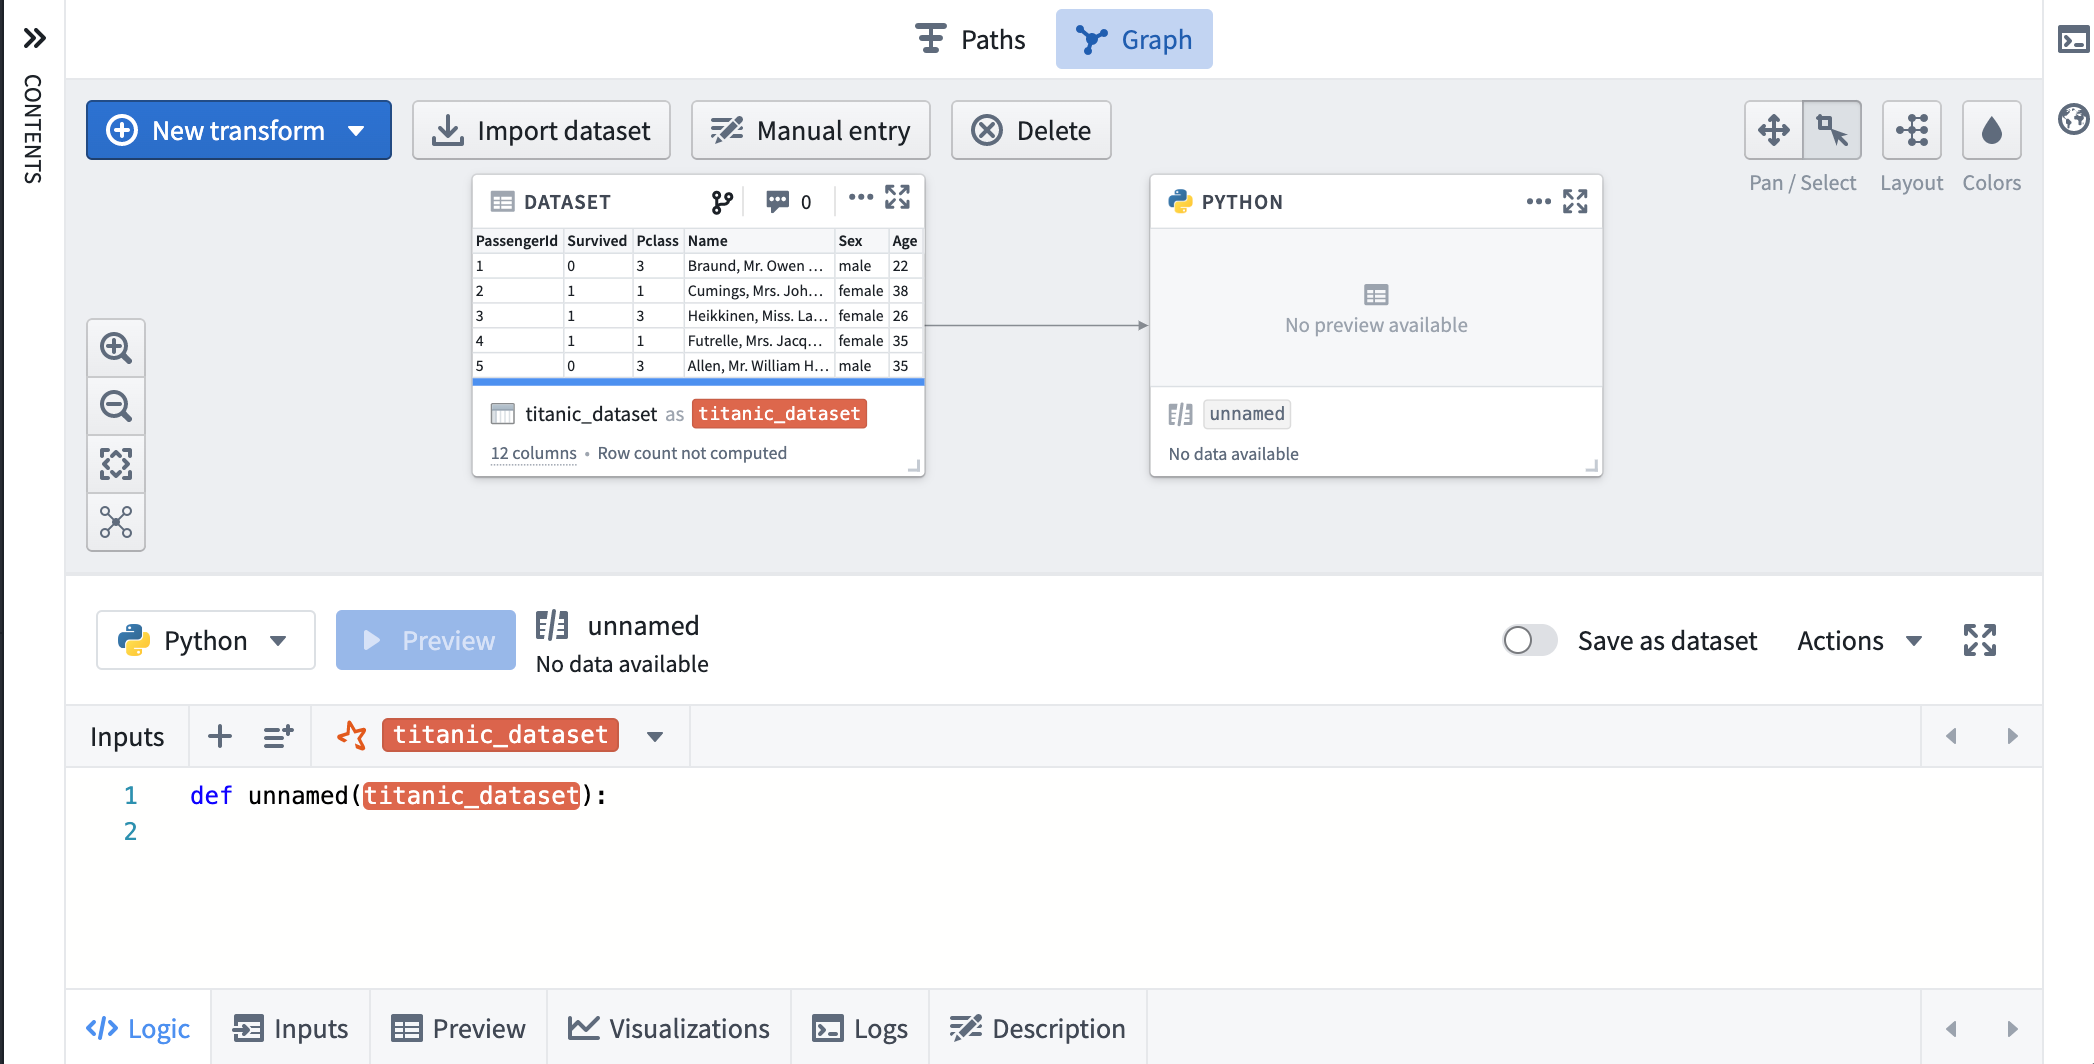
Click on any transform in the graph to open the Logic panel at the bottom of the interface. This allows you to view and edit transform logic and view the transform output. You can select multiple transforms in the graph with Ctrl+Click on Windows or Cmd+Click on macOS.
To help navigate large Workbooks, you can use the zoom options in the lower left of the graph, which include a Zoom to fit button that zooms the graph to bring all transforms into view.
Interacting with transforms
A key way to interact with transforms is through the context menu, which you can open by clicking on the ellipsis (...) on the top right of each transform in the graph, or by right-clicking on the transform in either the graph or the sidebar.
This menu provides a range of useful actions, including adding a new downstream transform, running the transform associated with this dataset, or deleting this transform from the Workbook. For transforms that are saved as datasets, the Actions option allows you to access the usual set of Foundry actions associated with the dataset.
If you select multiple transforms (by using Ctrl+Click on Windows or Cmd+Click on macOS), you can right-click anywhere on the graph to open the context menu for all the selected transforms. This can be helpful for adding a new transform with multiple inputs, or for running multiple transforms at once.
Hovering over a dataset name in the workbook will open a tooltip with the full path of the dataset in Foundry.
Paths
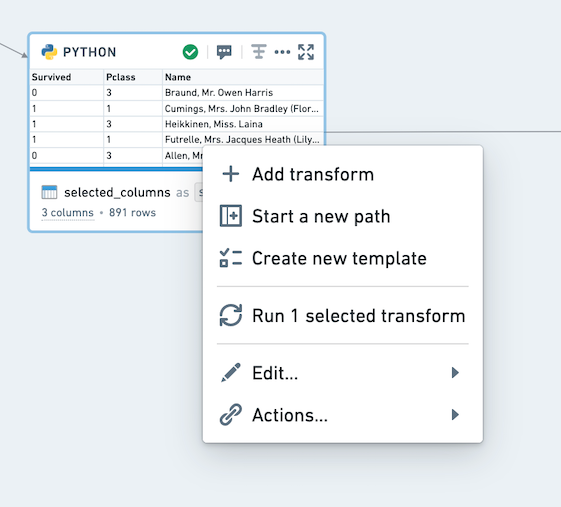
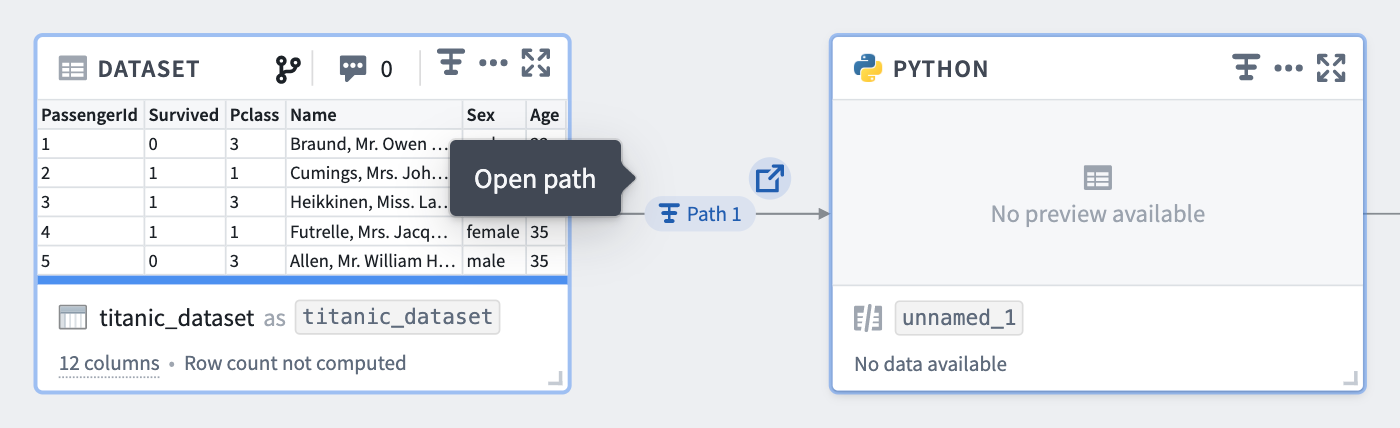
You can switch to the Paths view at the top of your workbook. The Paths view is an alternate mode allowing for linear development within a workbook. The Paths view is well suited for workflows that drill down on one dataset and perform sequential transformation steps.
Paths can be started from datasets imported into the workbook, or transforms created in the workbook. In the Paths view, use the left sidebar to navigate between paths.
All transforms created in the Paths view are also persisted to the Graph. Navigate from a path node to the graph by clicking the Open transform in Graph icon (![]() ) on the path node.
) on the path node.
Within the Graph, you can see which nodes are part of a path by looking at the annotations on the edges between nodes. Hover over the annotation to open the source path.
You can also click on the Path icon on a node to open it in its source path.
Full Screen Editor
You may want to focus on one transform and interact with that transform in full screen mode. From either the Graph or the Paths view, click on the expand button (![]() on a given node to view in Full Screen Editor.
on a given node to view in Full Screen Editor.
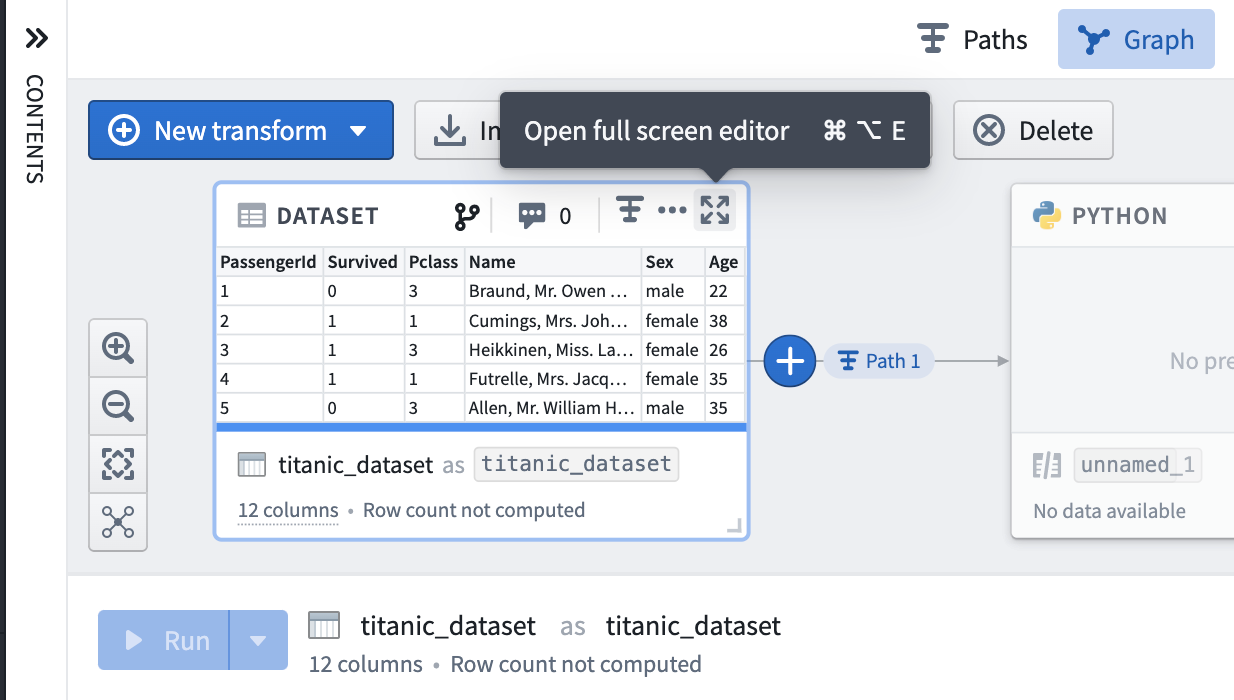
When in fullscreen mode, you can rearrange your tabs to view two tabs at once by using the dock action or drag and drop.
To exit the Full Screen Editor and return to the Graph or Paths, use the Esc key or select the collapse button (![]() ).
).
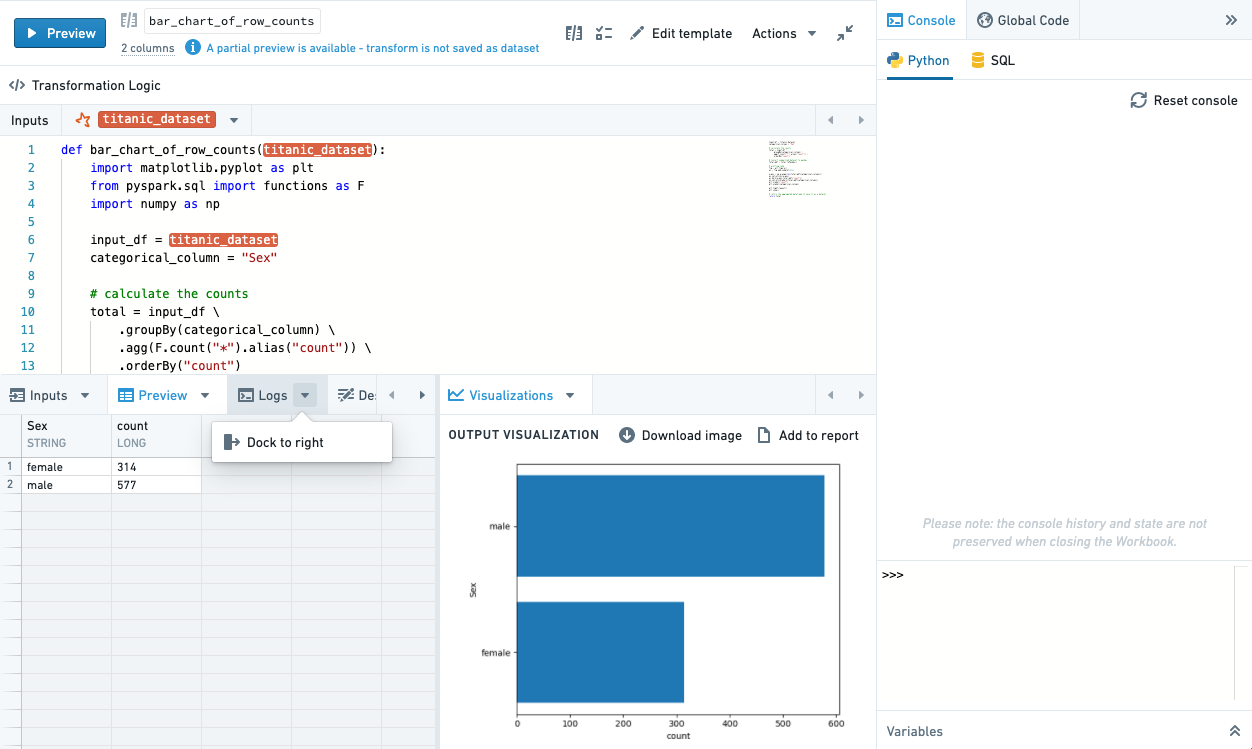
Panes
Code Workbook has three interface panes - Contents, Global Code, and Console - that are always available from the Graph, Paths view, and Full Screen Editor.
Contents
On the left-hand side of the interface, click on the Contents bar to open the Workbook contents pane.
When in Graph mode, the Contents pane shows a list of all transforms in the Graph in order to summarize the entire Workbook. By default, this list of transforms is sorted in topological order; input datasets are at the top and the furthest downstream transforms are at the bottom. Next to each transform in the list, there is a zoom button that will center the graph on this transform. You can also zoom in on a selected transform using the space bar. Click on Edit Saved Datasets to change which transforms, if any, are saved as datasets.
When in the Paths view, the Contents pane shows a mini-graph of all of the transforms in the workbook, allowing quick navigation between nodes.
Global Code
Use the Global Code pane on the right-hand side of the Workbook interface to define code (like variables or functions) that will be available in all code transforms of that language across the Workbook. For instance, you can use global code to define constants that will be used in multiple transforms or define helper functions you want to use repeatedly. Learn more about how to use global code.
Console
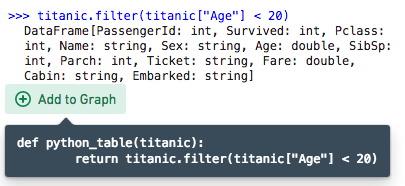
On the right side of the workbook, the console provides a REPL (read-evaluate-print loop), enabling rapid, ad-hoc analysis of any dataset on the graph. Learn more about how to use the console in each Workbook language.
Beneath the console, use the Variables pane to set the input type of a given transform in the console.
If a console command returns a dataframe, you can use the + Add to graph button to convert the console command into a transform. This allows you to experiment with logic in the console before promoting it to be a repeatable transform.
You can use the keyboard shortcut Ctrl+Shift+Enter on Windows or Cmd+Shift+Enter on macOS to send code from a transform directly to the console.
中文翻译
工作簿(Workbooks)
在代码工作簿(Code Workbook)中,您主要交互的资源是工作簿(Workbook)。工作簿用于从Foundry导入数据集,并对这些输入数据集进行转换,用途包括:
- 清理和合并从外部源导入的原始数据,以生成供其他用户使用的精选数据集。
- 分析已处理的数据源以获取有价值的见解。
- 训练和应用模型以进行预测分析。
- 创建参数化可视化以在报告中展示。
图谱(Graph)
工作簿界面的核心组件是图谱(Graph)。图谱展示了数据如何流经工作簿中的逻辑步骤以产生输出。
输入数据集从Foundry的其他位置导入,用作工作簿中的源数据。除输入数据集外,图谱中的每个节点代表一个转换(transform)。转换是一段逻辑,可以返回一个输出数据框或模型,并可能渲染一个可视化。一个转换可以保存为派生数据集(dataset)。当转换保存为派生数据集时,运行该转换将自动将结果写入Foundry,使其可以在该代码工作簿之外使用,并轻松与他人共享。
代码工作簿中有三种类型的转换:
- 代码(Code) 转换允许您编写代码来处理输入并返回结果。
- 模板(Template) 转换提供基于表单的转换代码界面,使代码的复用和共享变得简单。
- 手动输入(Manual entry) 转换允许用户将数据输入到节点中。
浏览图谱
点击图谱中的任意转换,以打开界面底部的逻辑(Logic)面板。这使您可以查看和编辑转换逻辑,并查看转换输出。您可以通过在Windows上按Ctrl+Click或在macOS上按Cmd+Click来选择图谱中的多个转换。
为帮助浏览大型工作簿,您可以使用图谱左下角的缩放选项,其中包括一个适应窗口(Zoom to fit)按钮,可缩放图谱以使所有转换都显示在视图中。
与转换交互
与转换交互的一个关键方式是通过上下文菜单(context menu),您可以通过点击图谱中每个转换右上角的省略号(...)来打开它,或者通过在图谱或侧边栏中右键点击该转换来打开。
此菜单提供一系列有用的操作,包括添加新的下游转换、运行与此数据集关联的转换,或从工作簿中删除此转换。对于保存为数据集的转换,操作(Actions)选项允许您访问与该数据集关联的常用Foundry操作。
如果您选择了多个转换(通过在Windows上使用Ctrl+Click或在macOS上使用Cmd+Click),您可以右键点击图谱上的任意位置,为所有选中的转换打开上下文菜单。这对于添加具有多个输入的新转换,或同时运行多个转换非常有用。
将鼠标悬停在工作簿中的数据集名称上,将打开一个工具提示,显示该数据集在Foundry中的完整路径。
路径(Paths)
您可以在工作簿顶部切换到路径(Paths)视图。路径视图是一种替代模式,允许在工作簿内进行线性开发。路径视图非常适合深入分析单个数据集并执行顺序转换步骤的工作流。
路径可以从导入工作簿的数据集开始,也可以从工作簿中创建的转换开始。在路径视图中,使用左侧边栏在路径之间导航。
在路径视图中创建的所有转换也会持久化到图谱中。通过点击路径节点上的在图谱中打开转换(Open transform in Graph)图标(![]() ),从路径节点导航到图谱。
),从路径节点导航到图谱。
在图谱中,您可以通过查看节点之间边上的注释来了解哪些节点是路径的一部分。将鼠标悬停在注释上以打开源路径。
您也可以点击节点上的路径图标,在其源路径中打开它。
全屏编辑器(Full Screen Editor)
您可能希望专注于一个转换,并在全屏模式下与该转换进行交互。从图谱或路径视图中,点击给定节点上的展开按钮(![]() )以在全屏编辑器中查看。
)以在全屏编辑器中查看。
在全屏模式下,您可以通过使用停靠操作或拖放来重新排列标签页,以便同时查看两个标签页。
要退出全屏编辑器并返回图谱或路径,请使用Esc键或选择折叠按钮(![]() )。
)。
窗格(Panes)
代码工作簿有三个界面窗格 - 内容(Contents)、全局代码(Global Code)和控制台(Console) - 这些窗格在图谱、路径视图和全屏编辑器中始终可用。
内容(Contents)
在界面的左侧,点击内容(Contents)栏以打开工作簿内容窗格。
在图谱模式下,内容窗格按顺序显示图谱中所有转换的列表,以总结整个工作簿。默认情况下,此转换列表按拓扑顺序排序;输入数据集位于顶部,最下游的转换位于底部。在列表中的每个转换旁边,有一个缩放按钮,可以将图谱居中于该转换。您也可以使用空格键放大选中的转换。点击编辑已保存的数据集(Edit Saved Datasets)以更改哪些转换(如果有)保存为数据集。
在路径视图中,内容窗格显示工作簿中所有转换的迷你图谱,允许在节点之间快速导航。
全局代码(Global Code)
使用工作簿界面右侧的全局代码窗格来定义代码(如变量或函数),这些代码将在整个工作簿中该语言的所有代码转换中可用。例如,您可以使用全局代码定义将在多个转换中使用的常量,或定义您希望重复使用的辅助函数。了解更多关于如何使用全局代码的信息。
控制台(Console)
在工作簿的右侧,控制台提供了一个REPL(读取-求值-打印循环),支持对图谱上的任何数据集进行快速的临时分析。了解更多关于如何在每种工作簿语言中使用控制台的信息。
在控制台下方,使用变量(Variables)窗格来设置控制台中给定转换的输入类型。
如果控制台命令返回一个数据框,您可以使用+ 添加到图谱(Add to graph)按钮将该控制台命令转换为一个转换。这允许您在将其提升为可重复使用的转换之前,先在控制台中试验逻辑。
您可以使用键盘快捷键(Windows上为Ctrl+Shift+Enter,macOS上为Cmd+Shift+Enter)将代码从转换直接发送到控制台。