Debug transforms(调试转换(debug transforms))
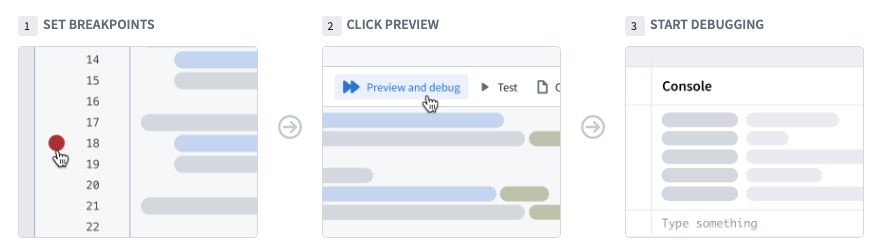
Use the debugger tool in Code Repositories to examine your data transformation behavior while it runs. Set breakpoints to pause the execution of the transform in order to examine variables, view dataframes, and understand functions and libraries.
:::callout The debugger is only available for Python. :::
Setting breakpoints
To use the debugger, you need to set breakpoints. Breakpoints signal to the debugger the points where it should pause the execution of the code and allow you to interact with variables and dataframes.
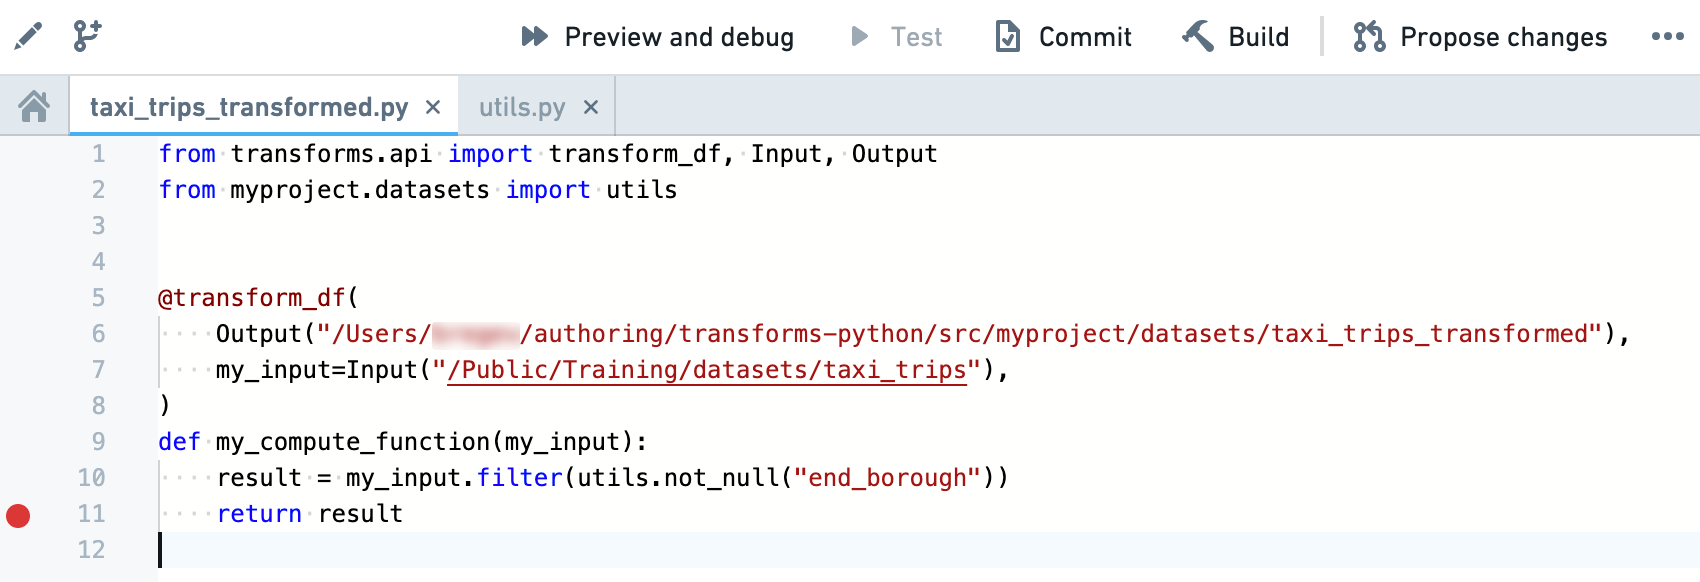
You can set a breakpoint by clicking on the faded red dot in the margins of each line of code. The debugger suspends the execution before the marked line runs. You can set multiple breakpoints across several files if needed.
:::callout{theme="neutral"} The console functionality might be limited when using internal library breakpoints. In these cases the breakpoint is colored in grey and the debugger offers to either ignore the breakpoint or use limited console functionality. :::
Running the debugger
After adding breakpoints in your code, click on Preview and debug in the code editor actions bar. The debugger panel opens and pauses on the first breakpoint it encounters. The left bar of the debugger allows you to navigate the code, remove breakpoints, and finish/stop the debugging session.
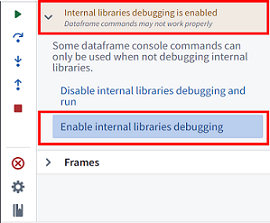
You can enable the ability to navigate internal libraries. Locate the Internal libraries debugging is disabled section, and select Enable internal libraries debugging.
As you navigate in the code, the editor highlights the line of code to be executed next. Use the following buttons to advance the debugger:
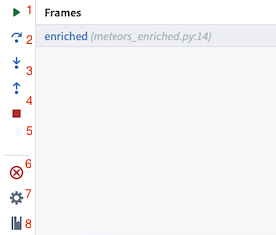
- Resume execution: Continue execution until completion or until paused by the next breakpoint.
- Step over: Execute the line of code without stepping into internal functions.
- Step into: Navigate into internal functions if they exist in that line of code.
- Step out: Navigate out of an internal function and advance the debugger.
- Stop execution: Stop the debugger completely.
- Remove breakpoints: Remove all breakpoints from the repository and run the preview without pausing the execution.
- Settings: Toggle the debugger on/off (without clearing the breakpoints).
- Documentation: Open the documentation for additional details.
Previewing dataframes
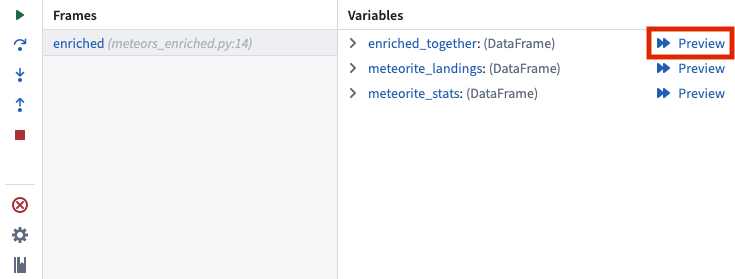
When running the debugger, you can also preview an intermediate dataframe at each breakpoint. To do this, select Preview in the variables view:
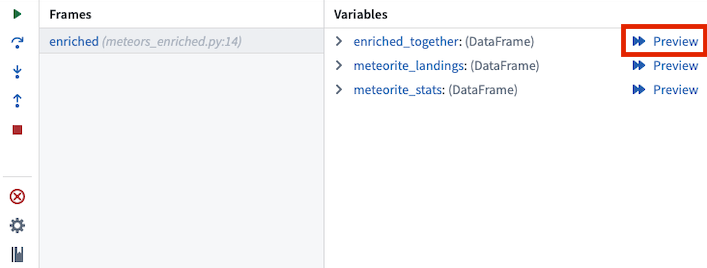
Selecting Preview will open a debugger preview panel for the selected dataframe:
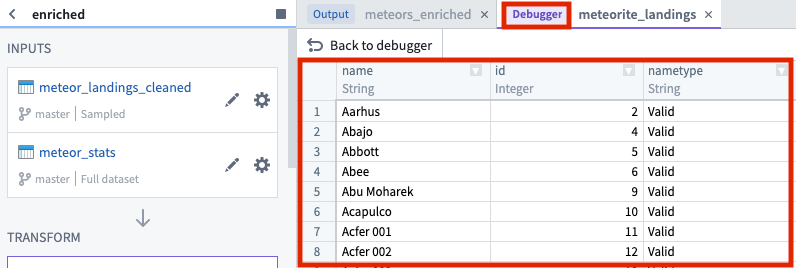
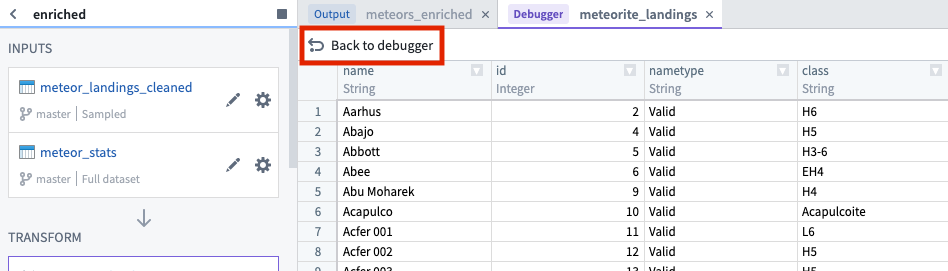
To return to the debugger, select Back to debugger:
Examining variables
While the debugger is running you can examine the variables and data at the exact point of code execution.
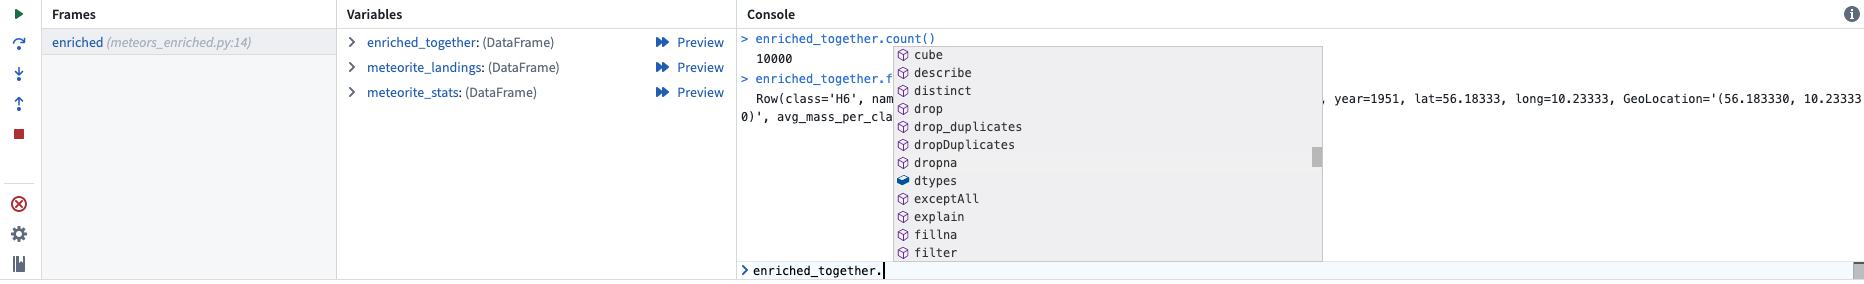
Frames
Frames represent the functions in which the debugger is active or breakpoints exist. Each frame indicates the name of the function followed by the name of the file and the line number in which the function is written.
Select a frame to examine the variables within that frame and run console commands against it.
Variables
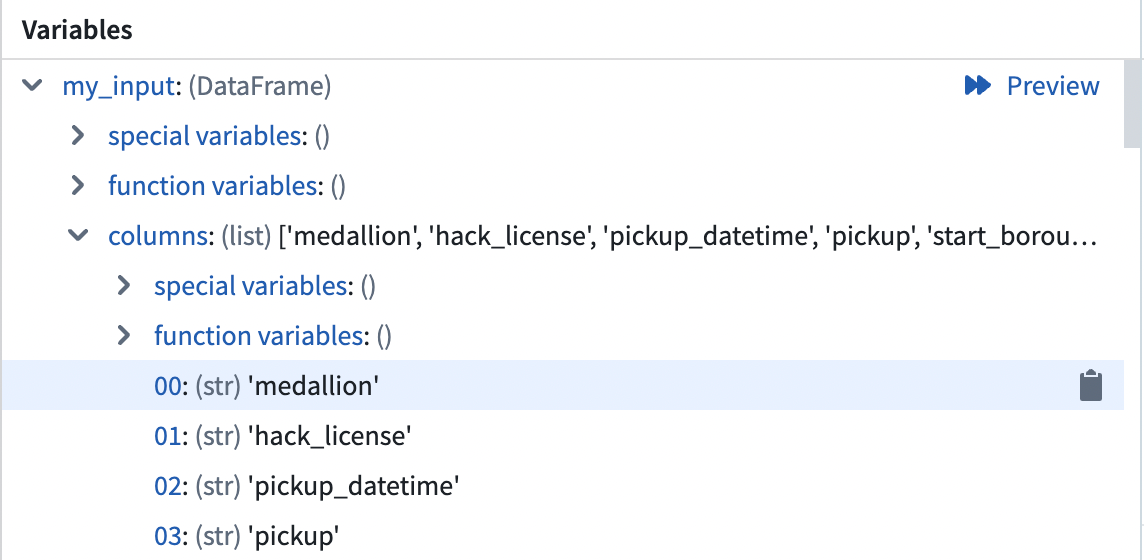
The variables section shows the values stored in both local and global variables while the transform is executed.
:::callout{theme="neutral"} Dataframe values are based on the preview sample and may not represent the full dataset. Use them to understand and debug your code but not as an indication for the transform output. :::
Console
The console allows you to interact with your data using PySpark commands while running the debugger. There are two commonly used patterns in the console:
- Running commands against dataframes and variables directly in the command line at the bottom of the console tab while initiating commands with the Enter or Return key.
- Calling the
printfunction in the transform code to send indicative information to the console.
:::callout{theme="neutral"} Notice that the console runs against the selected frame. Trying to execute commands on variables local to a different frame will result in a NameError. :::
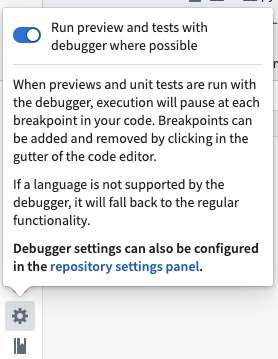
Configuring the debugger
Toggle the debugger functionality on and off by navigating to the debugger tab and clicking on the settings cog. Turn the debugger off if you want to run previews without stopping on breakpoints.
:::callout{theme="neutral"} While the debugger configuration applies to the entire repository, there might be languages in the repository that are not supported by it. If a language is not supported by the debugger, previews will continue to function normally regardless of the debugger setting. :::
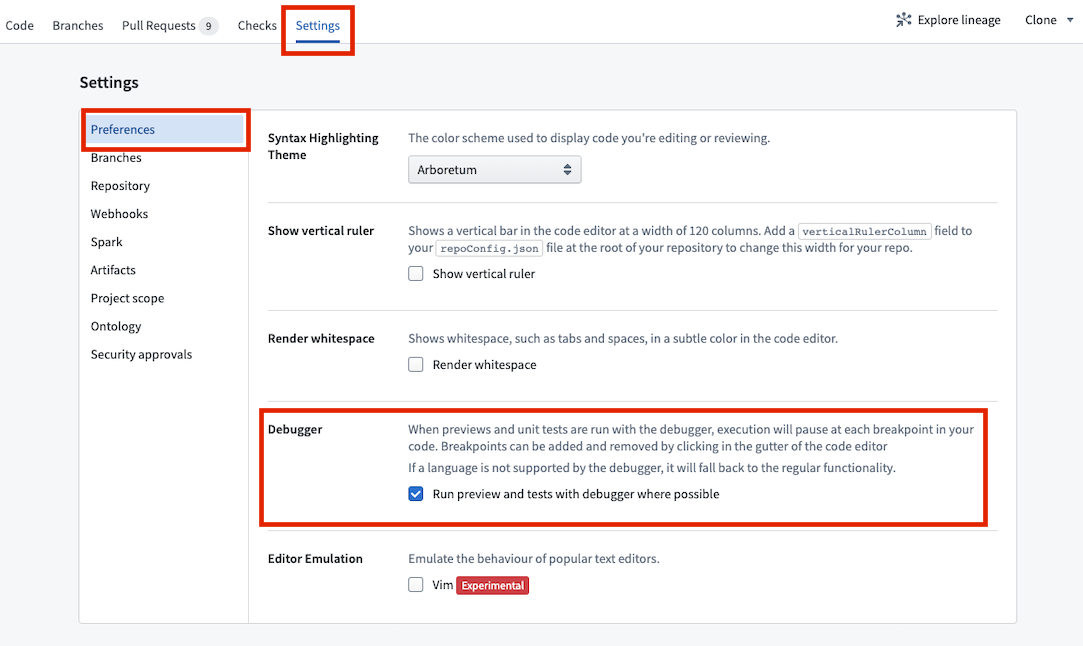
You can also configure the debugger in the Settings tab under Preferences > Debugger.
中文翻译
调试转换(debug transforms)
使用代码仓库(Code Repositories)中的调试器工具,在数据转换运行时检查其行为。设置断点以暂停转换执行,从而检查变量、查看数据框(dataframes)并理解函数和库。
:::callout 调试器仅适用于 Python。 :::
设置断点
要使用调试器,您需要设置断点(breakpoints)。断点向调试器指示应在哪些位置暂停代码执行,以便您与变量和数据框进行交互。
您可以通过单击每行代码边缘的淡红色圆点来设置断点。调试器会在标记行执行前暂停执行。如有需要,您可以在多个文件中设置多个断点。
:::callout{theme="neutral"} 当使用内部库断点时,控制台功能可能会受限。在这种情况下,断点会显示为灰色,调试器会提供忽略该断点或使用有限控制台功能的选项。 :::
运行调试器
在代码中添加断点后,点击代码编辑器操作栏中的预览并调试(Preview and debug)。调试器面板将打开,并在遇到的第一个断点处暂停。调试器左侧栏允许您导航代码、移除断点以及结束/停止调试会话。
您可以启用导航内部库的功能。找到内部库调试已禁用(Internal libraries debugging is disabled)部分,然后选择启用内部库调试(Enable internal libraries debugging)。
在代码中导航时,编辑器会高亮显示下一步要执行的代码行。使用以下按钮推进调试器:
- 恢复执行(Resume execution): 继续执行直到完成或遇到下一个断点暂停。
- 单步跳过(Step over): 执行代码行但不进入内部函数。
- 单步进入(Step into): 如果该行代码中存在内部函数,则进入其中。
- 单步跳出(Step out): 跳出内部函数并推进调试器。
- 停止执行(Stop execution): 完全停止调试器。
- 移除断点(Remove breakpoints): 从仓库中移除所有断点,并运行预览而不暂停执行。
- 设置(Settings): 开启/关闭调试器(不清除断点)。
- 文档(Documentation): 打开文档获取更多详细信息。
预览数据框
运行调试器时,您还可以在每个断点处预览中间数据框。为此,请在变量视图中选择预览(Preview):
选择预览将打开所选数据框的调试器预览面板:
要返回调试器,请选择返回调试器(Back to debugger):
检查变量
调试器运行时,您可以在代码执行的精确位置检查变量和数据。
帧(Frames)
帧表示调试器处于活动状态或存在断点的函数。每个帧显示函数名称,后跟文件名以及编写该函数的行号。
选择一个帧以检查该帧内的变量,并对其运行控制台命令。
变量(Variables)
变量部分显示转换执行时存储在局部变量和全局变量中的值。
:::callout{theme="neutral"} 数据框值基于预览样本,可能不代表完整数据集。请使用它们来理解和调试代码,但不要将其视为转换输出的指示。 :::
控制台(Console)
控制台允许您在运行调试器时使用 PySpark 命令与数据进行交互。控制台中有两种常用模式:
- 直接在控制台选项卡底部的命令行中对数据框和变量运行命令,使用 Enter 或 Return 键启动命令。
- 在转换代码中调用
print函数,将指示性信息发送到控制台。
:::callout{theme="neutral"} 请注意,控制台是针对所选帧运行的。尝试对另一个帧的局部变量执行命令将导致 NameError。 :::
配置调试器
通过导航到调试器选项卡并点击设置齿轮图标,可以开启或关闭调试器功能。如果您希望运行预览时不在断点处停止,请关闭调试器。
:::callout{theme="neutral"} 虽然调试器配置适用于整个仓库,但仓库中可能存在调试器不支持的语言。如果某种语言不受调试器支持,预览将继续正常运行,不受调试器设置的影响。 :::
您也可以在设置(Settings)选项卡中的偏好设置(Preferences) > 调试器(Debugger)下配置调试器。