Metrics(指标(Metrics))
Use the Metrics telemetry tab to debug and monitor your builds.
Access metrics
Follow the steps below to view metric details. Note that the Metrics tab will only display if the job has emitted metrics.
- View the build report:
- From a Dataset Preview or from Data Lineage, select the History tab, select an individual build from the list, then select View build report.
- Select a build from the list of all builds.
- Select a job: A build consists of one or more jobs, which are visible in the list below the Gantt chart. Choose a job from the list, select the Telemetry option, and select the Metrics tab to see metrics emitted by the build container plotted on time-series charts.
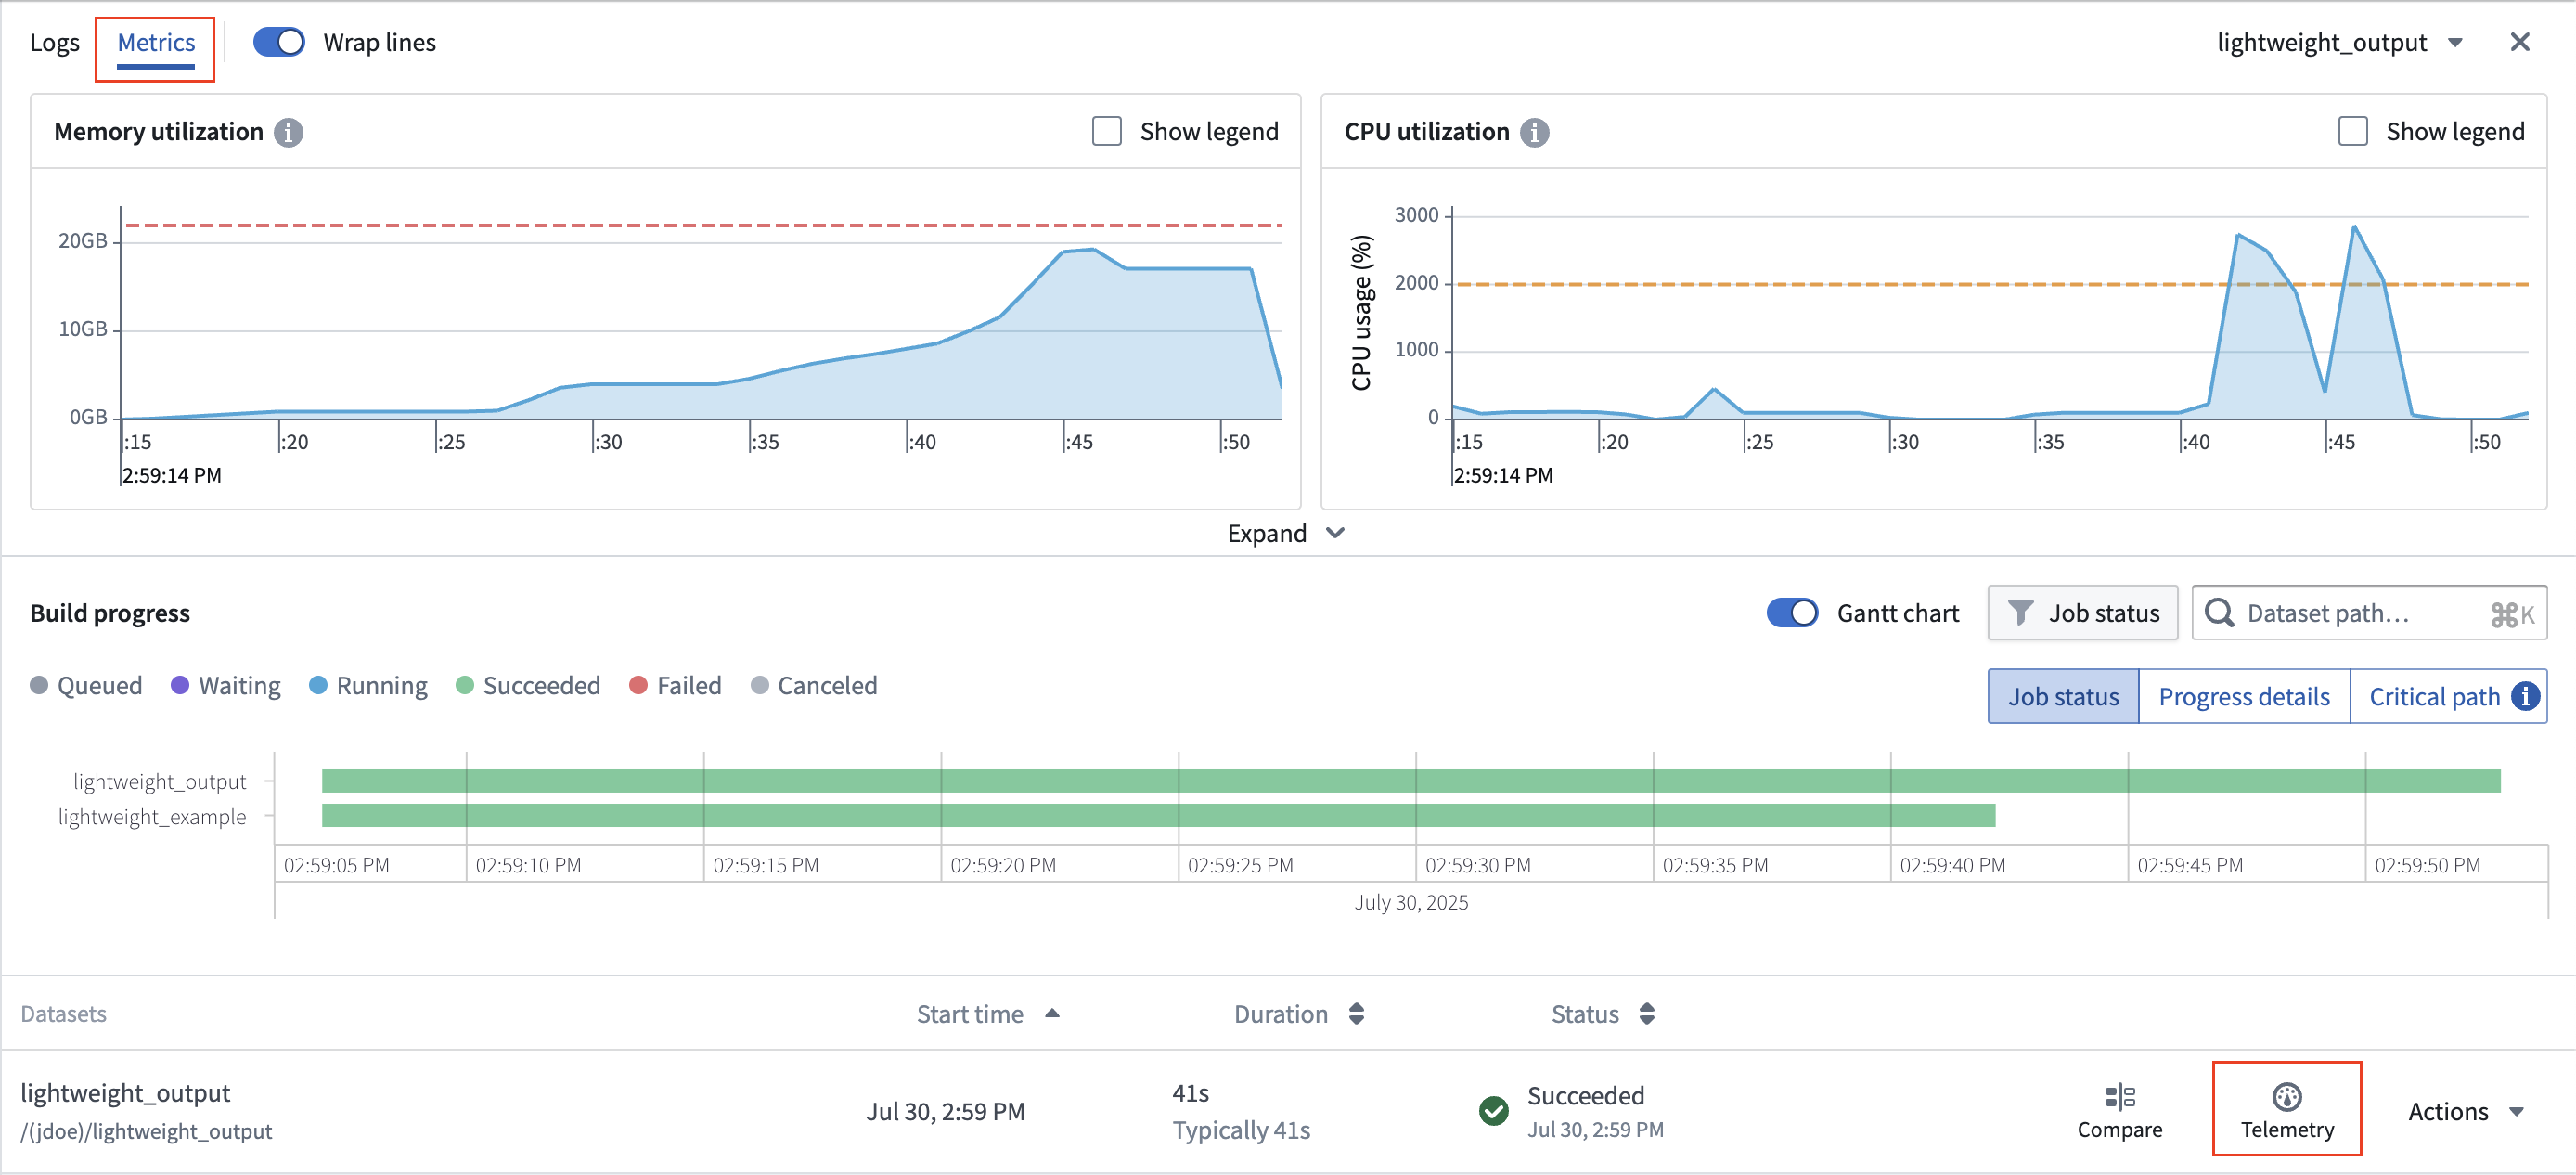
Memory utilization
The Memory utilization graph shows your build's memory usage. The red dashed line signifies the memory limit requested from the build. Any build that exceeds this will cause the container to throw an out-of-memory (OOM) error.
The following example shows a build that has thrown an OOM error, which means that the build is memory-bound. Memory usage rises, and eventually leads to an OOM. If you encounter an OOM error, increase the container's memory limits by setting container memory to 32 GB or another appropriate value.

The example below shows a build that underutilizes the requested memory. This build does not come close to reaching memory limits, so setting the memory request to 32 GB would reduce resource consumption for this particular build.

CPU utilization
The CPU utilization graph shows your build's CPU usage. The orange dashed line shows your build's requested CPUs. Two cores are requested by default. The build scheduler will wait until it can allocate your job on a host that has sufficient cores available to fill your request. Any extra unused cores on the host will automatically be provisioned to help run the build.
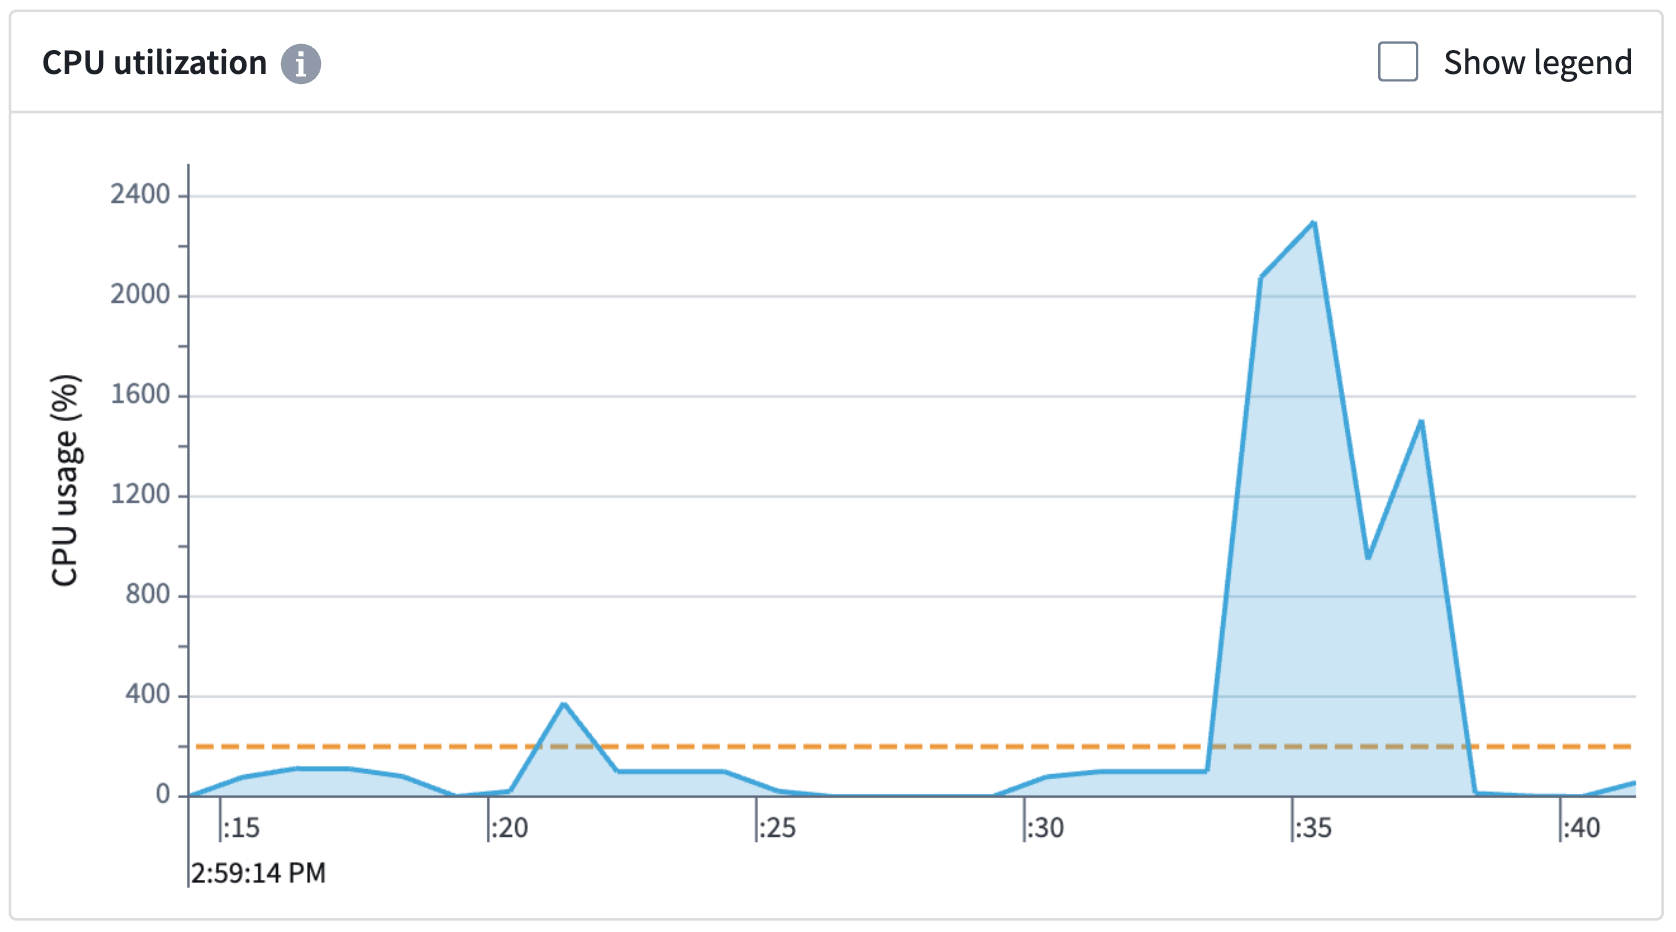
In the example above, two CPUs were requested, but 22 were used to help speed up the build. Be aware that the host is not guaranteed to always have additional CPUs to allocate during the build.
| Request | Result |
|---|---|
1 CPU core |
Builds will start up faster as the scheduler will be able to find free hosts easier. Build times may be inconsistent as available CPU resources may vary. |
8 CPU cores |
Builds will take longer on average to start as the scheduler may struggle to find hosts with free cores. Build times may be more consistent as 8-core availability will be guaranteed during the build. |
中文翻译
指标(Metrics)
使用指标(Metrics)遥测选项卡来调试和监控您的构建(build)。
访问指标
按照以下步骤查看指标详情。请注意,指标(Metrics)选项卡仅在作业(job)已发出指标时才会显示。
- 查看构建报告:
- 从数据集预览(Dataset Preview)或数据沿袭(Data Lineage)中,选择历史记录(History)选项卡,从列表中选择单个构建,然后选择查看构建报告(View build report)。
- 从所有构建(all builds)列表中选择一个构建。
- 选择作业: 一个构建由一个或多个作业组成,这些作业在甘特图(Gantt chart)下方的列表中可见。从列表中选择一个作业,选择遥测(Telemetry)选项,然后选择指标(Metrics)选项卡,即可查看构建容器(container)发出的指标在时间序列图表上的绘制结果。
内存利用率(Memory utilization)
内存利用率(Memory utilization)图表显示构建的内存使用情况。红色虚线表示构建请求的内存限制。任何超出此限制的构建都会导致容器抛出内存不足(OOM)错误。
以下示例显示了一个抛出OOM错误的构建,这意味着该构建受内存限制。内存使用量上升,最终导致OOM。如果遇到OOM错误,请通过将容器内存设置为32 GB或其他适当值来增加容器的内存限制。
下面的示例显示了一个未充分利用请求内存的构建。该构建远未达到内存限制,因此将内存请求设置为32 GB将减少此特定构建的资源消耗。
CPU利用率(CPU utilization)
CPU利用率(CPU utilization)图表显示构建的CPU使用情况。橙色虚线表示构建请求的CPU数量。默认情况下请求两个核心。构建调度器(scheduler)会等待,直到能在具有足够可用核心的主机(host)上分配您的作业。主机上任何额外的未使用核心将自动分配以帮助运行构建。
在上面的示例中,请求了两个CPU,但实际使用了22个来帮助加速构建。请注意,主机并不保证在构建期间始终有额外的CPU可供分配。
| 请求 | 结果 |
|---|---|
1个CPU核心 |
构建启动速度更快,因为调度器更容易找到空闲主机。由于可用CPU资源可能变化,构建时间可能不一致。 |
8个CPU核心 |
构建平均启动时间更长,因为调度器可能难以找到有空闲核心的主机。由于构建期间保证有8个核心可用,构建时间可能更稳定。 |