Debug functions(调试函数)
:::callout{theme="warning"} The following documentation is specific to TypeScript v1 functions. For more robust capabilities, including support for Ontology SDK and configurable resource requests, we recommend migrating to TypeScript v2. :::
As you write functions, you will likely need to inspect the state of your execution to fix issues with code correctness or performance. Below are features you can use to do this. Note that these debugging steps also apply to unit tests.
Authoring debugger
Use the debugger tool in Code Repositories to examine the behavior of your unit test while it runs. Set breakpoints to pause the execution of the unit test in order to examine variables, and understand functions and libraries.
Set breakpoints
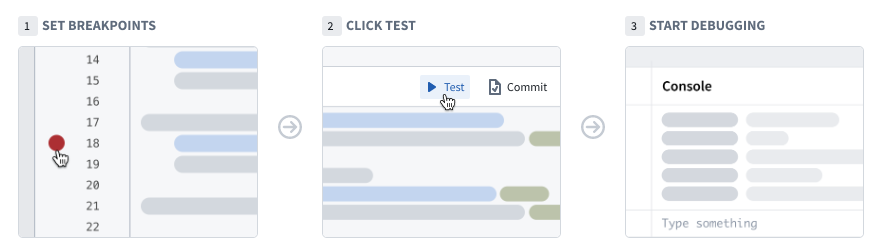
To use the debugger, you need to set breakpoints. These breakpoints indicate the specific points where the debugger should pause the code execution, enabling you to interact with variables.
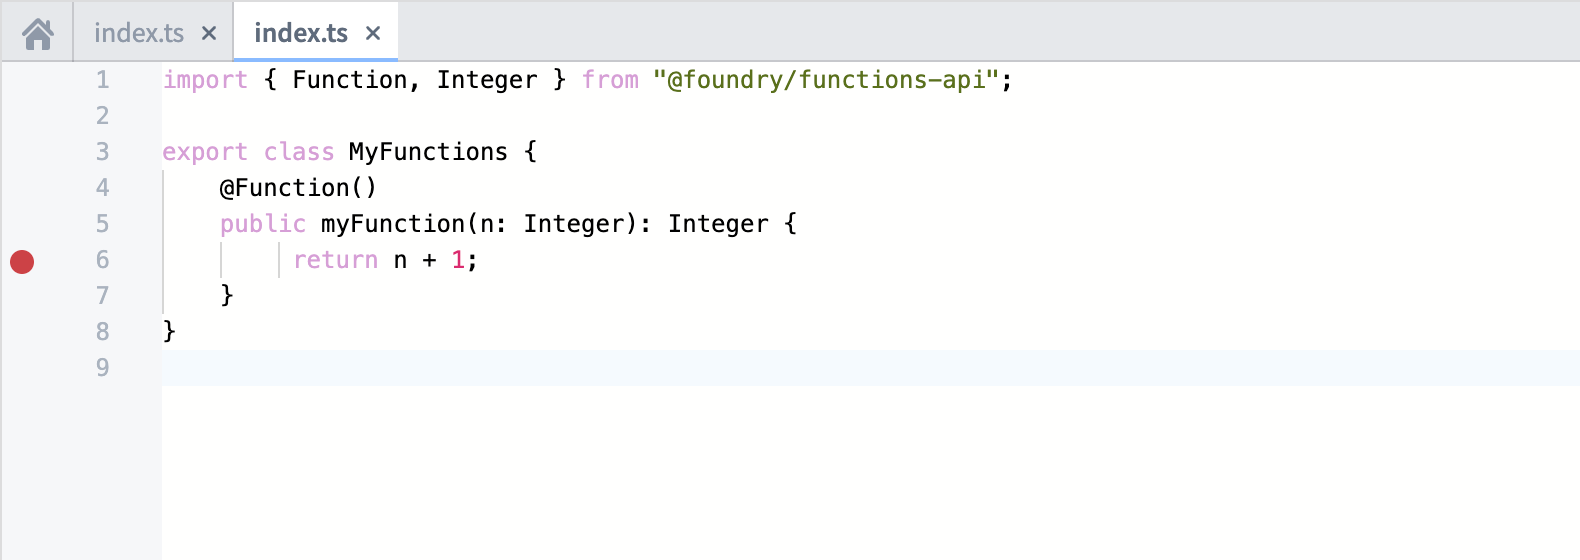
Set a breakpoint by selecting the faded red dot in the margins of each line of code. The debugger suspends the execution before the marked line runs. You can set multiple breakpoints across several files, if needed.
Run the debugger
During live preview
After adding breakpoints in your code, select Run and debug, located in the functions panel.

During testing
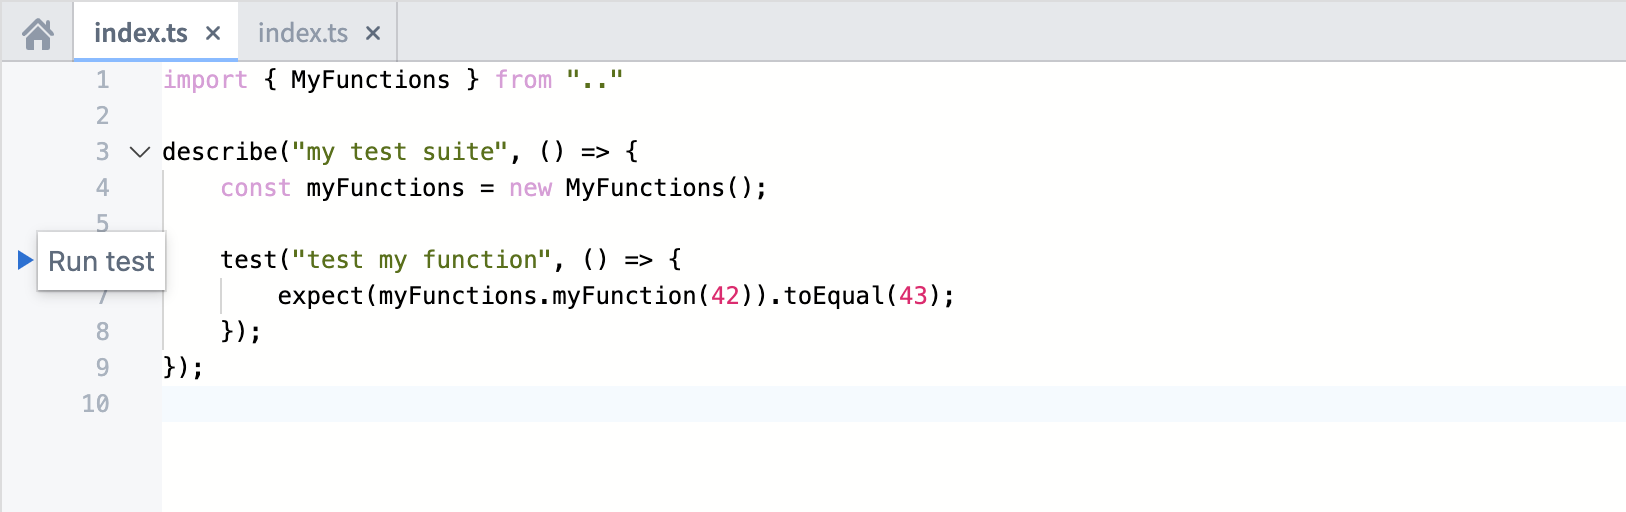
After adding breakpoints in your code, select Run test, located next to the unit test in the code editor.
Use the debugger
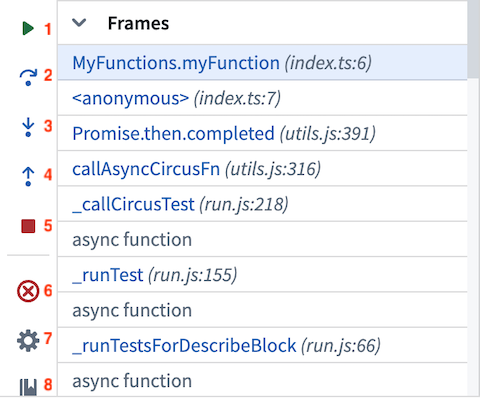
Once the debugger has started, the debugger panel will open and pause on the first breakpoint it encounters. The left bar of the debugger allows you to navigate the code, remove breakpoints, and finish or stop the debugging session.
As you navigate the code, the editor highlights the line of code to be executed next. Use the following buttons to advance the debugger:
- Resume execution: Continue execution until completion or until paused by the next breakpoint.
- Step over: Execute the line of code without stepping into internal functions.
- Step into: Navigate into internal functions if they exist in that line of code.
- Step out: Navigate out of an internal function and advance the debugger.
- Stop execution: Stop the debugger completely.
- Remove breakpoints: Remove all breakpoints from the repository and run the unit test without pausing the execution.
- Settings: Toggle the debugger on/off (without clearing the breakpoints).
- Documentation: Open the documentation for additional details.
Examine variables
While the debugger is running, you can examine the variables and data at the exact point of code execution.
Frames
Frames represent the functions in which the debugger is active or in which breakpoints exist. Each frame indicates the name of the function followed by the name of the file and the line number in which the function is written.
Select a frame to examine the variables within that frame and run console commands against it.
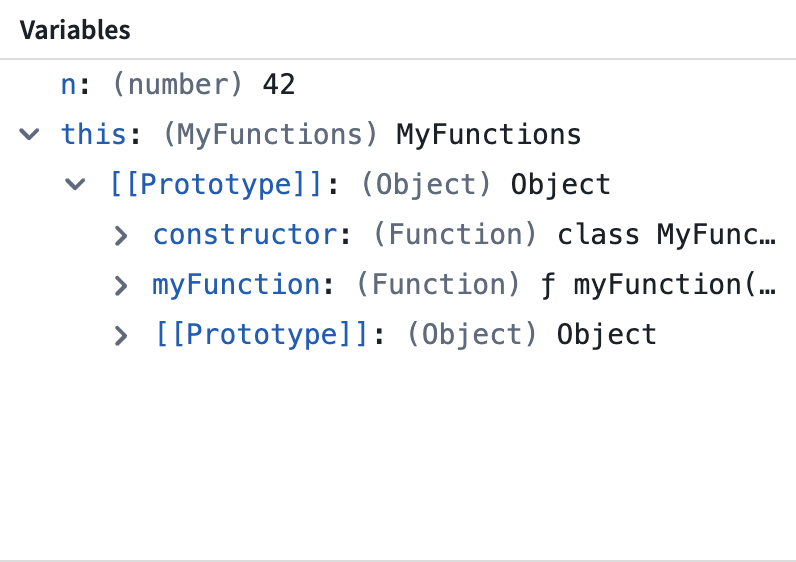
Variables
The variables section displays the values stored in both local and global variables while the transform is executed.
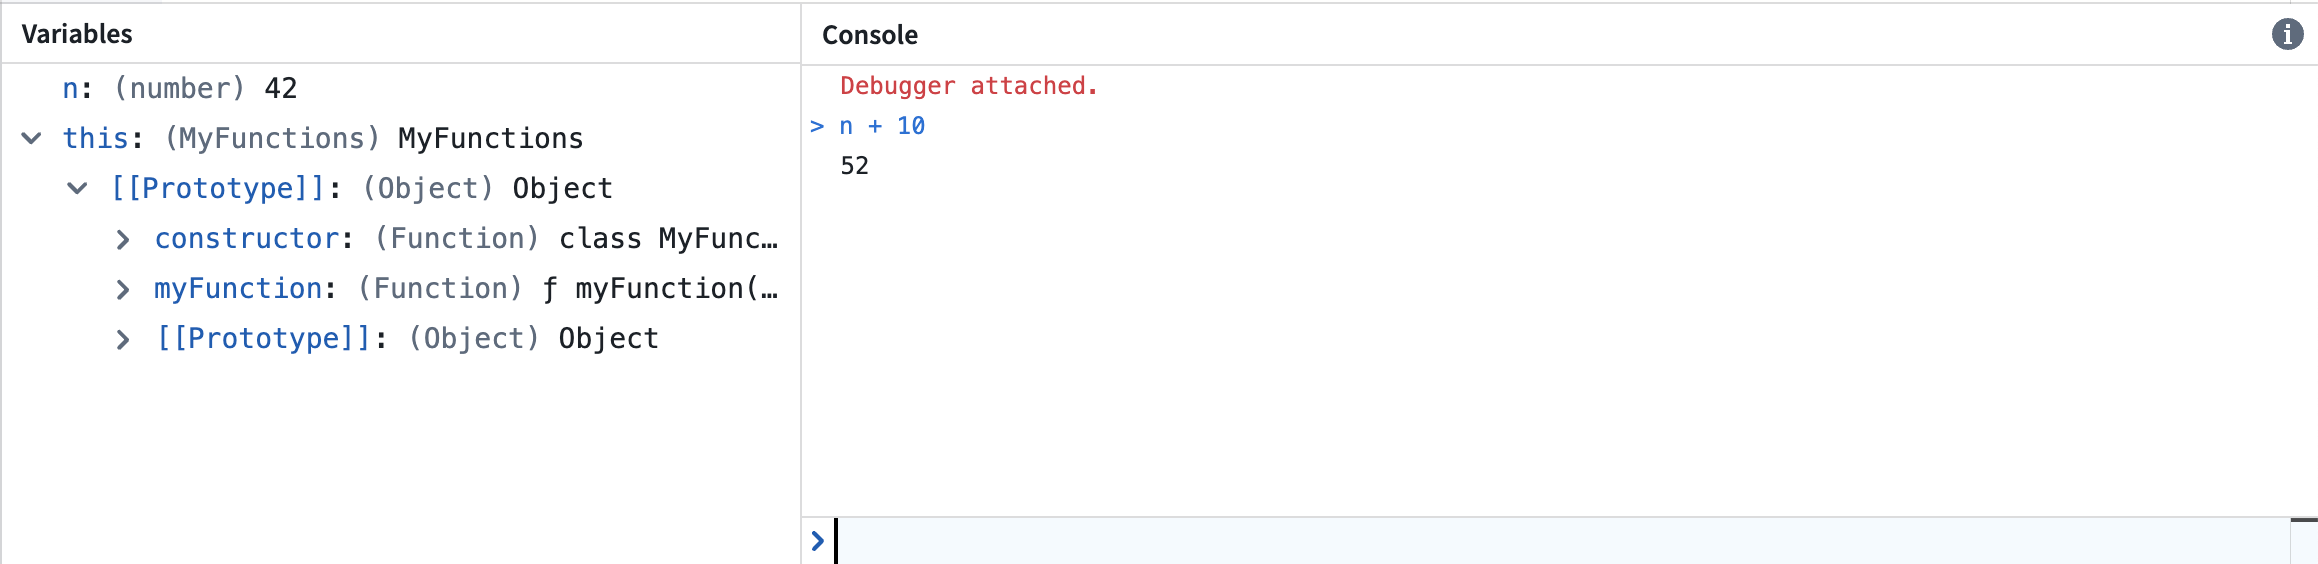
Console
The console allows you to interact with your data using JavaScript console commands while running the debugger.
:::callout{theme="neutral"} Note that the console operates within the context of the selected frame. Attempting to execute commands on variables local to a different frame will lead to an error. :::
Console logging
Functions supports emitting console logs during execution for debugging purposes. To do so, simply use the console.log command to emit logs. For example:
    @Function()
    public testConsoleLogging(n: Integer): Integer {
        for (let i = 0; i < n; i++) {
            console.log(`Iteration ${i}`);
        }
        return n;
    }
Using console logs in this way can be useful for debugging correctness issues. You can also add console logs to identify performance bottlenecks in your code. See the guide for optimizing performance for more information on how to improve the performance of link traversal logic.
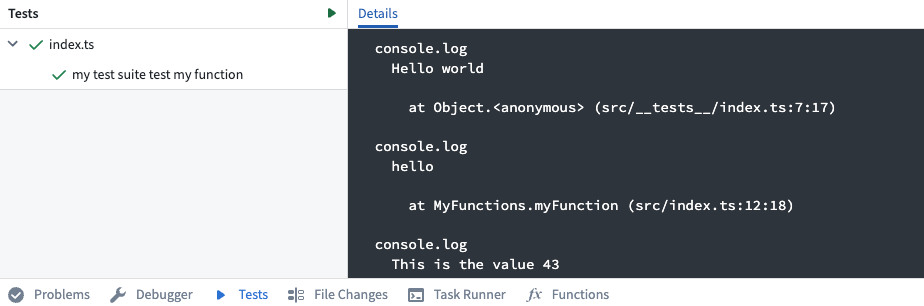
During testing
When you run a function using the Tests helper in Authoring, console logs will be captured and displayed below:
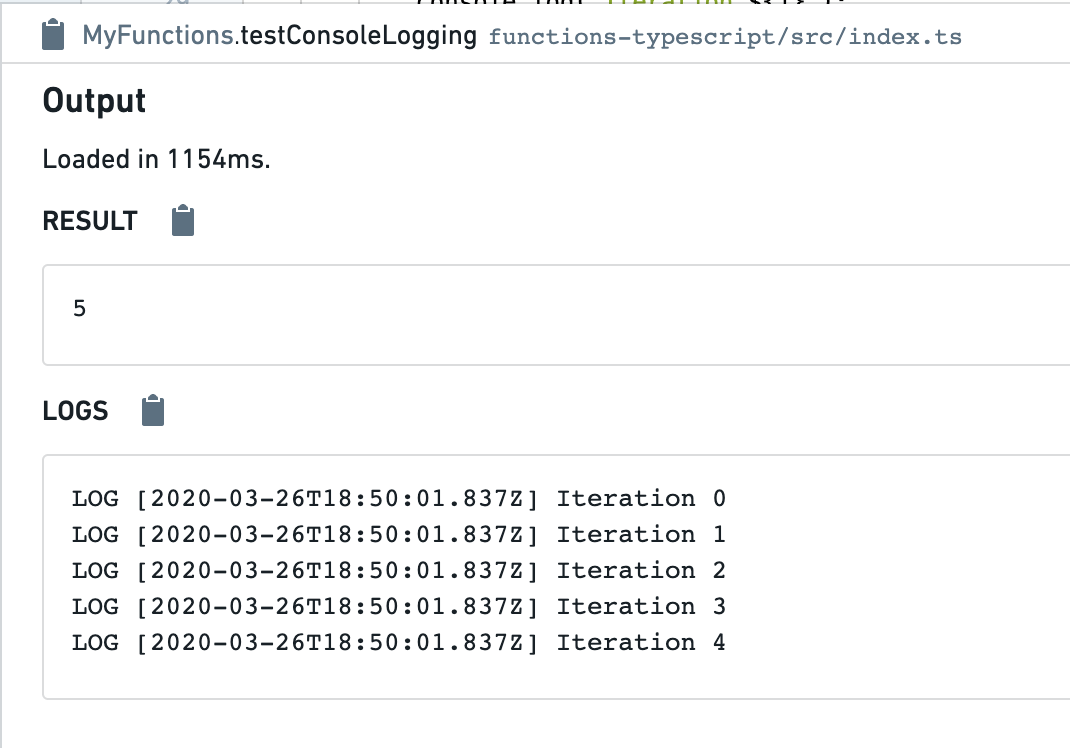
During live preview
When you run a function using the Functions helper in Authoring, console logs will be captured and displayed below, along with timestamps:
中文翻译
调试函数
:::callout{theme="warning"} 以下文档仅适用于 TypeScript v1 函数。如需更强大的功能,包括对 Ontology SDK 和可配置资源请求的支持,我们建议迁移至 TypeScript v2。 :::
在编写函数时,您可能需要检查执行状态以修复代码正确性或性能问题。以下是可用于此目的的调试功能。请注意,这些调试步骤同样适用于单元测试。
编写调试器
使用代码仓库中的调试器工具来检查单元测试运行时的行为。设置断点以暂停单元测试的执行,从而检查变量并理解函数和库。
设置断点
要使用调试器,您需要设置断点。这些断点指示调试器应暂停代码执行的特定位置,使您能够与变量进行交互。
通过点击每行代码边缘的淡红色圆点来设置断点。调试器会在标记行执行之前暂停执行。如有需要,您可以在多个文件中设置多个断点。
运行调试器
在实时预览期间
在代码中添加断点后,选择函数面板中的 运行并调试。
在测试期间
在代码中添加断点后,选择代码编辑器中单元测试旁边的 运行测试。
使用调试器
调试器启动后,调试器面板将打开并暂停在遇到的第一个断点处。调试器的左侧栏允许您导航代码、移除断点以及完成或停止调试会话。
在导航代码时,编辑器会高亮显示接下来要执行的代码行。使用以下按钮推进调试器:
- 恢复执行: 继续执行,直到完成或遇到下一个断点暂停。
- 单步跳过: 执行当前代码行,但不进入内部函数。
- 单步进入: 进入该行代码中存在的内部函数。
- 单步跳出: 跳出内部函数并推进调试器。
- 停止执行: 完全停止调试器。
- 移除断点: 移除仓库中的所有断点,并运行单元测试而不暂停执行。
- 设置: 开启/关闭调试器(不清除断点)。
- 文档: 打开文档以获取更多详细信息。
检查变量
调试器运行时,您可以在代码执行的精确位置检查变量和数据。
帧
帧表示调试器处于活动状态或存在断点的函数。每个帧显示函数名称,后跟文件名和函数所在的行号。
选择一个帧以检查该帧内的变量,并对其运行控制台命令。
变量
变量部分显示转换执行时局部变量和全局变量中存储的值。
控制台
控制台允许您在运行调试器时使用 JavaScript 控制台命令与数据进行交互。
:::callout{theme="neutral"} 请注意,控制台在所选帧的上下文中运行。尝试对属于不同帧的局部变量执行命令将导致错误。 :::
控制台日志记录
函数支持在执行期间输出控制台日志以进行调试。为此,只需使用 console.log 命令输出日志即可。例如:
    @Function()
    public testConsoleLogging(n: Integer): Integer {
        for (let i = 0; i < n; i++) {
            console.log(`迭代 ${i}`);
        }
        return n;
    }
以这种方式使用控制台日志有助于调试正确性问题。您还可以添加控制台日志来识别代码中的性能瓶颈。有关如何改进链接遍历逻辑性能的更多信息,请参阅优化性能指南。
在测试期间
当您使用 编写 中的 测试 辅助工具运行函数时,控制台日志将被捕获并显示在下方:
在实时预览期间
当您使用 编写 中的 函数 辅助工具运行函数时,控制台日志将被捕获并显示在下方,同时附带时间戳: