Dataset Preview(数据集预览)
The Dataset Preview application provides you with a variety of details of a given dataset, including metadata, build history, health, and more. Additional features are available for streaming datasets, including the ability to view information on streaming jobs and metrics to troubleshoot and debug stream performance.
The screenshot below displays the interface of the Dataset Preview application. The numbered sections are explained in more details in the following sections.

1. Dataset header
The header of the page identifies the selected dataset and provides basic information such as its name, display name (if existing), location, and the selected branch. The header also allows some file related operations such as sharing, moving, renaming, and more.
2. Information panel
The information panel provides metadata about the dataset and some basic administrative operations. The panel is divided into three sections:
- About: Information including the time the dataset was created and updated, the users who created and last updated the dataset, the size of the table, any tools and input datasets used to create the data, tags, and more. An Edit schema view is also available under the Updated by section that will infer a schema for CSV and JSON files. Here, users can also apply additional parsing options to drop jagged rows, change encoding, or add additional columns like file path, byte offset for row, import timestamp, or row number. For other file types, schema edits can be made in the Schema section under the Details tab.
- Columns: Information on the different columns in the dataset, including the type of data, description, and data stats (percentage of null values, distributions and samples).
- Schedules: Information about any configured build schedules that will run to update the dataset.
3. Tab views
Preview
The Preview tab provides a sample of the data in a table and allows light interaction with the full dataset. Learn more about the preview table in 4. Preview table.
History
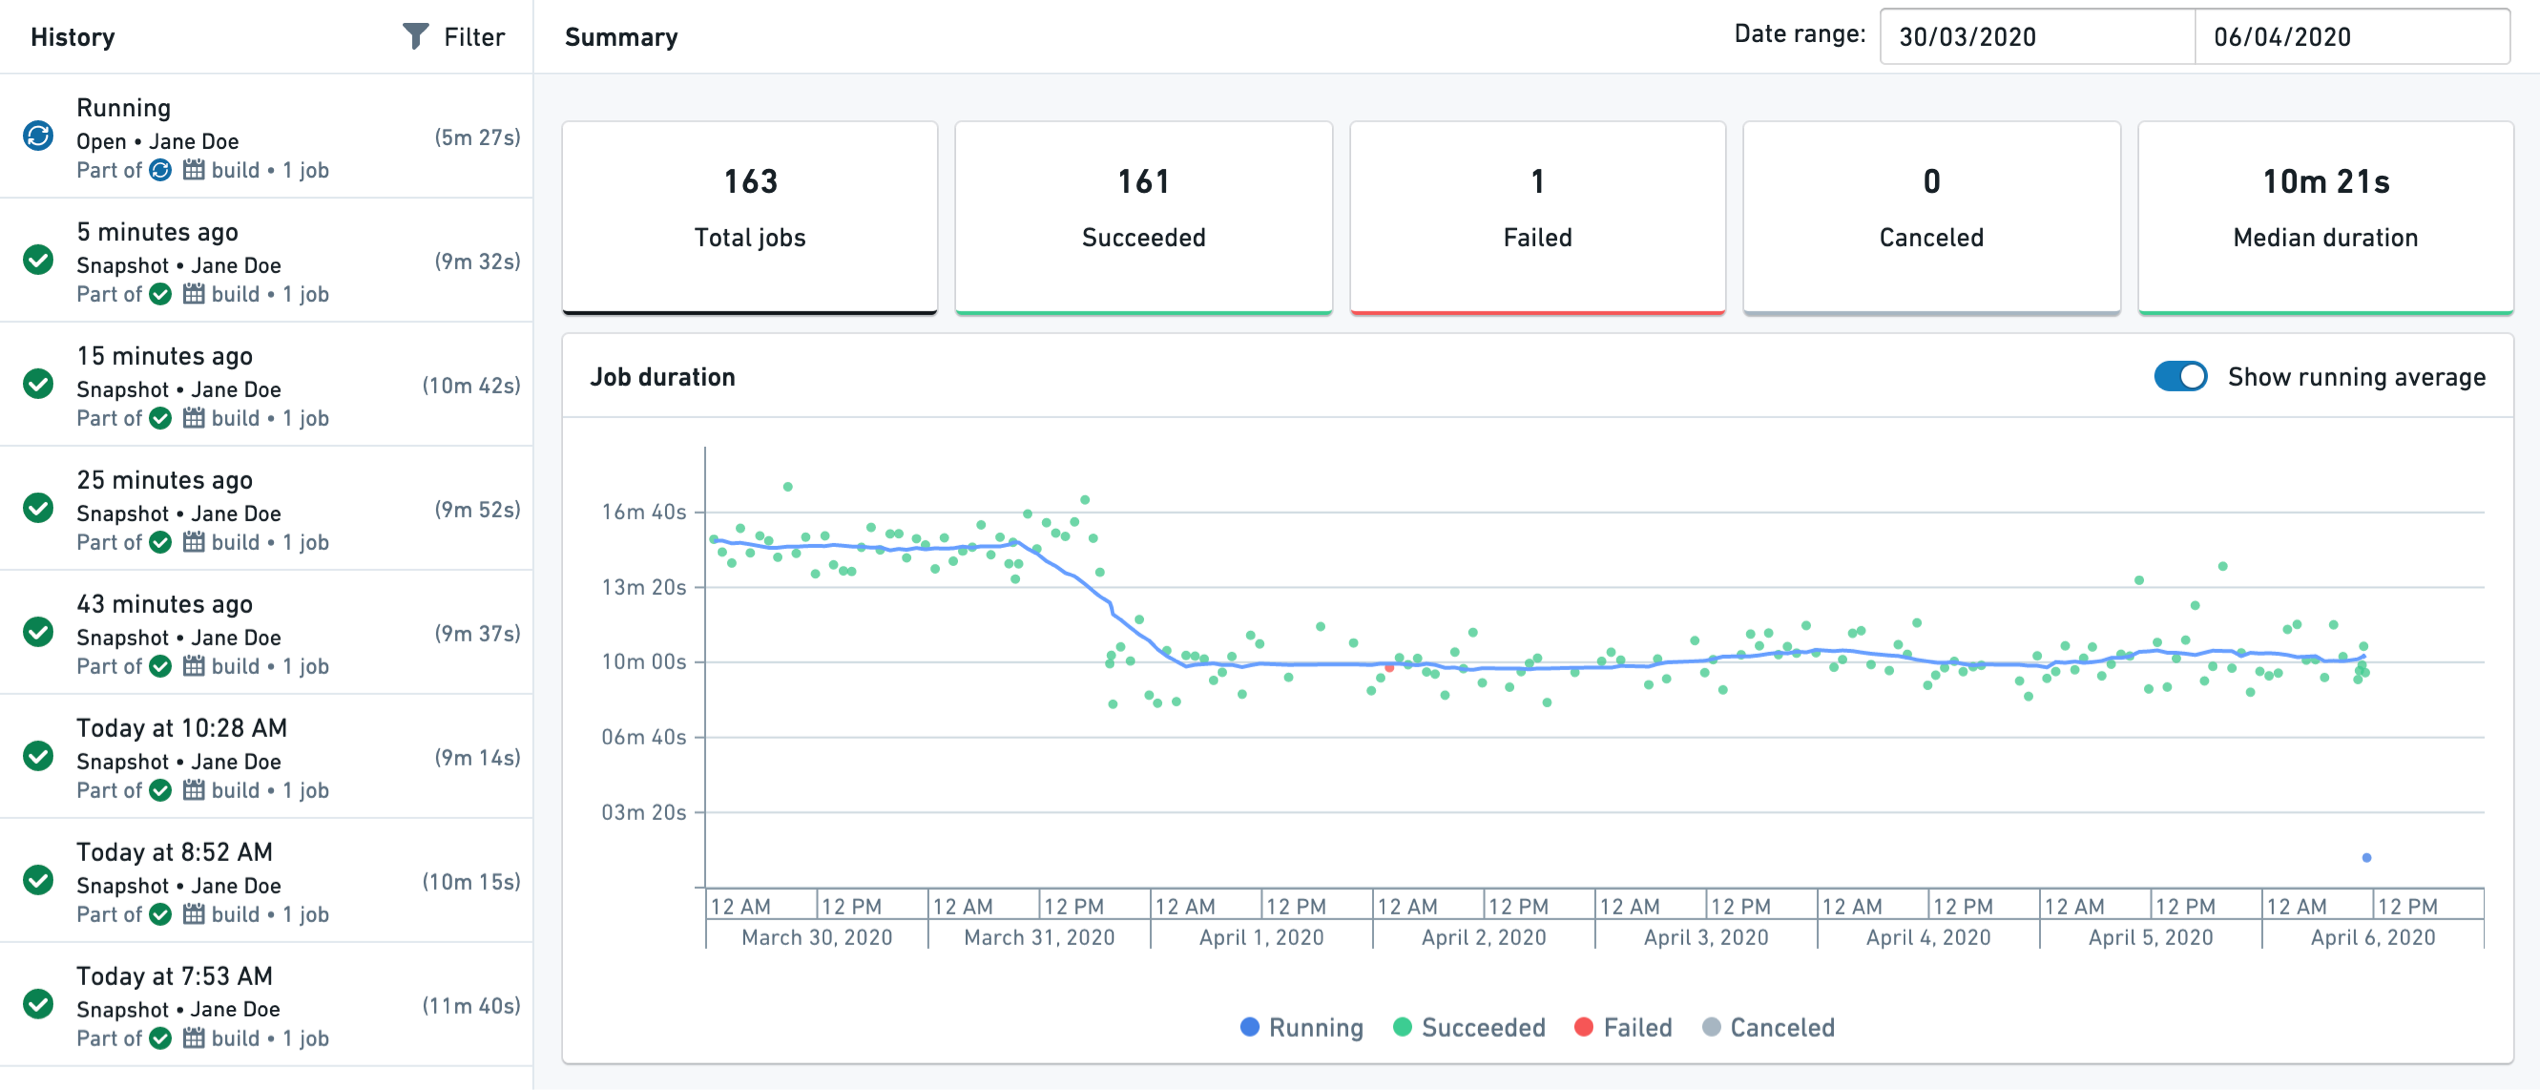
The History tab view provides historical job (build) information. A Summary view on the right side of the page shows aggregated information on job statuses over time.
On the left panel, a list of jobs appears with their statuses and durations. Upon selection, a detailed Job view appears on the right showing detailed job information, including progress, specification, build logs, files and the resulting schema.
:::callout{theme="neutral" title="Streaming datasets"} In streaming datasets, the History tab will only appear when the view is set to Archive. The History tab will show the archive transactions alongside the streaming jobs. :::
Create branches from historical transactions
You can use the History tab to create branches on historical transactions of your data that have not been deleted by a retention policy. Choose a previous transaction from the left panel and select the ellipsis (...) icon to Create branch.

Details
The details view provides additional technical information about the dataset, as well as some administrative operations:
- Schema: Provides full information on the table schema (column specifications) and allows you to edit the schema (if applicable).
- Files: Displays the list of files that make up the dataset and allows you to download them.
- Job spec: Displays the job specification containing essential information for the dataset to build.
- Syncs: Surfaces the status and details of data syncs to different databases. For some sync types, additional settings can be applied.
- Custom metadata: Allows you to add custom fields of information to the dataset. The fields added in this section are displayed in the information panel of the overview page.
- Resource usage metrics: Provides graphs and information on disk and Spark usage of the dataset over time.
- Last run details (only for streams): Shows detailed information about the latest stream run.
Stream (only for streaming datasets)
When the dataset is a streaming dataset, the Stream tab will show current and historical information on the streaming jobs. By changing the time period, you can explore the logs and details of jobs that streamed the dataset during that time.

Metrics (only for streaming datasets)
When the dataset is a streaming dataset, the Metrics tab shows charts and related interactions for analyzing and troubleshooting streaming job performance. It includes a dropdown menu for selecting metrics to visualize trends, with recommended debugging metrics highlighted within it. The metric charts can be expanded for detailed viewing and display thresholds and warning indicators with debug links.


Troubleshoot and Debug mode
You can enable a dedicated troubleshooting mode using the toggle at the top right of the page. This mode provides a step-by-step walkthrough to debug stream outages. Select the in-line metrics tags from the right side panel to highlight the corresponding chart and easily locate the source of the issue.

Health
The Health tab provides tools to monitor data health. The page displays health checks on the specific resource, monitoring rules on the resource grouped by specific monitoring view, and related schedule builds that affect the resource. Selecting any row reveals historical reports for the health checks and monitoring rules.
:::callout{theme="neutral" title="Streaming datasets"} In streaming datasets, the Health tab will only appear when the view is set to Archive. The checks will then refer to the archive dataset rather than the stream. :::

Compare
Use the Compare tab to compare two different datasets. Select the tab and choose a dataset to compare with. The Compare tab can be used in several ways:
- Compare two separate datasets to understand their differences.
- Compare a dataset to an older transaction of the same dataset to see how it changed over time.
- Compare the original version of a dataset with a different branch to see how merging that branch will affect the dataset.
:::callout{theme="neutral" title="Streaming datasets"} In streaming datasets, the Compare tab will only appear when the view is set to Archive. You will then be able to compare the archive dataset with other non-streaming datasets. :::
4. Preview table
Use the preview table to understand the structure of the data and to quickly explore the values in the dataset.
:::callout{theme="neutral"} By default, the preview table will show a limited sample of the data; the exact number of rows is displayed in the preview table header. However, any action taken on the data, such as filtering or sorting, will apply to the full dataset and increase the preview sample size. Depending on the number of rows, you may not see the entire dataset in the preview. :::
The preview table provides several useful capabilities:
- Select a column’s menu to sort, filter, and generate charts over the column data.
- Select an individual cell to exclude or include only the selected value from the preview.
- Report and view issues on individual columns.
- Search for specific column names.
:::callout{theme="neutral" title="Streaming datasets"} The data preview table for streaming datasets provides a small sample of recently streamed rows. It will update automatically when set to Live updates. Sorting, filtering, and charting are only available when the page is set to Archive and will represent only the state of the archive dataset. :::

Upload files manually
In Dataset Preview, you can upload files of the following types directly into a dataset: .csv, .tsv, .xls, .xlsm, and .xlsx.
For .csv and .tsv files, Foundry will attempt to infer the schema of the new file. If the filename and schema of the new file are identical to a previous upload, you can update data in the existing dataset. If the filename is different from previous uploads, you can append data to an existing dataset.
The following steps apply to uploading all file types:
- Navigate to your preferred folder and create a dataset.
- Drag and drop the file into the dataset preview window.
5. Actions
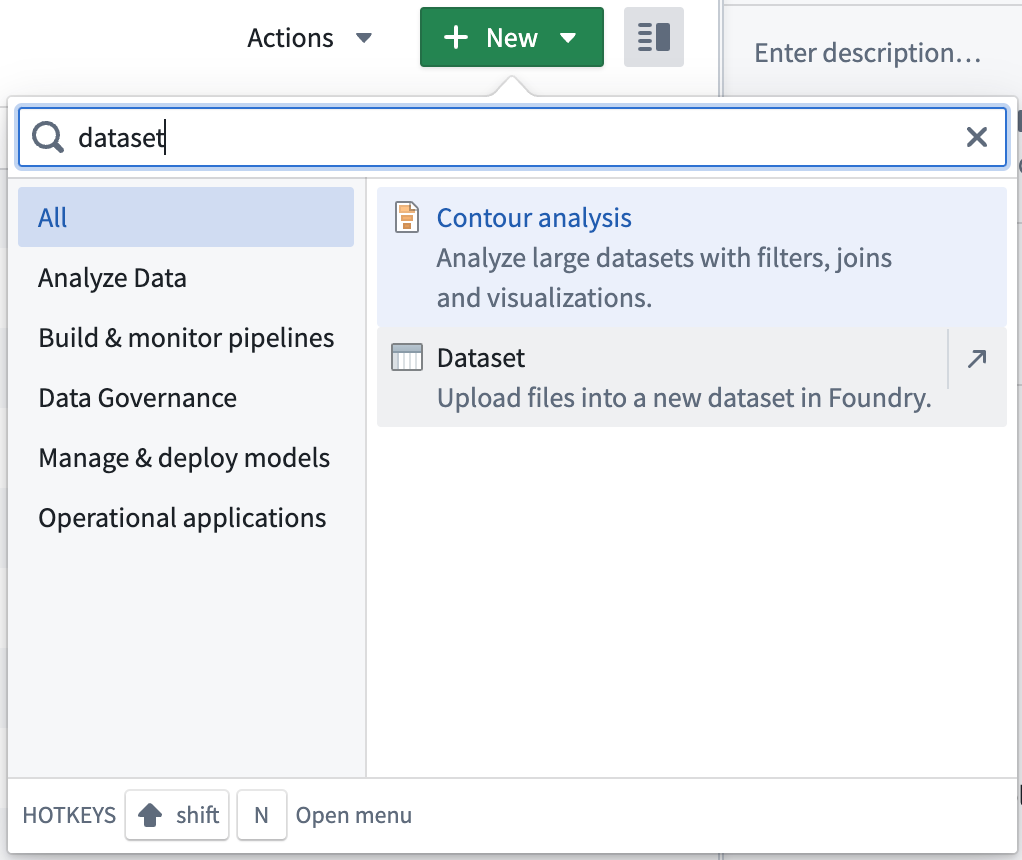
The All actions dropdown menu provides quick access to Foundry tools and operations, allowing you to analyze, explore, transform, and manage the data. Some actions, such as Analyze (in Contour) and Build, are surfaced outside the actions menu for quick access.
中文翻译
数据集预览
数据集预览(Dataset Preview)应用程序为您提供给定数据集的多种详细信息,包括元数据、构建历史、健康状况等。流式数据集(streaming datasets)还提供额外功能,包括查看流式作业信息和指标,以排查和调试流性能问题。
下方截图展示了数据集预览应用程序的界面。编号部分将在后续章节中详细说明。
1. 数据集页眉
页面页眉标识所选数据集,并提供基本信息,如名称、显示名称(如有)、位置和所选分支。页眉还允许执行一些文件相关操作,如共享、移动、重命名等。
2. 信息面板
信息面板提供数据集的元数据和一些基本管理操作。面板分为三个部分:
- 关于(About): 信息包括数据集的创建和更新时间、创建和最后更新数据集的用户、表大小、用于创建数据的工具和输入数据集、标签等。在更新者(Updated by)部分下,还提供编辑模式(Edit schema)视图,可为CSV和JSON文件推断模式。在此处,用户还可以应用其他解析选项,以删除参差不齐的行、更改编码,或添加其他列,如文件路径、行的字节偏移量、导入时间戳或行号。对于其他文件类型,可在详细信息(Details)选项卡下的模式(Schema)部分进行模式编辑。
- 列(Columns): 数据集中不同列的信息,包括数据类型、描述和数据统计(空值百分比、分布和样本)。
- 计划(Schedules): 有关任何已配置的用于更新数据集的构建计划的信息。
3. 选项卡视图
预览(Preview)
预览选项卡以表格形式提供数据样本,并允许与完整数据集进行轻度交互。详细了解预览表,请参见4. 预览表。
历史记录(History)
历史记录选项卡视图提供历史作业(构建)信息。页面右侧的摘要(Summary)视图显示作业状态随时间变化的汇总信息。
左侧面板显示作业列表及其状态和持续时间。选择某个作业后,右侧会显示详细的作业(Job)视图,包括进度、规范、构建日志、文件和生成的模式。
:::callout{theme="neutral" title="流式数据集"} 在流式数据集中,历史记录选项卡仅在视图设置为归档(Archive)时出现。历史记录选项卡将显示归档事务以及流式作业。 :::
从历史事务创建分支
您可以使用历史记录选项卡在未被保留策略删除的数据历史事务上创建分支。从左侧面板选择一个先前的事务,然后选择省略号(...)图标以创建分支(Create branch)。
详细信息(Details)
详细信息视图提供有关数据集的其他技术信息以及一些管理操作:
- 模式(Schema): 提供表模式(列规范)的完整信息,并允许您编辑模式(如适用)。
- 文件(Files): 显示构成数据集的文件列表,并允许您下载这些文件。
- 作业规范(Job spec): 显示包含数据集构建所需基本信息的作业规范。
- 同步(Syncs): 显示数据同步到不同数据库的状态和详细信息。对于某些同步类型,可以应用其他设置。
- 自定义元数据(Custom metadata): 允许您向数据集添加自定义信息字段。在此部分添加的字段将显示在概览页面的信息面板中。
- 资源使用指标(Resource usage metrics): 提供数据集随时间变化的磁盘和Spark使用情况的图表和信息。
- 上次运行详细信息(仅限流): 显示最新流运行的详细信息。
流(仅限流式数据集)
当数据集是流式数据集时,流(Stream)选项卡将显示流式作业的当前和历史信息。通过更改时间段,您可以探索在该时间段内流式传输数据集的作业的日志和详细信息。
指标(仅限流式数据集)
当数据集是流式数据集时,指标(Metrics)选项卡显示用于分析和排查流式作业性能的图表和相关交互。它包含一个下拉菜单,用于选择要可视化趋势的指标,其中突出显示了推荐的调试指标。指标图表可以展开以进行详细查看,并显示阈值和带有调试链接的警告指示器。
故障排查与调试模式
您可以使用页面右上角的切换开关启用专用的故障排查模式。此模式提供逐步操作指南来调试流中断。从右侧面板选择内联指标标签,以突出显示相应的图表并轻松定位问题来源。
健康(Health)
健康选项卡提供用于监控数据健康的工具。页面显示特定资源的健康检查、按特定监控视图分组的资源监控规则,以及影响该资源的相关计划构建。选择任意行可查看健康检查和监控规则的历史报告。
:::callout{theme="neutral" title="流式数据集"} 在流式数据集中,健康选项卡仅在视图设置为归档(Archive)时出现。检查将引用归档数据集而非流。 :::
比较(Compare)
使用比较选项卡比较两个不同的数据集。选择该选项卡并选择一个要比较的数据集。比较选项卡可通过多种方式使用:
- 比较两个独立的数据集以了解其差异。
- 将数据集与同一数据集的较旧事务进行比较,以查看其随时间的变化。
- 将数据集的原始版本与不同分支进行比较,以查看合并该分支将如何影响数据集。
:::callout{theme="neutral" title="流式数据集"} 在流式数据集中,比较选项卡仅在视图设置为归档(Archive)时出现。然后您可以将归档数据集与其他非流式数据集进行比较。 :::
4. 预览表
使用预览表了解数据结构并快速探索数据集中的值。
:::callout{theme="neutral"} 默认情况下,预览表将显示有限的数据样本;预览表标题中会显示确切的行数。但是,对数据执行的任何操作(如筛选或排序)都将应用于完整数据集,并增加预览样本大小。根据行数,您可能无法在预览中看到整个数据集。 :::
预览表提供多种实用功能:
- 选择列菜单以对列数据进行排序、筛选和生成图表。
- 选择单个单元格以从预览中排除或仅包含所选值。
- 报告和查看单个列的问题。
- 搜索特定列名。
:::callout{theme="neutral" title="流式数据集"} 流式数据集的数据预览表提供最近流式传输行的少量样本。当设置为实时更新(Live updates)时,它将自动更新。排序、筛选和图表仅在页面设置为归档(Archive)时可用,并且仅表示归档数据集的状态。 :::
手动上传文件
在数据集预览中,您可以将以下类型的文件直接上传到数据集中:.csv、.tsv、.xls、.xlsm 和 .xlsx。
对于 .csv 和 .tsv 文件,Foundry 将尝试推断新文件的模式。如果新文件的文件名和模式与之前的上传相同,您可以更新数据到现有数据集中。如果文件名与之前的上传不同,您可以追加数据到现有数据集中。
以下步骤适用于上传所有文件类型:
- 导航到您的首选文件夹并创建一个数据集。
- 将文件拖放到数据集预览窗口中。
5. 操作(Actions)
所有操作(All actions)下拉菜单提供对 Foundry 工具和操作的快速访问,允许您分析、探索、转换和管理数据。某些操作(如分析(Analyze)(在 Contour 中)和构建(Build))会显示在操作菜单外部,以便快速访问。