Debug using the replica status(使用副本状态进行调试)
Your first step when debugging your compute module should be to check the Replica Status section on the Overview tab. The Replica Status section shows each replica and its current status and can provide a high-level understanding of your deployment. Select an individual replica to view the images it contains, and view more detailed diagnostics by selecting the Replica Diagnostics callout. If you are unable to debug and think there may be an issue with the compute module infrastructure, contact Palantir Support by filing an issue.
Replica status
The Replica Status section shows which replicas are currently active and part of your deployment along with archived replicas. Archived replicas are no longer running but can still be used to debug issues that occurred in the past. Each replica has its own lifecycle and can be in any of the various states documented below:
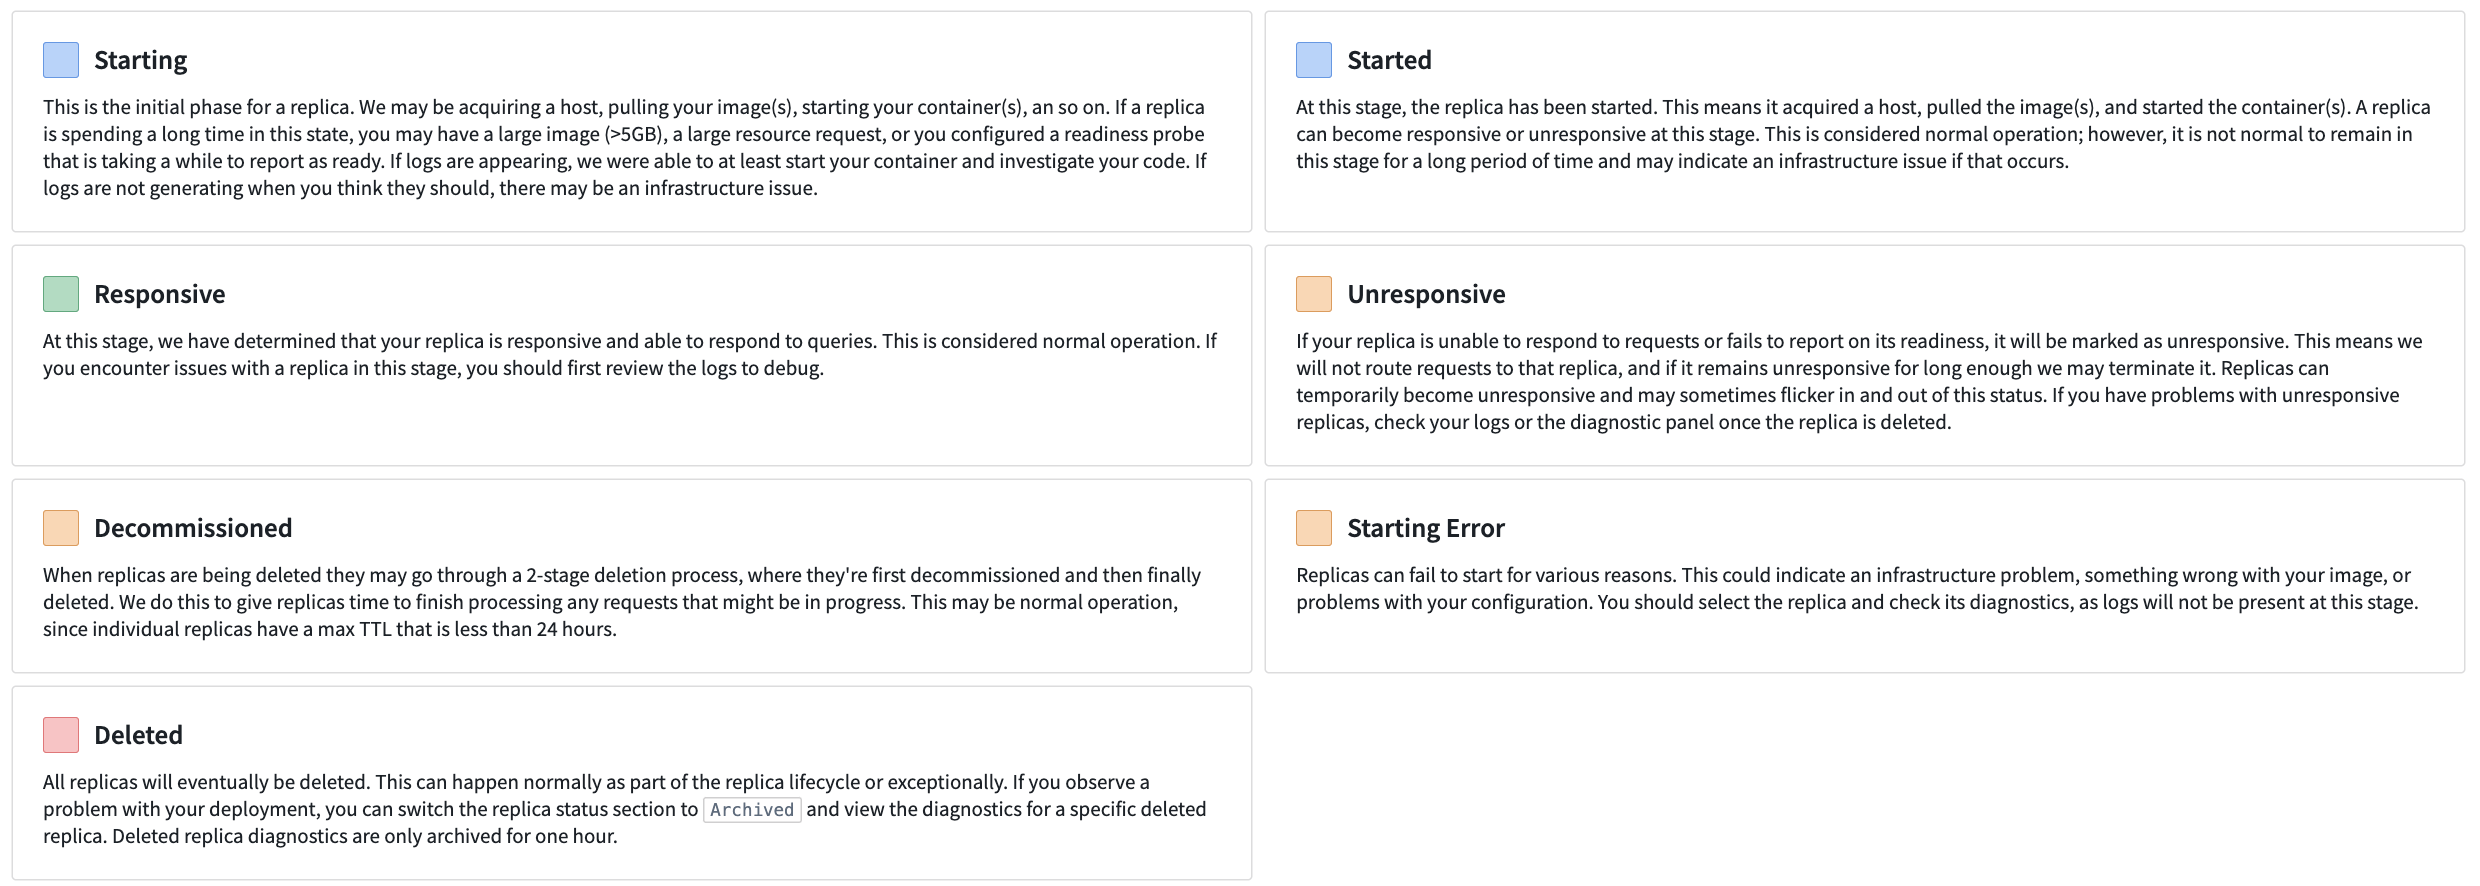
- Starting: The initial phase for a replica. We may be acquiring a host, pulling your image(s), starting your container(s), and so on. If a replica is spending a long time in this state, you may have a large image (>5GB), a large resource request, or you configured a readiness probe that is taking a while to report as ready. If logs are appearing, we were able to at least start your container and investigate your code. If logs are not generating when you think they should, there may be an infrastructure issue.
- Started: At this stage, the replica has been started. This means it acquired a host, pulled the image(s), and started the container(s). A replica can become responsive or unresponsive at this stage. This is considered normal operation; however, it is not normal to remain in this stage for a long period of time and may indicate an infrastructure issue if that occurs.
- Responsive: At this stage, we have determined that your replica is responsive and able to respond to queries. This is considered normal operation. If you encounter issues with a replica in this stage, you should first review the logs to debug.
- Unresponsive: If your replica is unable to respond to requests or fails to report on its readiness, it will be marked as unresponsive. This means we will not route requests to that replica, and if it remains unresponsive for long enough we may terminate it. Replicas can temporarily become unresponsive and may sometimes flicker in and out of this status. If you have problems with unresponsive replicas, check your logs or the diagnostic panel once the replica is deleted.
- Decommissioned: When replicas are being deleted they may go through a 2-stage deletion process, where they are first decommissioned and then finally deleted. We do this to give replicas time to finish processing any requests that might be in progress. This may be normal operation, since individual replicas have a max TTL that is less than 24 hours.
- Starting Error: Replicas can fail to start for various reasons. This could indicate an infrastructure problem, something wrong with your image, or problems with your configuration. You should select the replica and check its diagnostics, as logs will not be present at this stage.
- Deleted: All replicas will eventually be deleted. This can happen normally as part of the replica lifecycle or exceptionally. If you observe a problem with your deployment, you can switch the replica status section to Archived and view the diagnostics for a specific deleted replica. Deleted replica diagnostics are only archived for one hour.
Replica diagnostics
Replica diagnostics can provide deeper insight into a degraded deployment. We provide a status and reason from our underlying infrastructure and/or from the compute module service directly. In the replica diagnostics panel, you can also select an individual image for further debugging.
:::callout{theme="warning"} To view the diagnostics for a particular replica, you must first select the replica square. Some replicas may be archived, and you may need to toggle into the archive view. :::
Below is an example of the diagnostics panel for a deployment that is failing to come up live:
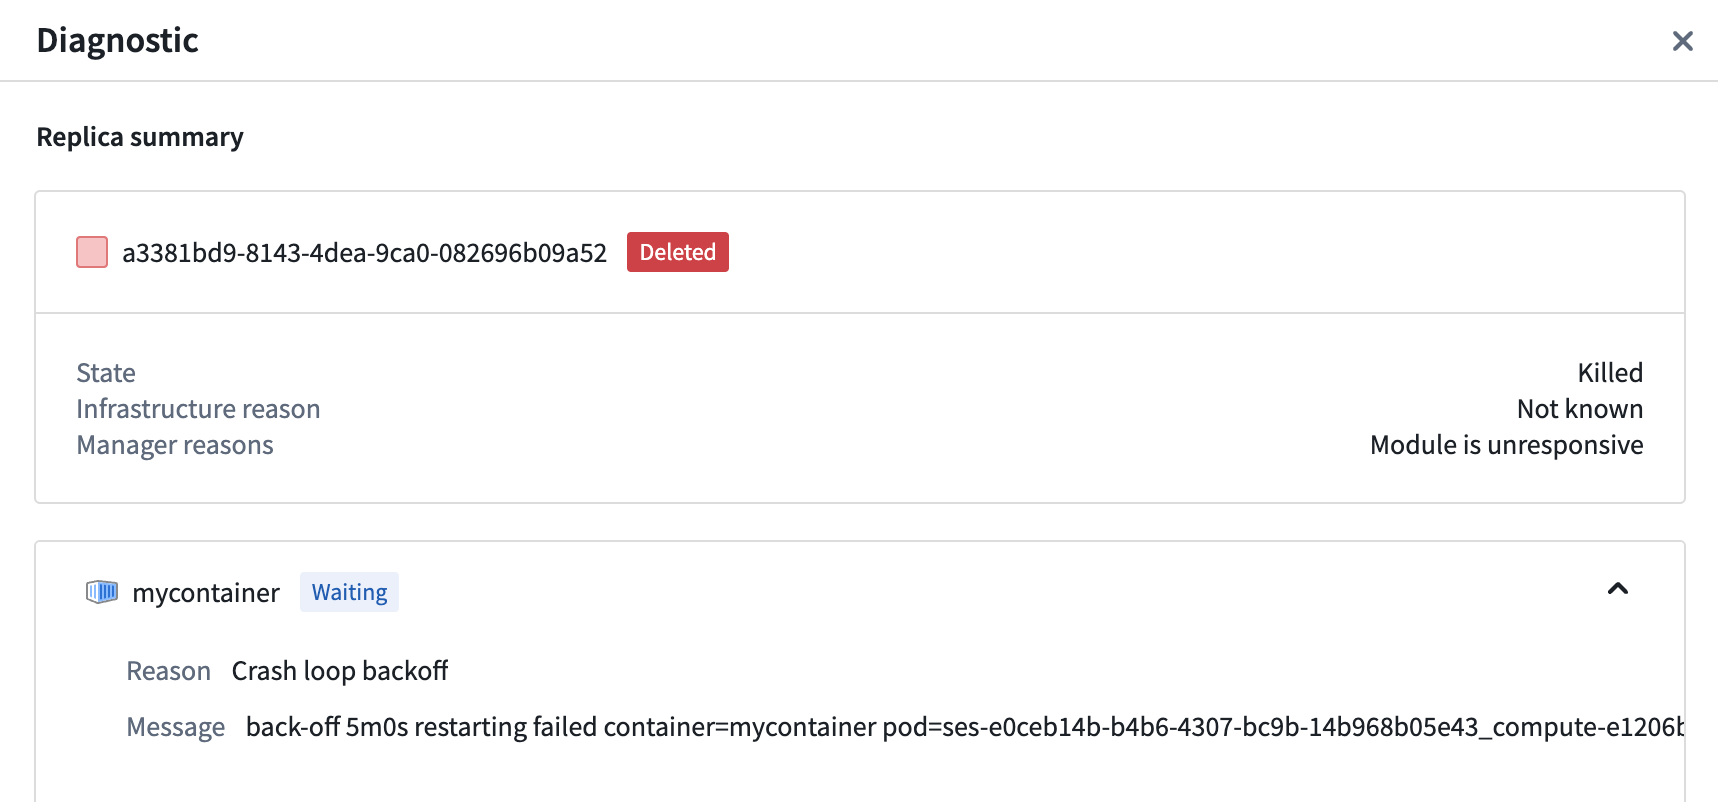

In the above image, the container is experiencing a CrashLoopBackoff. We can turn to logs and the code provided to try and debug further.
Debug upgrades
Compute modules will attempt a safe upgrade when possible. This means that when you upgrade your configuration while you have an active deployment, a new deployment will be launched alongside your active one and will switch over when your new deployment becomes responsive. New jobs will be routed to the updated deployment while existing jobs complete on the old deployment.
Upgrade process
Upgrades for compute modules progress through a series of steps documented below:
- The configuration for a running compute module changes. For example, you might have changed the version of a configured image. Some configuration settings may require downtime to apply, and you will be asked to acknowledge those before saving.
- The compute module service creates a second deployment with your changes.
- The compute module service waits for a responsive replica in your new deployment.
- Your new deployment has a responsive replica and new requests are routing to the new deployment. The old deployment is being decommissioned and given a grace period to finish existing requests before it is fully deleted.
If your new deployment never becomes responsive, your current deployment will not change. If an upgrade is unsuccessful, you will not experience downtime. To end an unresponsive upgrade, you can revert your configuration changes or make forward changes where replicas can become responsive.
My upgrade is unresponsive
Like the active Replica Status section, the status of the upgraded deployment's replicas will display in a section in the Overview tab.
Expand the section to view the images in the upgraded deployment, and select the replica square to view more replica diagnostics.

中文翻译
使用副本状态进行调试
调试计算模块时,第一步应检查概览选项卡中的副本状态部分。副本状态部分会显示每个副本及其当前状态,可帮助您从宏观层面了解部署情况。选择单个副本可查看其包含的镜像,点击副本诊断标注可查看更多详细诊断信息。若无法调试且怀疑计算模块基础设施存在问题,请提交问题联系Palantir支持团队。
副本状态
副本状态部分会显示当前活跃且属于部署的副本,以及已归档的副本。已归档副本虽不再运行,但仍可用于排查过去发生的问题。每个副本都有独立的生命周期,可能处于以下任一状态:
- 启动中: 副本的初始阶段。可能正在获取主机、拉取镜像、启动容器等。若副本长时间停留在此状态,可能是镜像过大(>5GB)、资源请求过大,或就绪探针配置耗时较长。若日志已生成,说明容器已成功启动并可进行代码排查。若日志未按预期生成,可能存在基础设施问题。
- 已启动: 副本已成功启动,即已获取主机、拉取镜像并启动容器。此阶段副本可能响应正常或异常。这属于正常操作;但长时间停留在此状态则不正常,可能表明存在基础设施问题。
- 响应正常: 已确认副本能正常响应查询。这属于正常操作。若此阶段副本出现问题,应首先查看日志进行调试。
- 无响应: 若副本无法响应请求或未报告就绪状态,将被标记为无响应。此时不会将请求路由至该副本,若长时间无响应,系统可能将其终止。副本可能暂时无响应,并在此状态间短暂切换。若遇到无响应问题,请检查日志或副本删除后的诊断面板。
- 退役中: 副本删除时会经历两阶段流程:先退役,再最终删除。此举旨在为副本留出时间处理进行中的请求。这属于正常操作,因为单个副本的最大存活时间(TTL)不超过24小时。
- 启动错误: 副本可能因多种原因启动失败。这可能表明基础设施问题、镜像异常或配置错误。请选择该副本并检查诊断信息,因为此阶段不会生成日志。
- 已删除: 所有副本最终都会被删除。这可能是副本生命周期的正常流程,也可能属于异常情况。若发现部署问题,可将副本状态切换至已归档,查看特定已删除副本的诊断信息。已删除副本的诊断信息仅保留一小时。
副本诊断
副本诊断可深入分析部署降级的原因。系统会提供来自底层基础设施和/或计算模块服务的状态及原因说明。在副本诊断面板中,您还可以选择单个镜像进行进一步调试。
:::callout{theme="warning"} 要查看特定副本的诊断信息,必须先点击该副本方块。部分副本可能已归档,需切换至归档视图查看。 :::
以下是部署无法正常启动时的诊断面板示例:
上图中,容器出现了CrashLoopBackoff错误。此时可查看日志和代码进行进一步调试。
调试升级
计算模块会尽可能执行安全升级。这意味着当您在活跃部署期间升级配置时,系统会启动一个新部署与当前部署并行运行,待新部署响应正常后自动切换。新任务将路由至更新后的部署,而现有任务继续在旧部署上完成。
升级流程
计算模块的升级按以下步骤进行:
- 运行中计算模块的配置发生变更。例如,您可能更改了某个配置镜像的版本。部分配置设置需要停机才能应用,保存前系统会要求您确认。
- 计算模块服务根据您的更改创建第二个部署。
- 计算模块服务等待新部署中出现响应正常的副本。
- 新部署出现响应正常的副本后,新请求将路由至新部署。旧部署进入退役阶段,并获得宽限期完成现有请求,之后被完全删除。
若新部署始终无法响应,当前部署将保持不变。升级失败不会导致停机。要结束无响应的升级,可回滚配置更改,或进行正向更改使副本恢复响应。
我的升级无响应
与活跃的副本状态部分类似,升级后部署的副本状态会显示在概览选项卡的对应区域中。
展开该区域可查看升级部署中的镜像,点击副本方块可查看更多副本诊断信息。