Debugging with MCP Inspector(使用 MCP Inspector 进行调试)
MCP Inspector ↗ is an open-source developer tool for testing and debugging MCP servers. It provides an interactive interface where you can connect to any MCP server, browse available tools, execute them with custom inputs, and inspect the responses. This makes it useful for verifying that your Ontology MCP (OMCP) server is configured correctly before connecting it to an AI agent.
Prerequisites
Before using MCP Inspector with your Ontology MCP server, ensure that you have enabled Ontology MCP for your application in Developer Console. Refer to Getting started for setup instructions.
Run MCP Inspector
To launch MCP Inspector with your Ontology MCP server, navigate to the MCP page of your application in Developer Console and follow the instructions provided for running MCP Inspector. This page displays the connection configuration specific to your application.
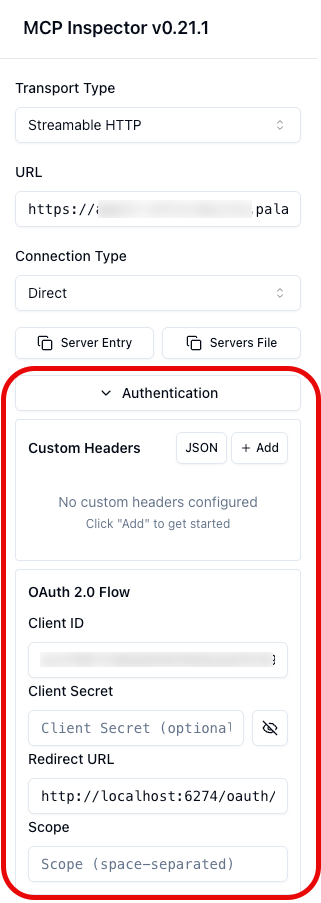
Once the MCP inspector application launches, make sure to expand the Authentication section and add the client ID before selecting Connect. Note that you may also need to add a client secret if you are using a confidential client.
:::callout{theme="neutral"} It may take a few seconds before tools are available during connection. :::
Debug tools with MCP Inspector
Once MCP Inspector is connected to your Ontology MCP server, you can use it to list, execute, and inspect the tools exposed by your application.
List available tools
Select the Tools tab in MCP Inspector to view all tools exposed by your Ontology MCP server. Each tool displays its name and description. This list should match the ontology resources you configured in your application's restrictions, including search tools, action tools, and query tools.
If a tool is missing from the list, verify that the corresponding ontology resource is included in your application restrictions.
View tool history
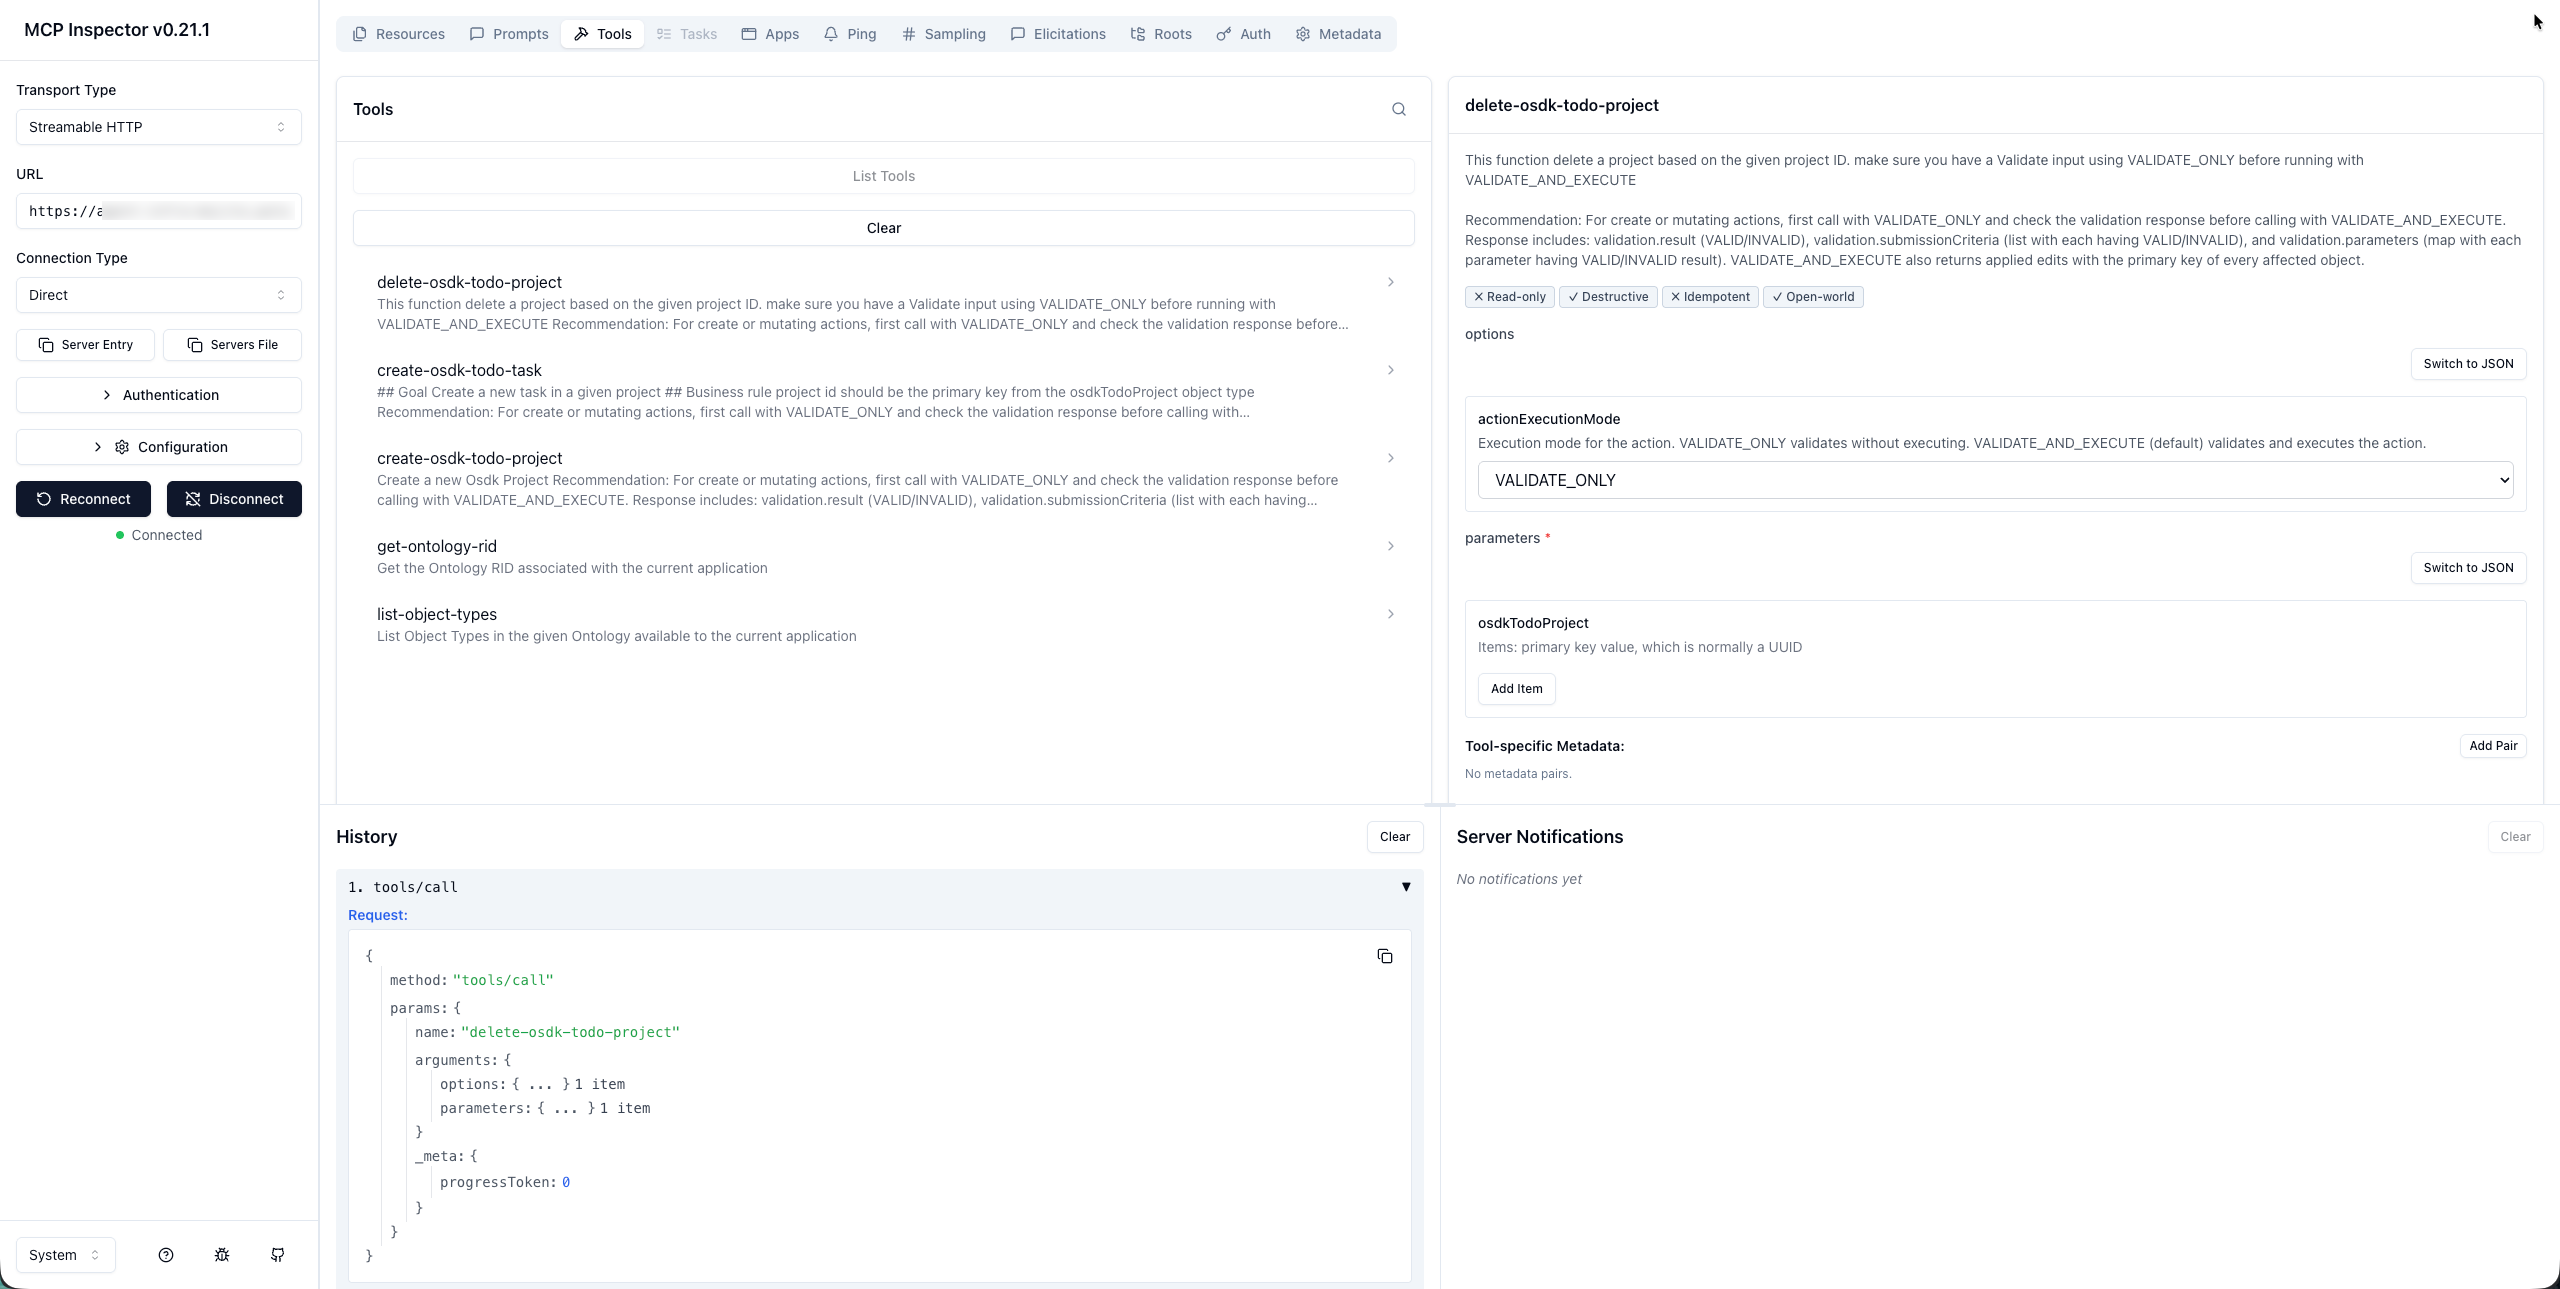
Use the History section in the Tools tab to view a log of all requests made to your MCP server, including tool executions and their responses. This can help you track the sequence of interactions and identify any errors or unexpected behavior in your tools.
Run a tool
Follow the steps below to execute a tool:
- Select a tool from the list to view its input schema.
- Fill in the required parameters in the input form. MCP Inspector displays the expected parameter types and descriptions for each tool.
- Select Run Tool to execute the tool against your Ontology MCP server.
View tool execution results
After running a tool, MCP Inspector displays the response in the Results panel.
You can inspect the following:
- Success responses: The returned data, such as object properties from a search tool or the result of an action execution.
- Error responses: Error messages and codes that indicate issues with the request, such as missing required parameters or permission errors.
Use the response details to verify that your tools return the expected data, and to diagnose issues with tool configurations or permissions.
Limitations
Currently, Ontology MCP does not support prompts or resources, so the Prompts and Resources tabs in MCP inspector will display an empty list.
中文翻译
使用 MCP Inspector 进行调试
MCP Inspector ↗ 是一款用于测试和调试 MCP 服务器的开源开发者工具。它提供交互式界面,您可以连接到任意 MCP 服务器、浏览可用工具、使用自定义输入执行工具并检查响应结果。这使得在将 Ontology MCP(OMCP)服务器连接到 AI 代理之前,验证其配置是否正确变得非常实用。
前提条件
在使用 MCP Inspector 连接 Ontology MCP 服务器之前,请确保已在 Developer Console 中为您的应用程序启用 Ontology MCP。有关设置说明,请参阅入门指南。
运行 MCP Inspector
要启动 MCP Inspector 并连接您的 Ontology MCP 服务器,请在 Developer Console 中导航至应用程序的 MCP 页面,并按照提供的说明运行 MCP Inspector。该页面会显示您应用程序专属的连接配置。
MCP Inspector 应用程序启动后,请务必展开 身份验证(Authentication) 部分并添加客户端 ID(Client ID),然后再选择 连接(Connect)。请注意,如果您使用的是机密客户端(confidential client),可能还需要添加客户端密钥(Client secret)。
:::callout{theme="neutral"} 连接过程中,工具可能需要几秒钟才能显示出来。 :::
使用 MCP Inspector 调试工具
MCP Inspector 连接到您的 Ontology MCP 服务器后,您可以使用它来列出、执行和检查应用程序暴露的工具。
列出可用工具
在 MCP Inspector 中选择 工具(Tools) 选项卡,查看 Ontology MCP 服务器暴露的所有工具。每个工具都会显示其名称和描述。此列表应与您在应用程序限制中配置的本体资源(ontology resources)一致,包括搜索工具、操作工具和查询工具。
如果某个工具未出现在列表中,请验证相应的本体资源是否已包含在您的应用程序限制中。
查看工具历史记录
使用 工具(Tools) 选项卡中的 历史记录(History) 部分,查看发送到 MCP 服务器的所有请求日志,包括工具执行及其响应。这有助于您追踪交互顺序,并识别工具中的任何错误或意外行为。
运行工具
按照以下步骤执行工具:
- 从列表中选择一个工具,查看其输入模式(input schema)。
- 在输入表单中填写所需参数。MCP Inspector 会显示每个工具的预期参数类型和描述。
- 选择 运行工具(Run Tool),在 Ontology MCP 服务器上执行该工具。
查看工具执行结果
运行工具后,MCP Inspector 会在 结果(Results) 面板中显示响应。
您可以检查以下内容:
- 成功响应: 返回的数据,例如搜索工具的对象属性或操作执行的结果。
- 错误响应: 指示请求问题的错误消息和代码,例如缺少必需参数或权限错误。
使用响应详情来验证工具是否返回预期数据,并诊断工具配置或权限相关的问题。
限制
目前,Ontology MCP 不支持提示(prompts)或资源(resources),因此 MCP Inspector 中的 提示(Prompts) 和 资源(Resources) 选项卡将显示为空列表。