View results(查看结果)
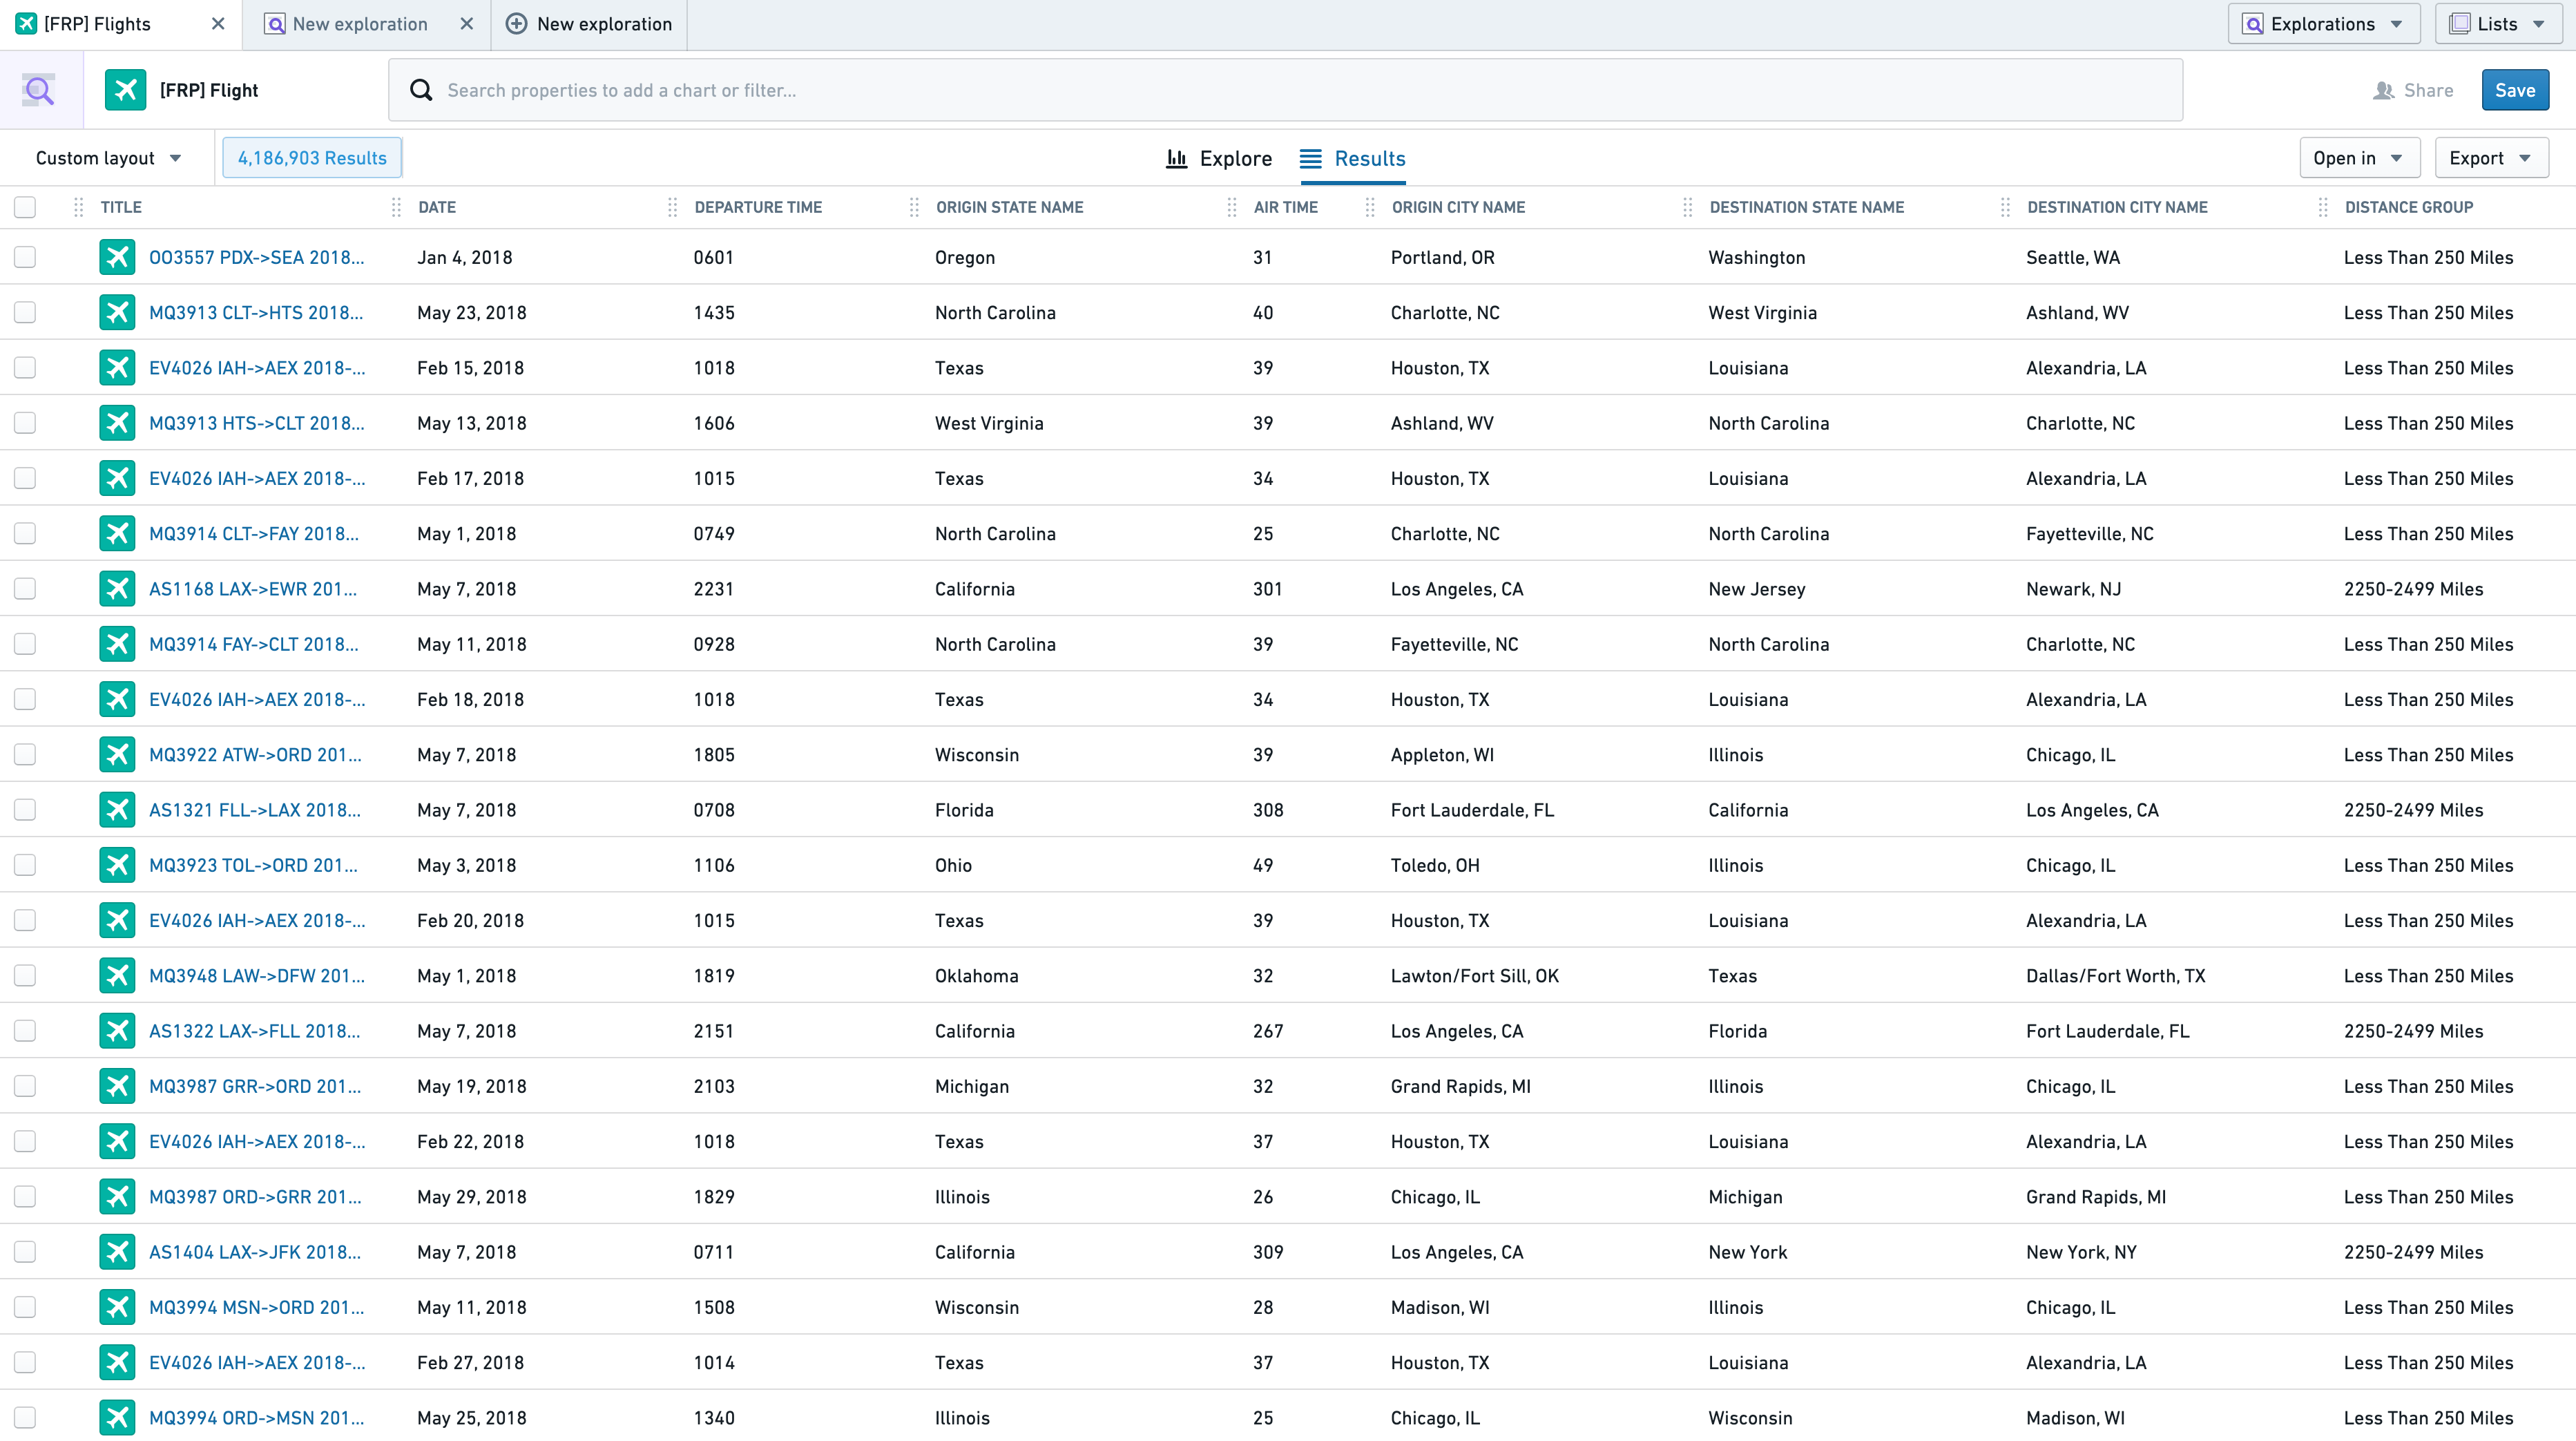
The Results View displays objects from your exploration in a tabular view. To load more objects into the table, scroll down.
Sorting Table by Column
The results table can be sorted by properties with the Sortable renderHint applied. To sort by a specific column, click the dropdown arrow in the column header.

Once a column is used for sorting, it will display a sorting icon in its header. If multiple columns are chosen for sorting, the last one selected takes precedence. Previous sorts have a number next to their sorting icon to show the sort order, as below.

Select “Clear All Sorts” from the dropdown to reset your sorts to their original state.
Configuring Columns
Changing Column Order
Columns can be re-ordered by dragging the handle icon on column headers.

Users can select the “Freeze X columns” option from a column header dropdown to keep the X leftmost columns visible while scrolling to the right in the results table. The checkbox column is included in the count.
Resizing Columns
To resize a column, drag the right side of the column header to the desired width. This boundary, highlighted blue, is just to the right of the configuration dropdown.

Adding and Removing columns
To hide an individual column, select the “Hide this column” option from the column header dropdown.
To reorder and configure multiple columns at once, select “Configure columns” to open the following menu.

The left-hand panel shows default columns for the table, while the right-hand panel displays the current order and visibility for all possible columns. Hide or add all columns using the shortcut buttons, or search for a specific column with the search bar at the top to toggle visibility.
Change column order by dragging the columns to the desired locations, or move the columns to top or bottom using the menu below.

Selecting “don’t truncate text in this table” will cause text properties to wrap to the next line if they cannot be displayed in the existing column width.
Save your configuration with the button in the bottom right. Administrators can update the default configuration for this table by saving the current view as a new layout and setting it as the default for all users. Learn more about updating the default configuration.
Previewing Results
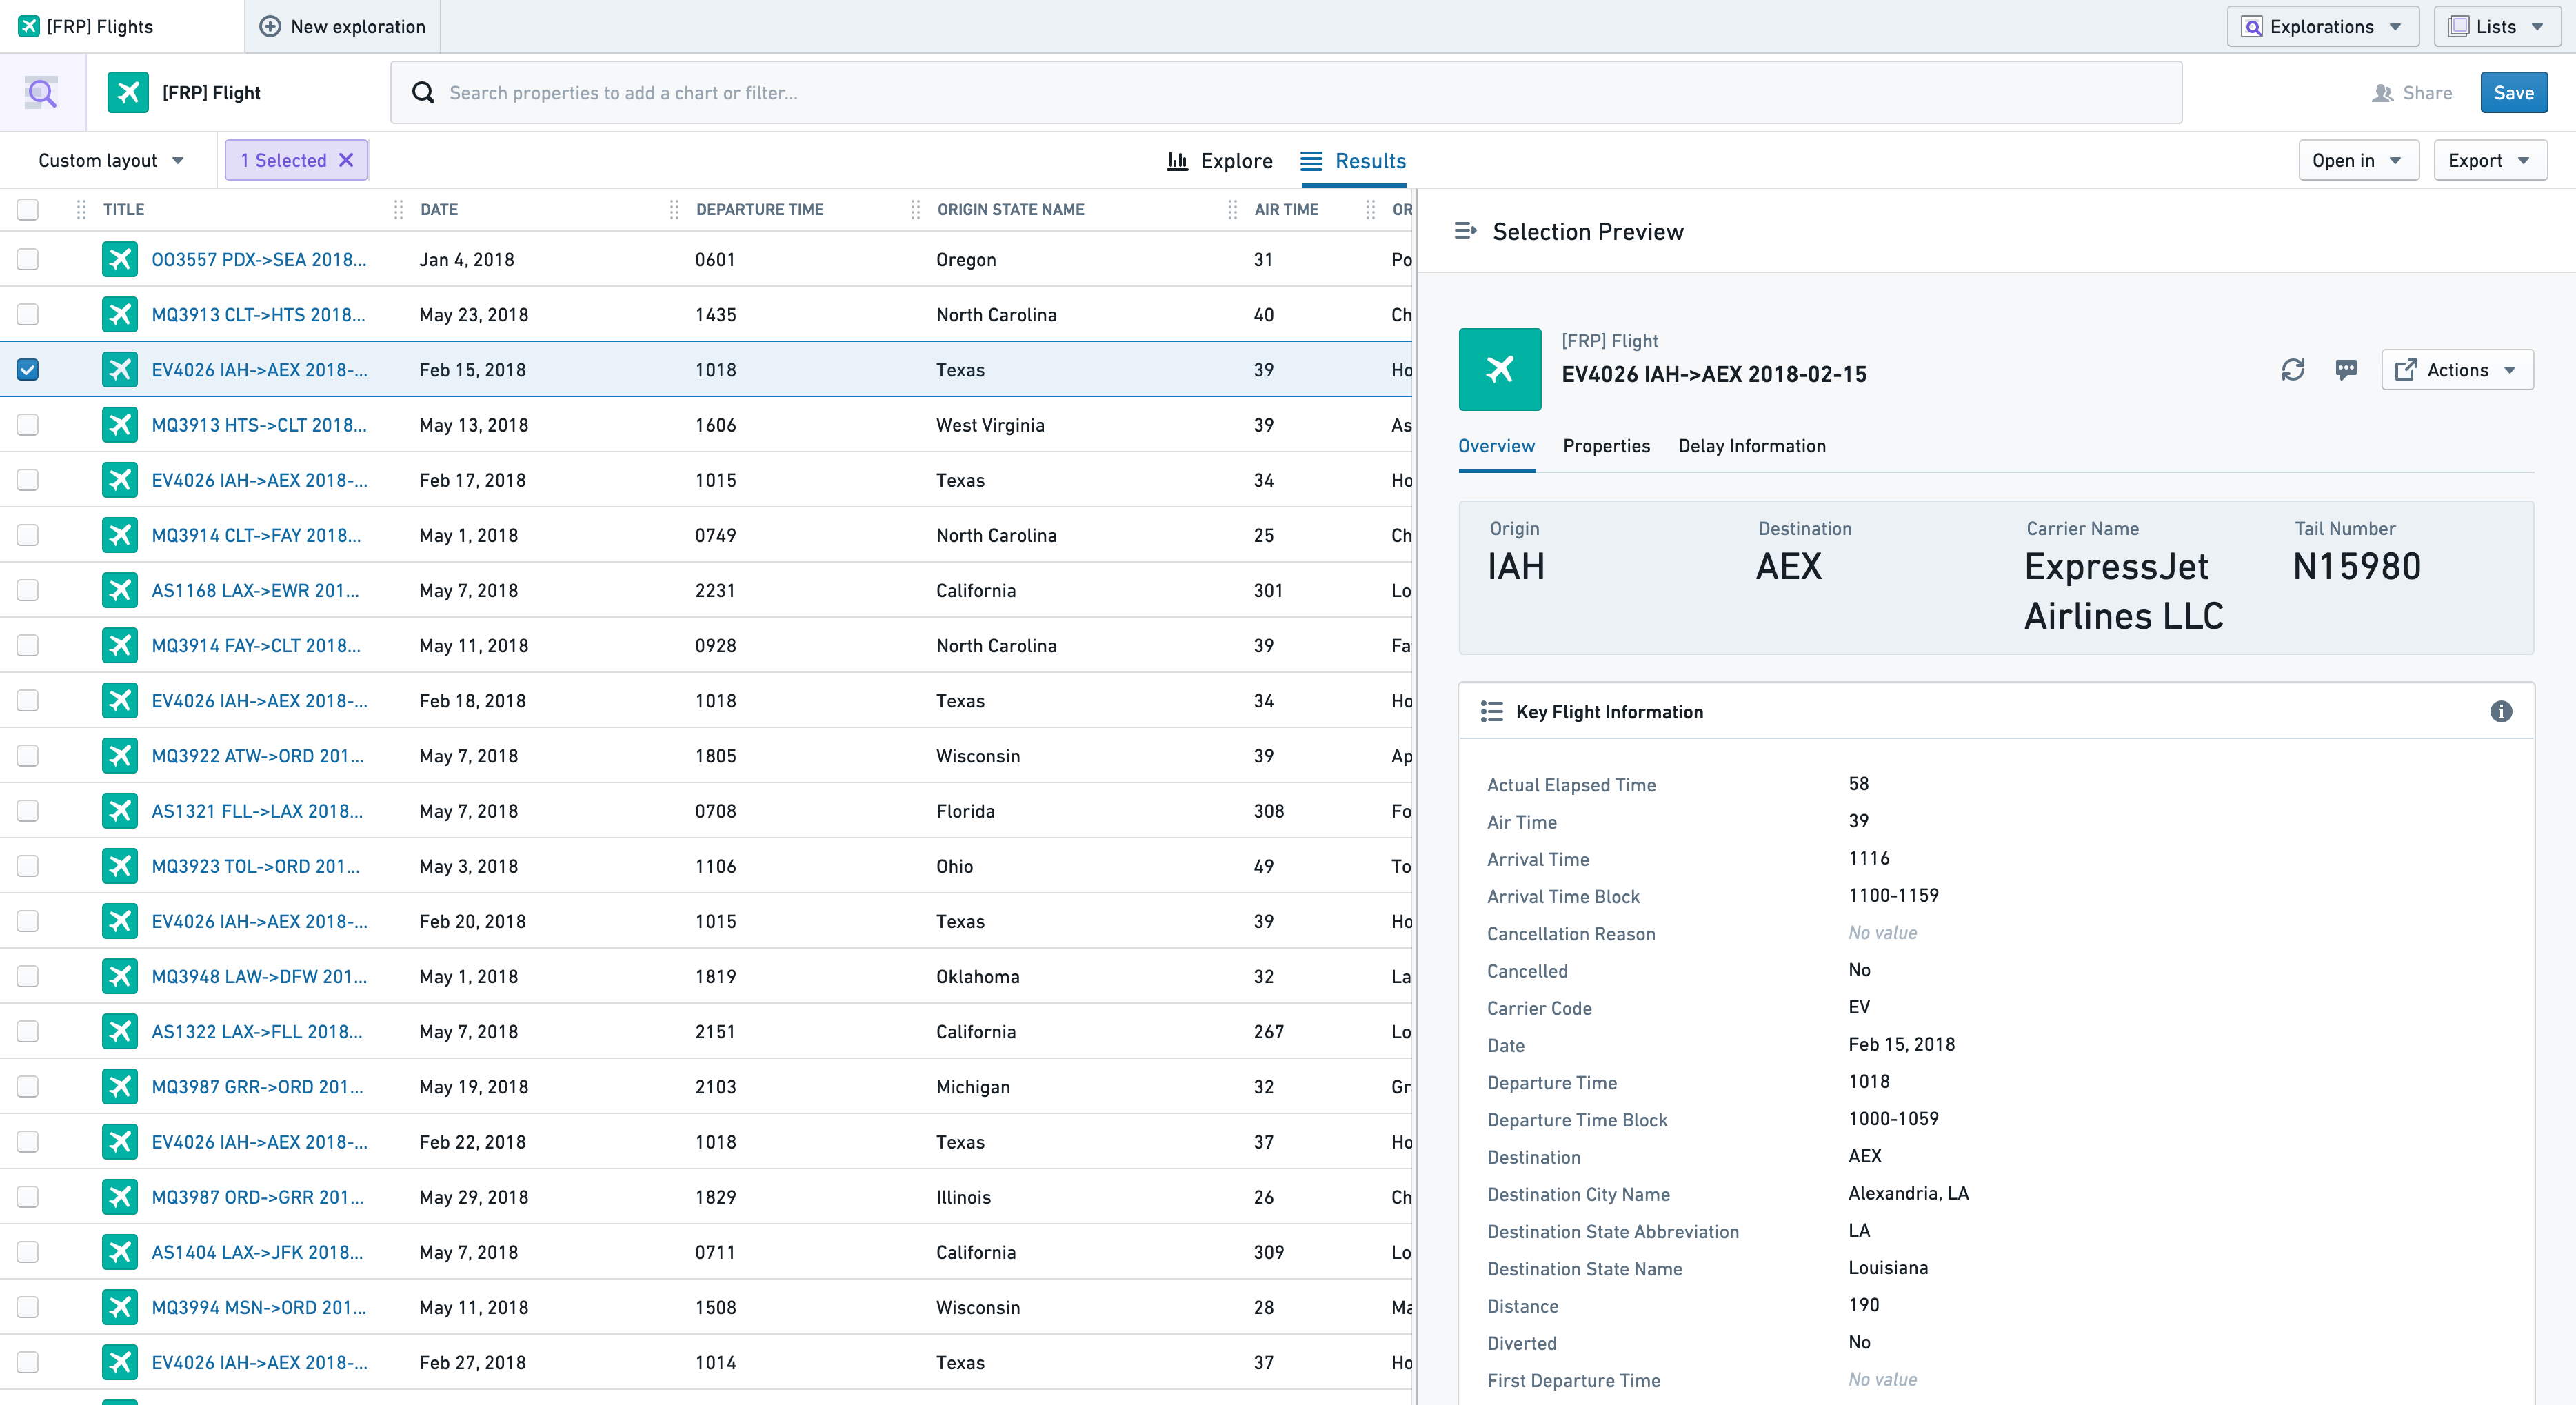
To open the object view for an object in a new Object Explorer tab, click the Title column for that object’s row. To open a preview of the object view in your Results tab, select one or more objects by clicking the checkbox or any other column in the corresponding row.
After selecting an object, the Selection Preview panel will open from the right. To close this panel for a full table view, use the "collapse" icon (![]() ) on the top left of the panel.
) on the top left of the panel.
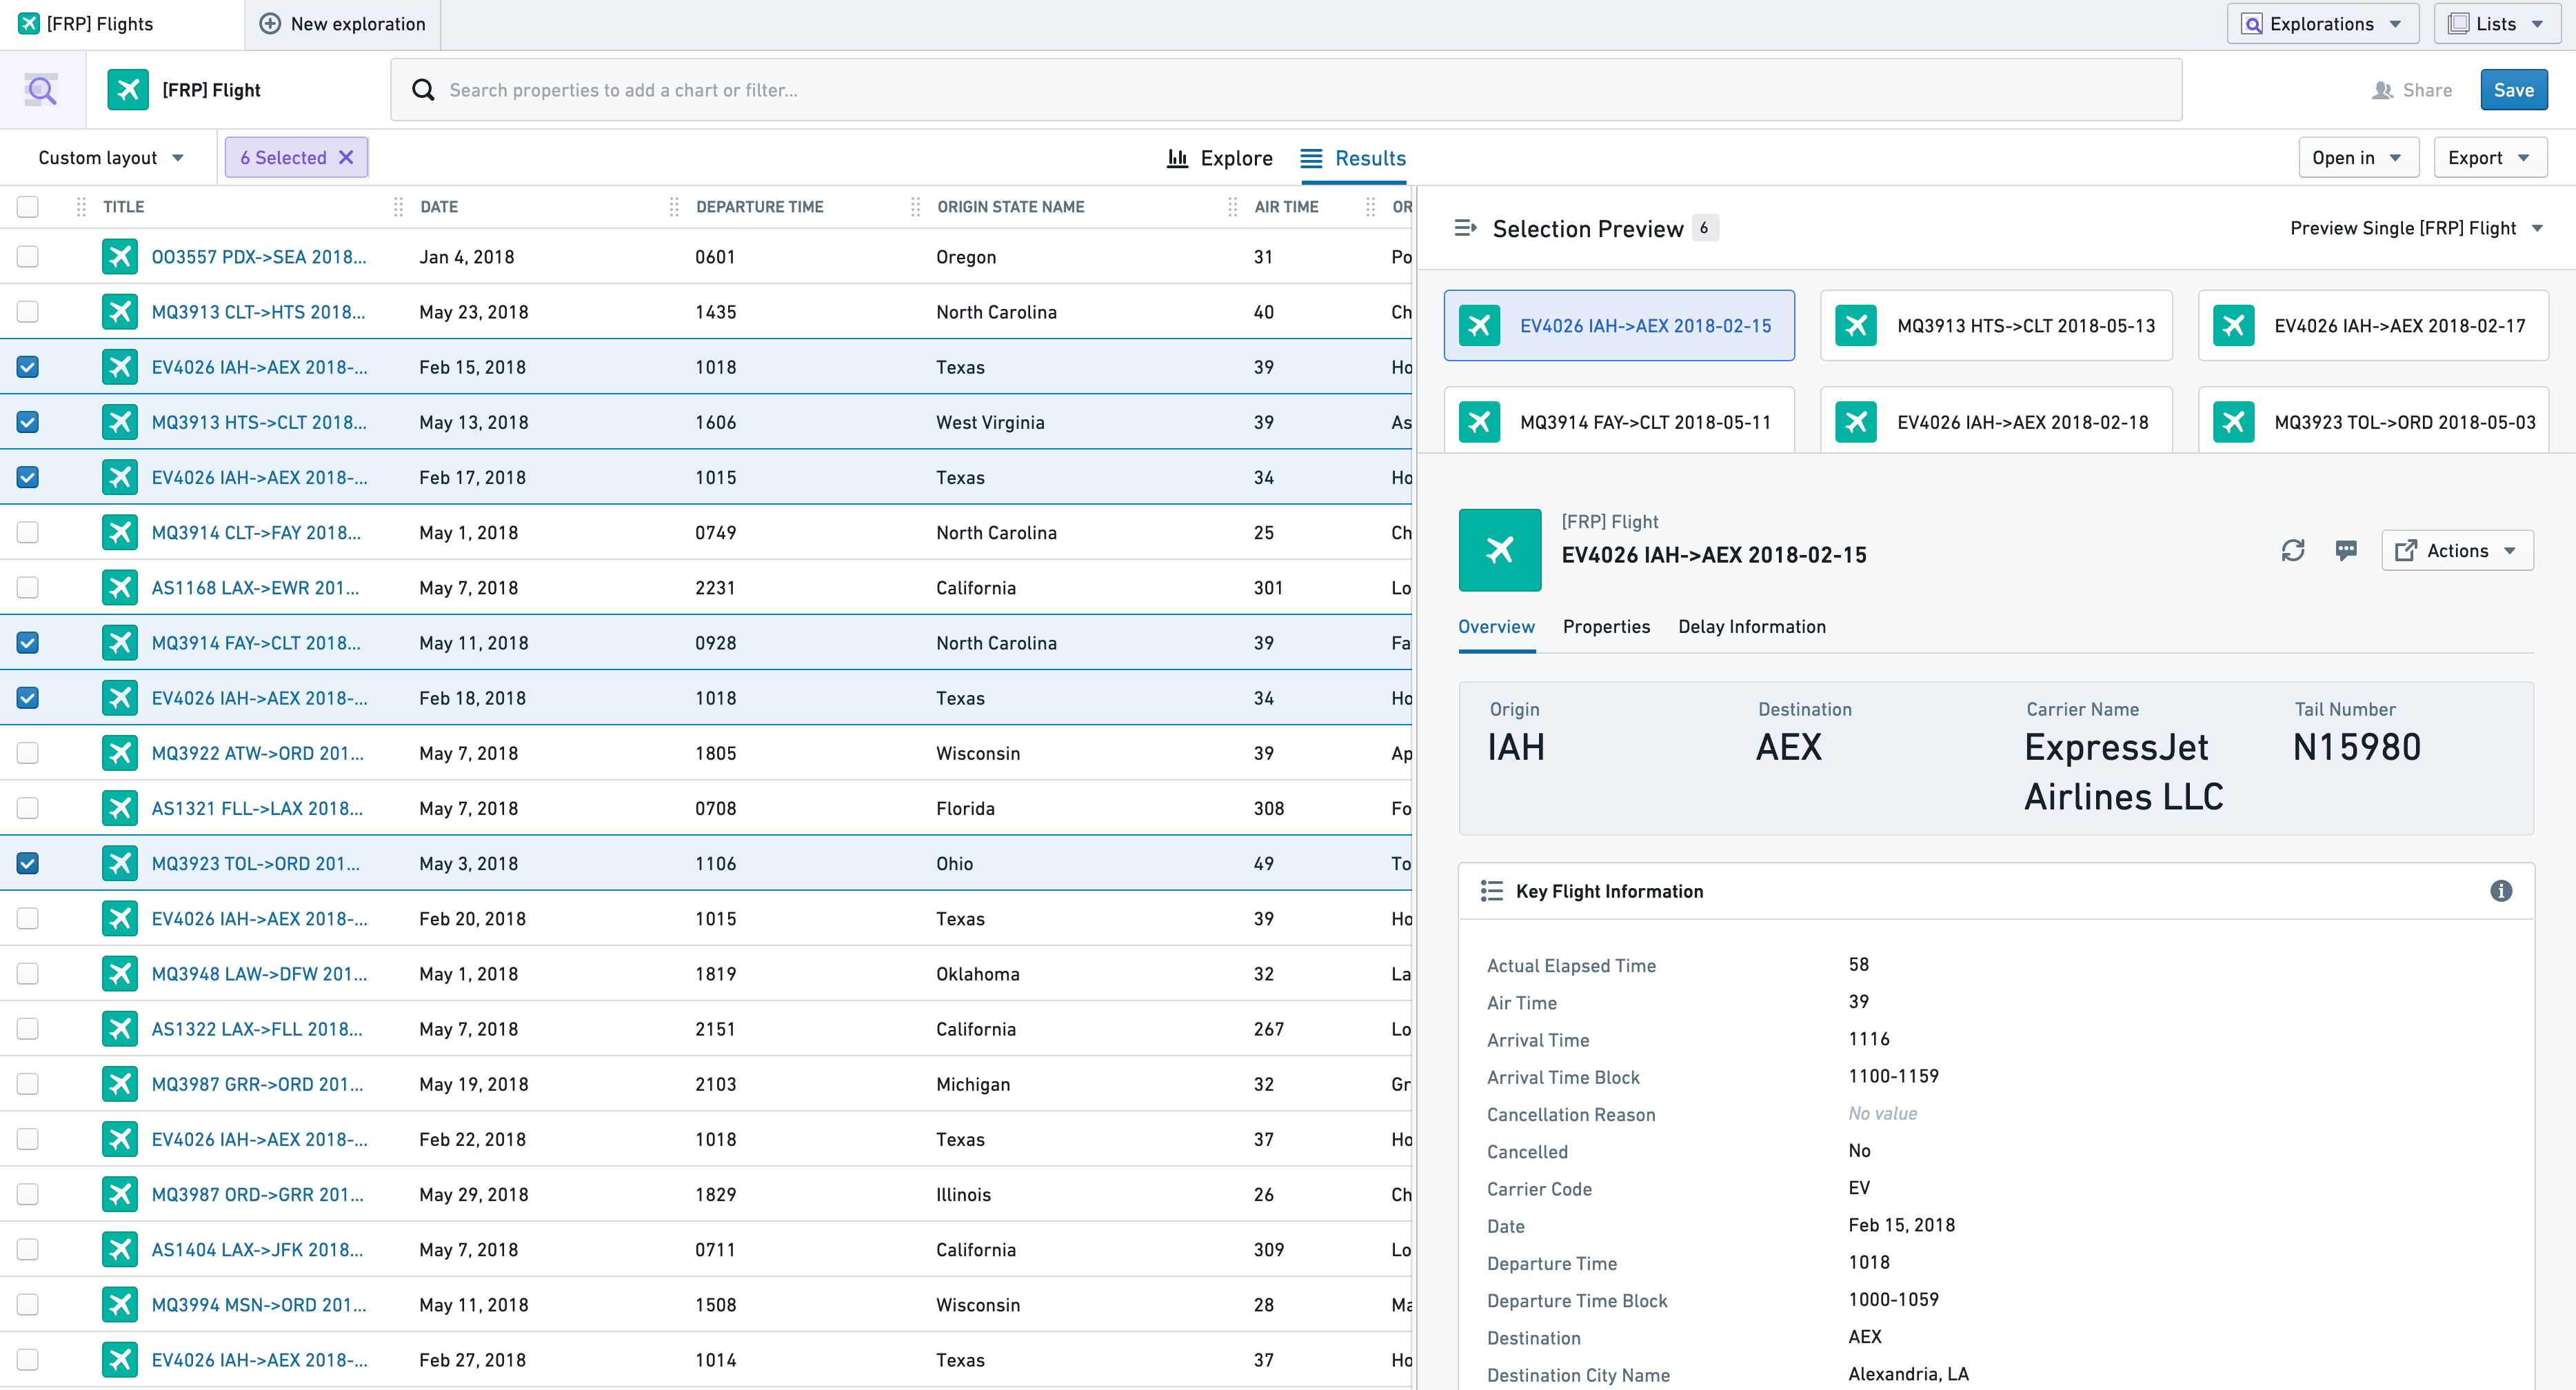
If multiple objects are selected, the object view for any of the first twenty is available for previewing, displayed in a list of cards above the object view.
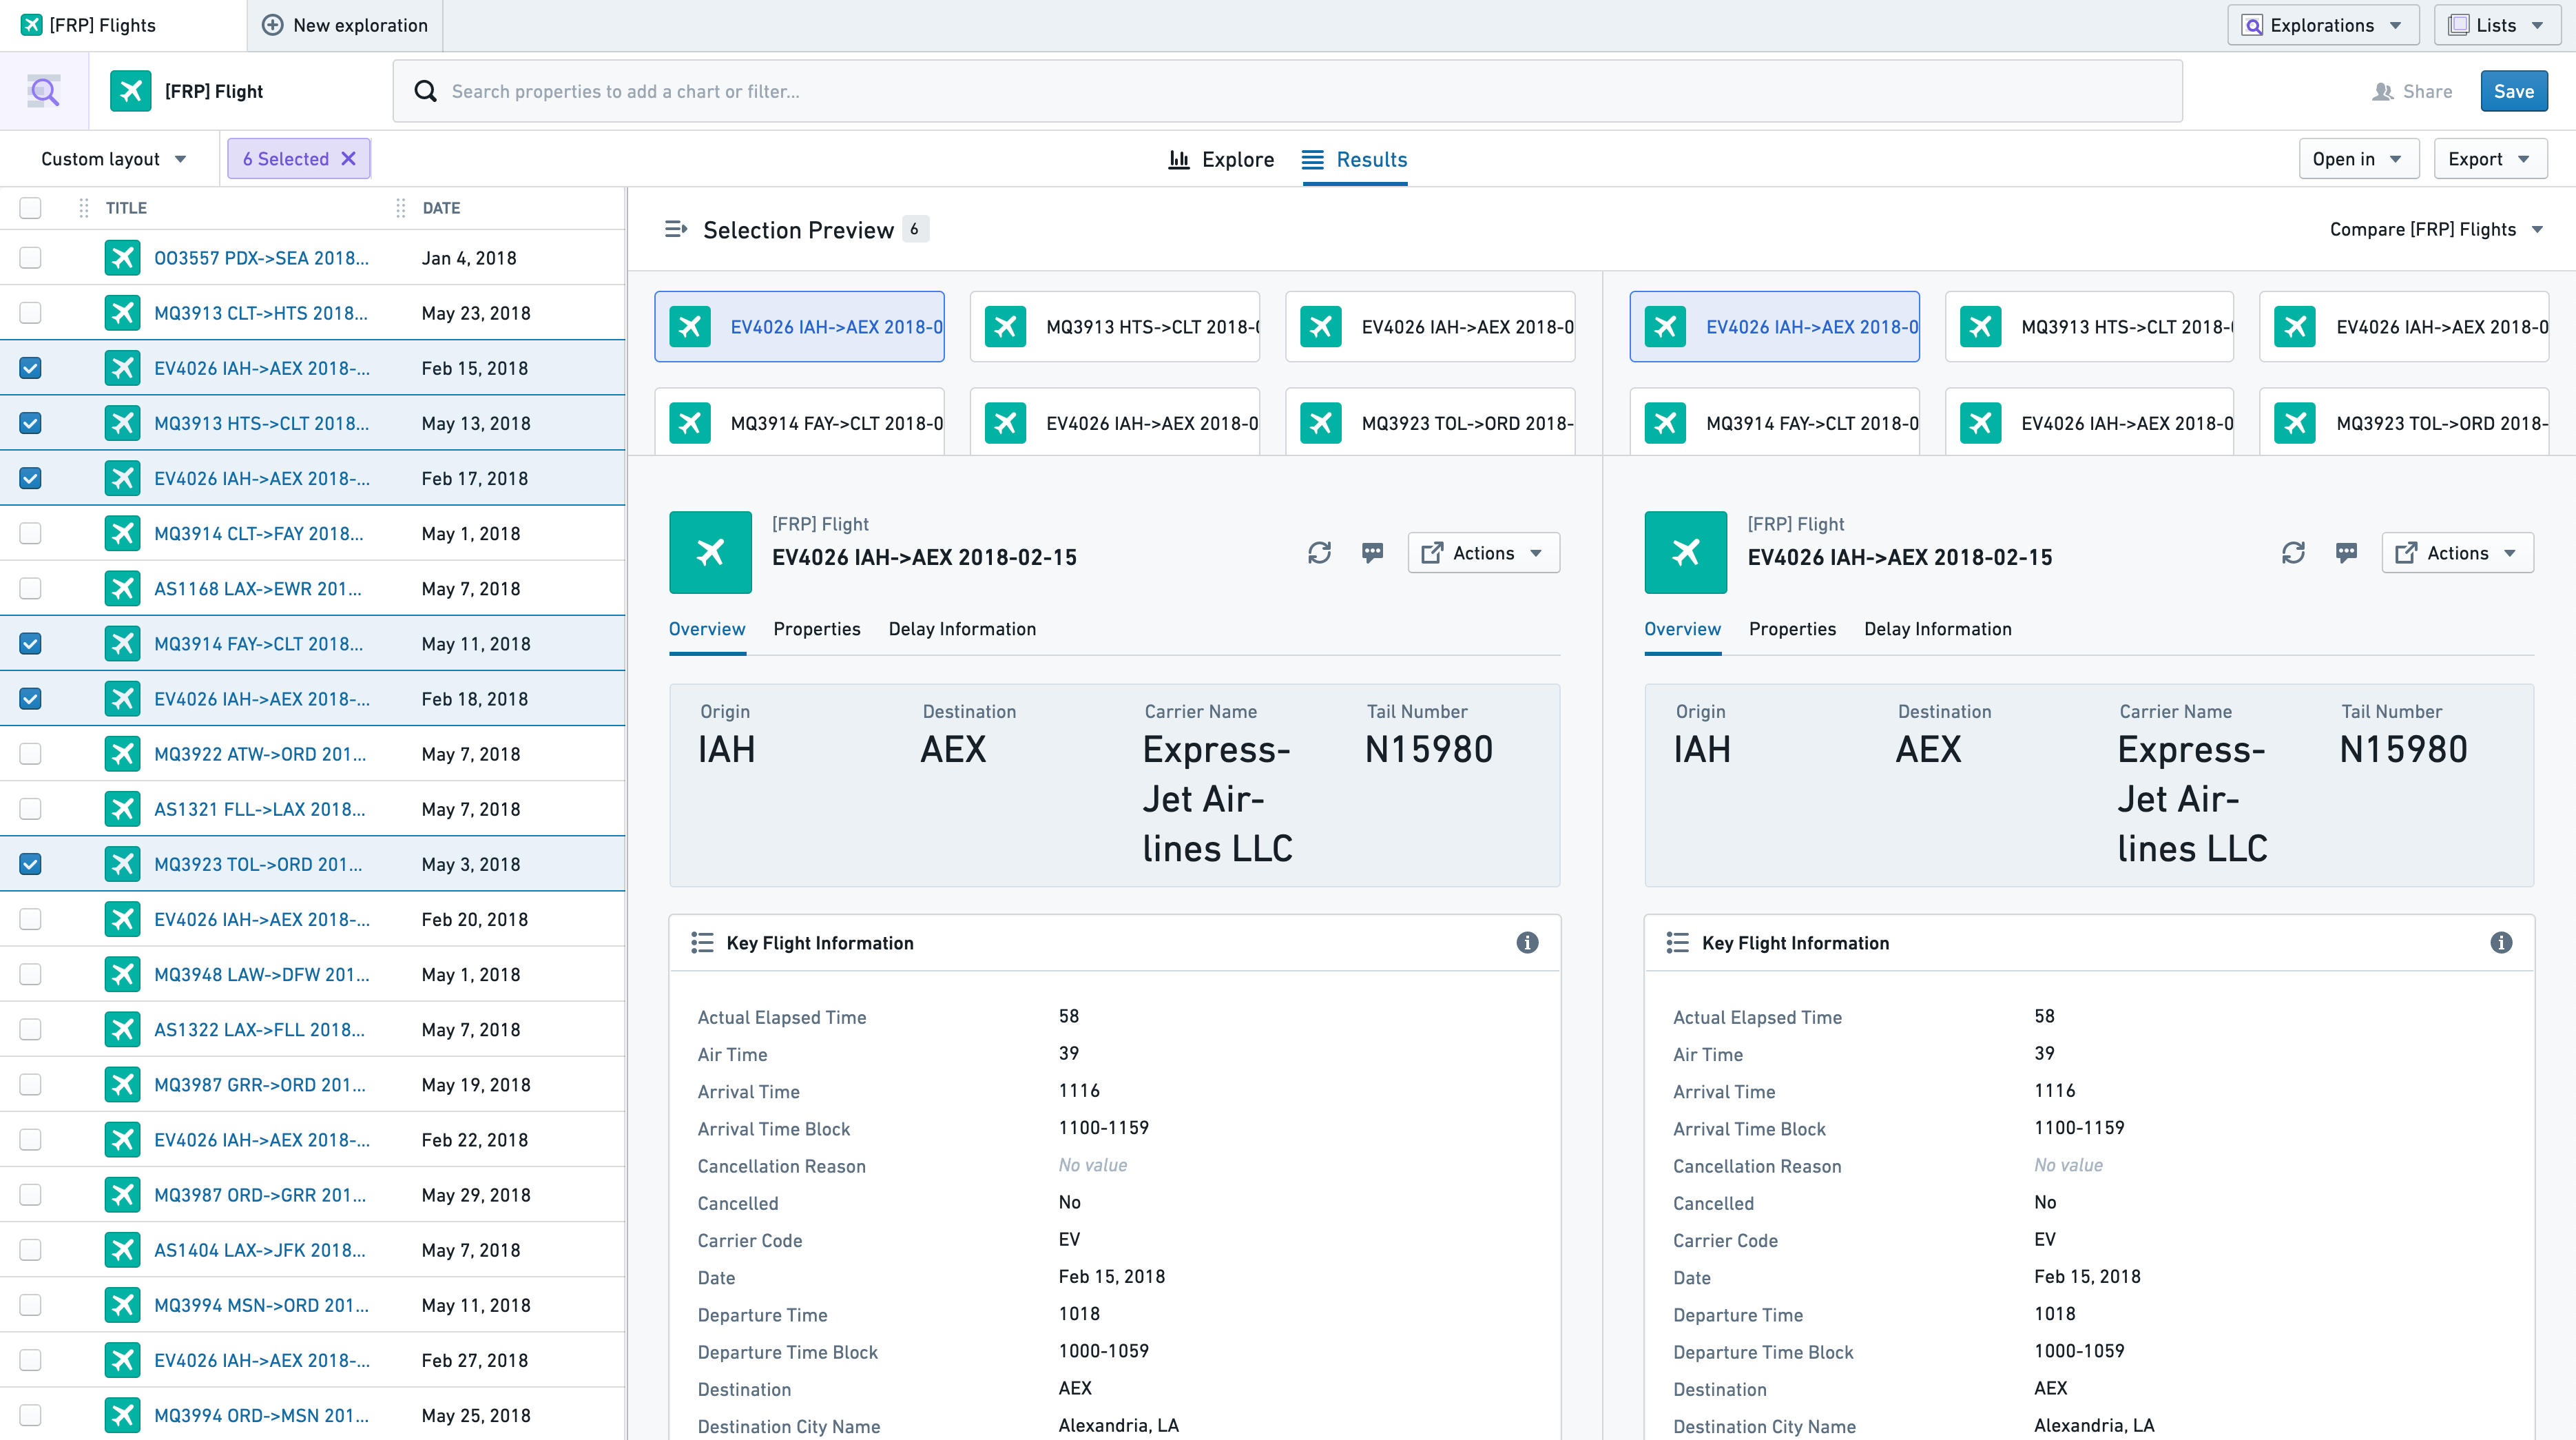
To compare object views for two objects at once, select the top right dropdown and choose “Compare objects”.
Viewing time series properties
Time series properties can be viewed alongside regular properties in the Results View. A time series property is an object property which stores a history of timestamped values. Learn more about time series properties.
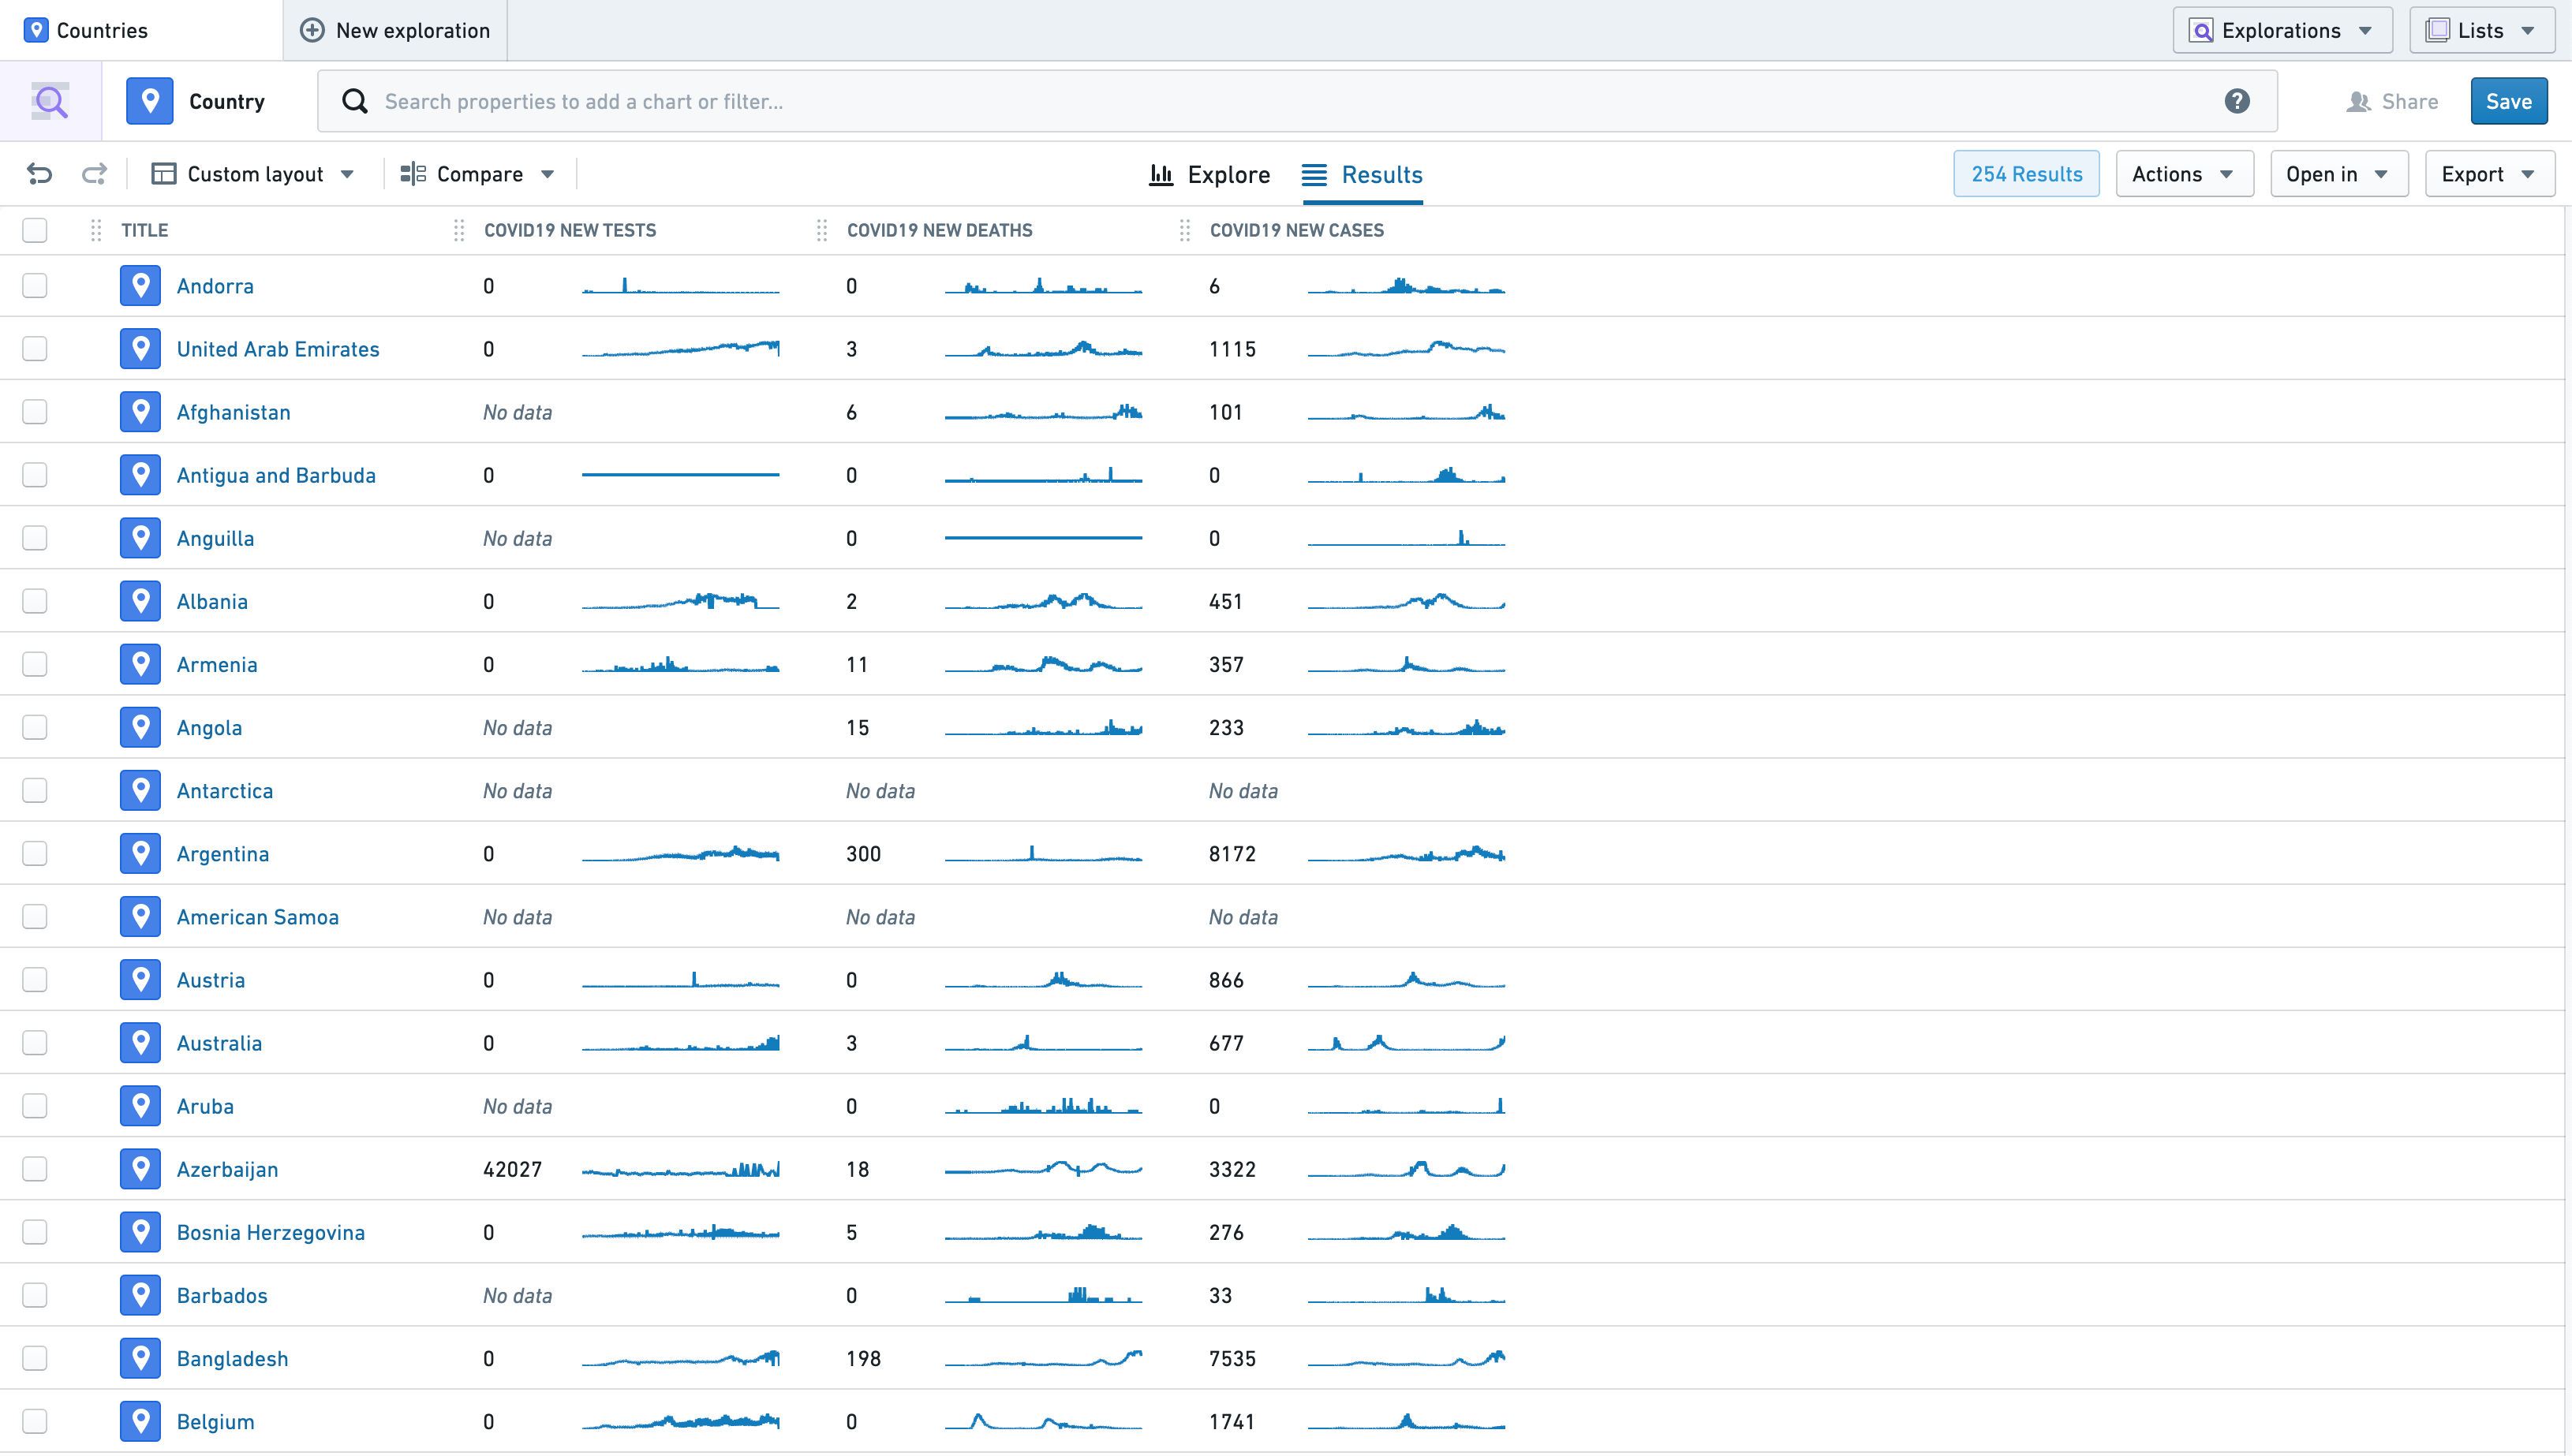
In the example below, the Results View displays the Country object, which contains three time series properties: COVID19 New Tests, COVID19 New Deaths, and COVID19 New Cases. Each column displays the most recent observation in the time series on the left, and a sparkline visualizing the history of the time series on the right.
Inline edits
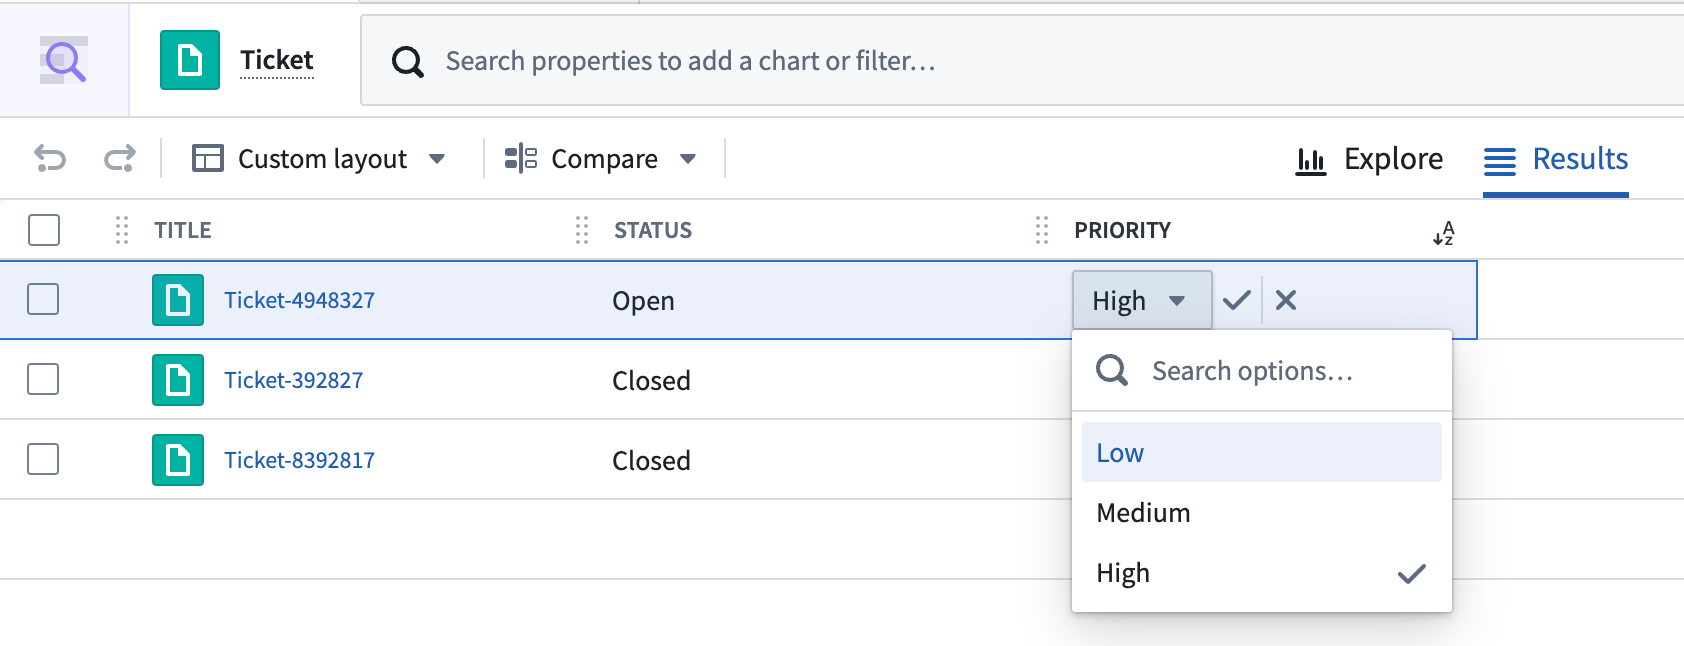
Properties that are configured with an inline edit action can be directly edited in the Object Explorer results page. Once a user meets the submission criteria of the inline edit action, a pen appears next to the value on hover. Clicking on the value enables an editable field, depending on the type of the property. To submit, the submission criteria need to be passed again, otherwise the submission button is not selectable.
中文翻译
查看结果
结果视图以表格形式展示探索中的对象。要加载更多对象到表格中,请向下滚动。
按列排序表格
结果表格可以按照应用了Sortable渲染提示(RenderHint)的属性进行排序。要按特定列排序,请点击列标题中的下拉箭头。
一旦某列被用于排序,其标题中会显示一个排序图标。如果选择了多列进行排序,最后选择的列将优先排序。之前的排序会在其排序图标旁显示一个数字以表示排序顺序,如下所示。
从下拉菜单中选择"清除所有排序"(Clear All Sorts)可将排序重置为原始状态。
配置列
更改列顺序
可以通过拖动列标题上的手柄图标来重新排列列的顺序。
用户可以从列标题下拉菜单中选择"冻结X列"(Freeze X columns)选项,以便在结果表中向右滚动时保持最左侧的X列可见。复选框列也计入该数量。
调整列宽
要调整列宽,请将列标题的右侧边缘拖动到所需宽度。这个边界以蓝色高亮显示,位于配置下拉菜单的右侧。
添加和移除列
要隐藏单个列,请从列标题下拉菜单中选择"隐藏此列"(Hide this column)选项。
要同时重新排列和配置多个列,请选择"配置列"(Configure columns)以打开以下菜单。
左侧面板显示表格的默认列,而右侧面板显示所有可能列的当前顺序和可见性。使用快捷按钮隐藏或添加所有列,或使用顶部的搜索栏搜索特定列以切换其可见性。
通过将列拖动到所需位置来更改列顺序,或使用下方菜单将列移至顶部或底部。
选择"不要在此表格中截断文本"(don't truncate text in this table)将导致文本属性在现有列宽无法显示时自动换行。
使用右下角的按钮保存您的配置。管理员可以通过将当前视图保存为新布局并将其设置为所有用户的默认布局来更新此表格的默认配置。了解有关更新默认配置的更多信息。
预览结果
要在新的对象探索器(Object Explorer)标签页中打开某个对象的对象视图,请点击该对象行的标题列。要在结果标签页中打开对象视图的预览,请通过点击对应行中的复选框或任何其他列来选择单个或多个对象。
选择对象后,选择预览面板将从右侧打开。要关闭此面板以查看完整表格视图,请使用面板左上角的"折叠"图标(![]() )。
)。
如果选择了多个对象,则前二十个对象中的任何一个的对象视图都可进行预览,显示在对象视图上方的卡片列表中。
要同时比较两个对象的对象视图,请选择右上角的下拉菜单并选择"比较对象"(Compare objects)。
查看时间序列属性
时间序列属性(Time series properties)可以在结果视图中与常规属性一起查看。时间序列属性是一种存储带时间戳值历史记录的对象属性。了解有关时间序列属性的更多信息。
在下面的示例中,结果视图显示了Country对象,该对象包含三个时间序列属性:COVID19 New Tests、COVID19 New Deaths和COVID19 New Cases。每列左侧显示时间序列中的最新观测值,右侧显示可视化时间序列历史数据的迷你图(Sparkline)。
内联编辑
配置了内联编辑操作(Inline edit action)的属性可以直接在对象探索器结果页面中进行编辑。当用户满足内联编辑操作的提交条件时,悬停在该值上时会显示一个笔形图标。点击该值会启用一个可编辑字段,具体取决于属性的类型。要提交,需要再次满足提交条件,否则提交按钮将不可选。