Performance Profiler(性能分析器(Performance Profiler))
Workshop’s Performance Profiler gives builders the ability to capture and view the performance of their applications, providing a tool to diagnose where high load times may be occurring and identify where optimizations can be made to improve the overall performance of applications.
To use Performance Profiler, enter Edit mode, open the Profiler tab, and select Reload in Profiler Mode to enter Profiler mode. Entering Profiler mode will refresh the module’s web browser page to allow the profiler to record network requests, starting from the module’s initialization. A banner will be displayed at the top of the page, letting builders know that they are currently in Profiler mode and that load events are actively being recorded.
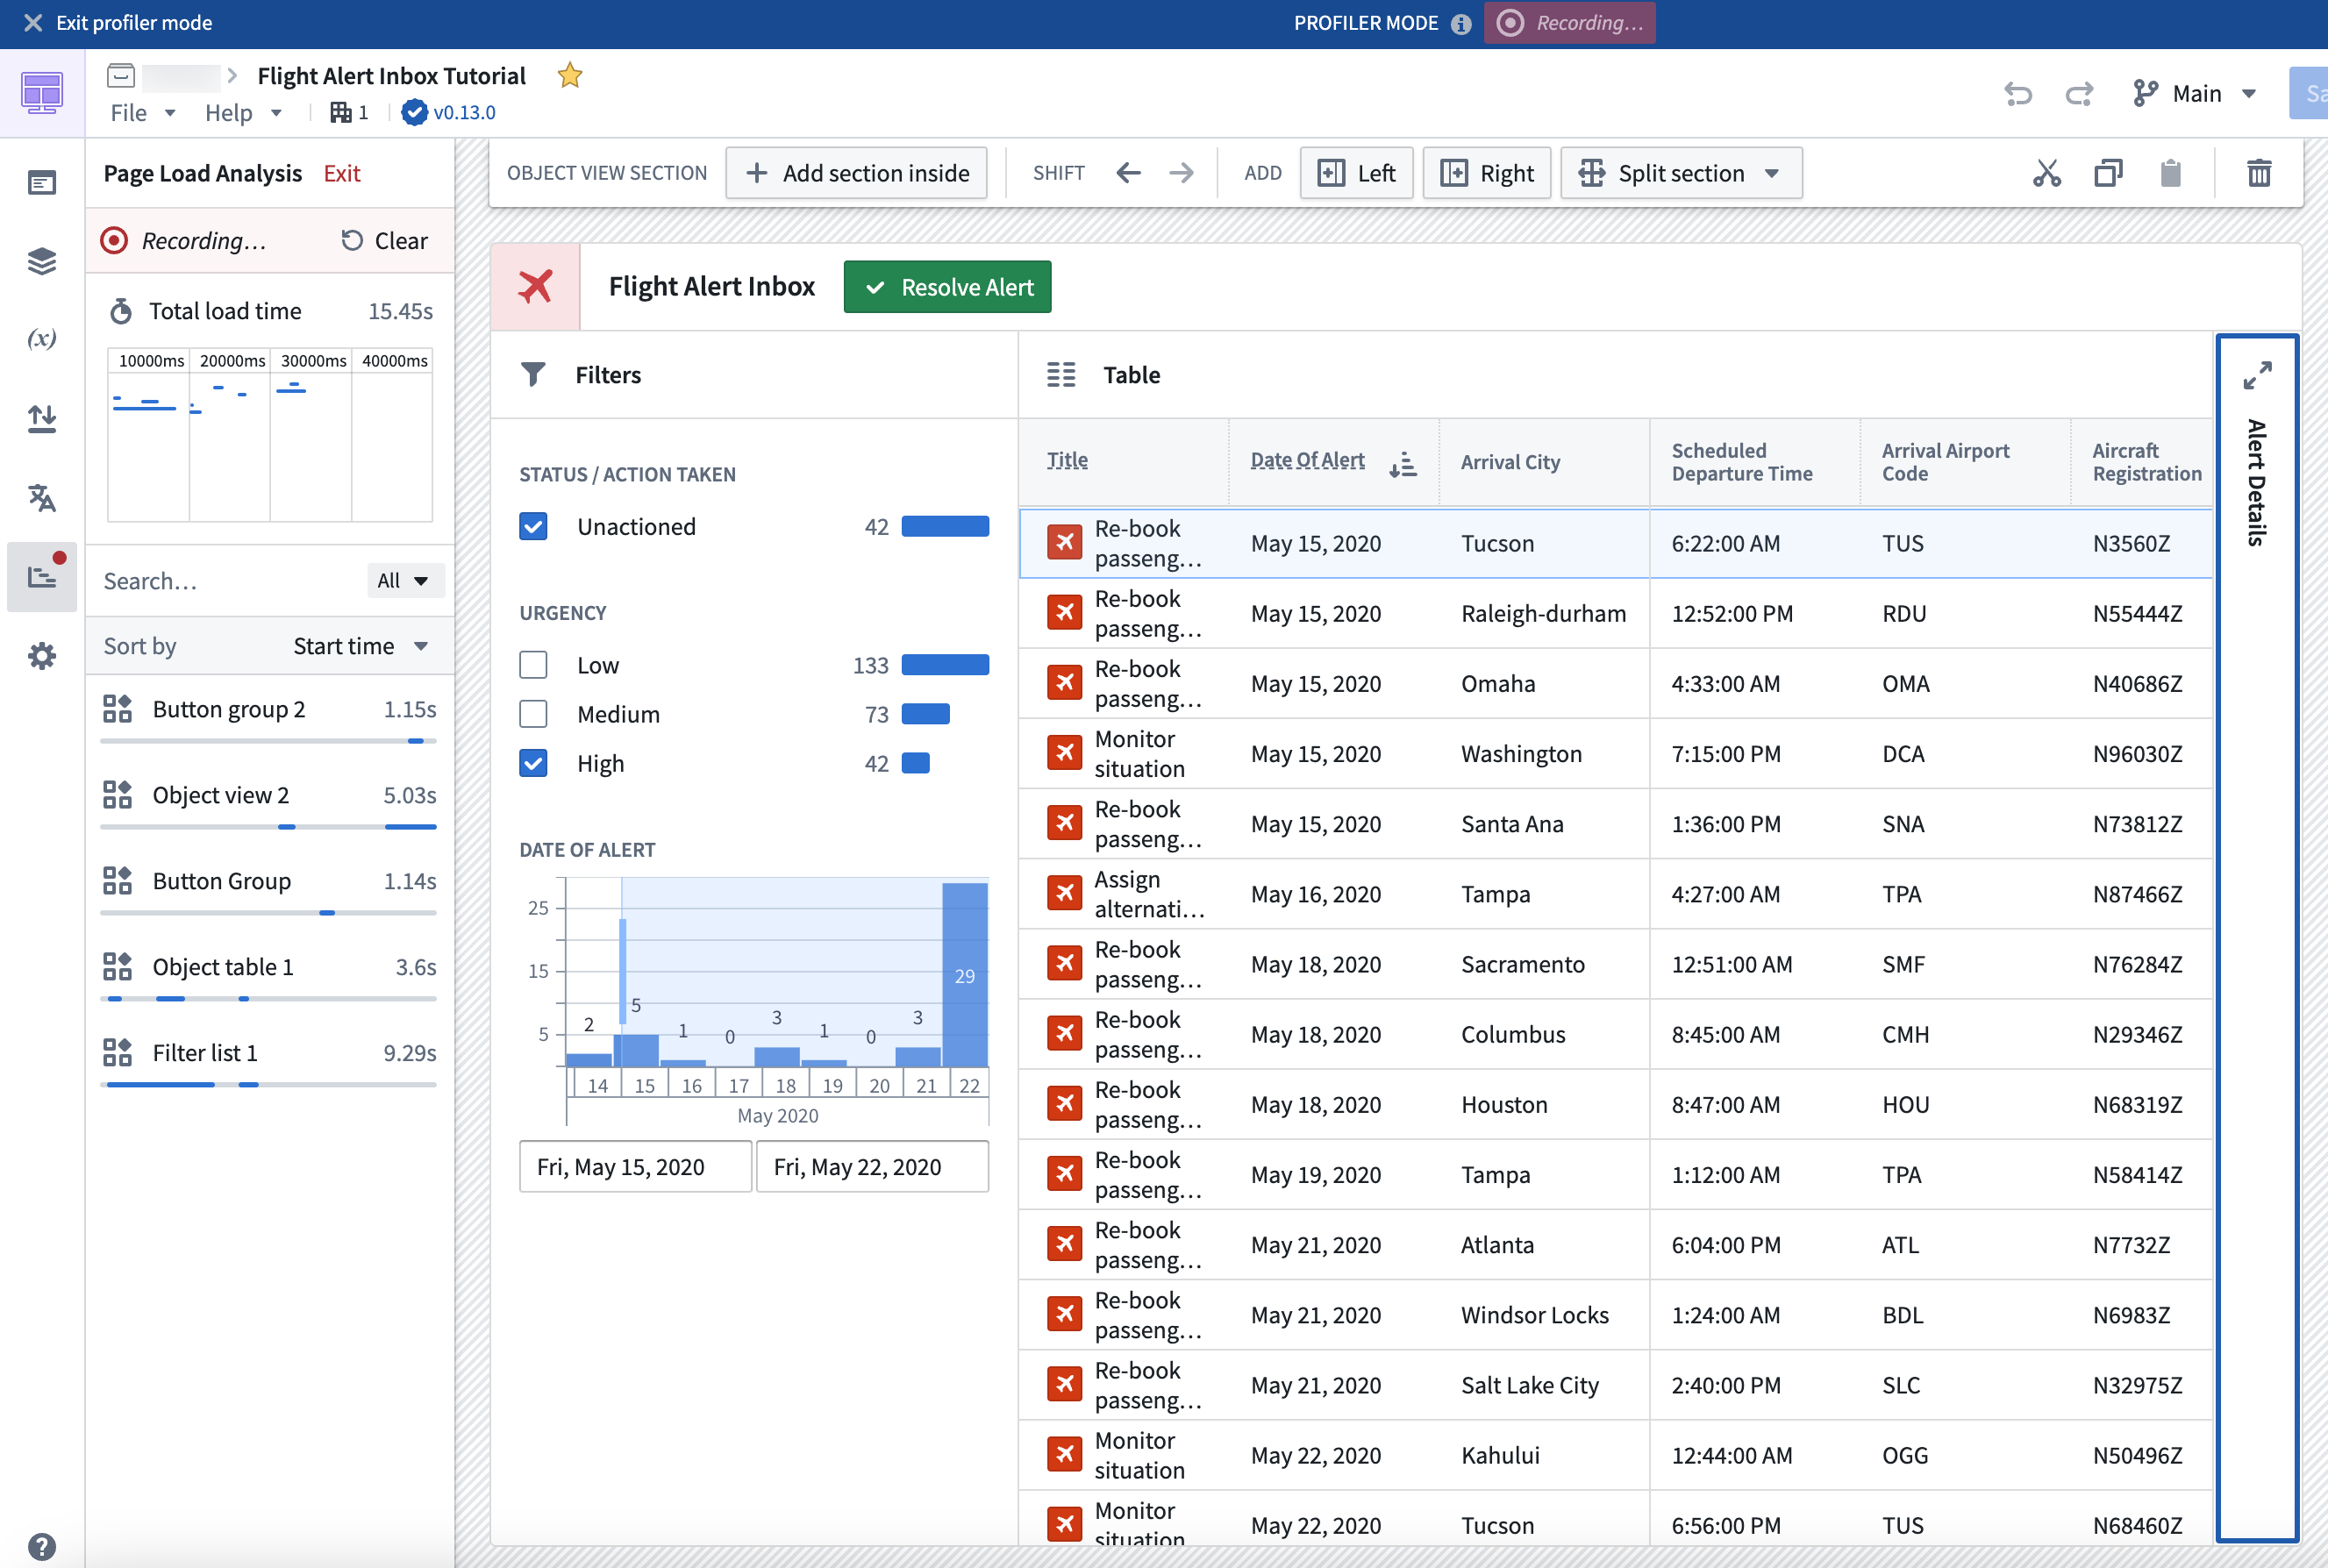
The profiler will display:
- The total module load time.
- The timeline view as widget and variables load or reload.
- The breakdown of load time by widgets and variables.
Only widgets and variables that affect the on-screen display are calculated, meaning that not all widgets and variables may be immediately shown in Profiler mode. This mirrors the behavior and performance that users experience in View mode, allowing for more accurate performance profiling.
You can interact with a module in Profiler mode in several ways, such as by triggering new layout views to prompt loading of new widgets and variables, or triggering widget reloads or variable recalculations by running Actions, Functions, or events. The profiler will capture new widget and variable load and reload events, allowing you to view their load times.
You can also filter widget and variable loads based on the page or overlay that triggered them, search for captured load events by widget or variable name, and clear all captured load events in the profiler. To exit Profiler mode select Exit at the top of the Profiler panel or in the Profiler mode banner. Exiting Profiler mode will refresh the module’s web browser page.
中文翻译
性能分析器(Performance Profiler)
Workshop 的性能分析器(Performance Profiler)使构建者能够捕获并查看其应用的性能表现,提供了一种诊断高加载时间可能发生位置的工具,并帮助识别可进行优化以提升应用整体性能的环节。
要使用性能分析器(Performance Profiler),请进入编辑模式(Edit mode),打开 分析器(Profiler) 选项卡,然后选择 以分析器模式重新加载(Reload in Profiler Mode) 以进入分析器模式。进入分析器模式将刷新模块的网页浏览器页面,以便分析器从模块初始化开始记录网络请求。页面顶部将显示一条横幅,告知构建者当前处于分析器模式,并且正在积极记录加载事件。
分析器将显示:
- 模块总加载时间。
- 微件(widget)和变量(variable)加载或重新加载时的时间线视图。
- 按微件(widget)和变量(variable)划分的加载时间明细。
只有影响屏幕显示的微件(widget)和变量(variable)才会被计算,这意味着并非所有微件和变量都会立即显示在分析器模式中。这反映了用户在查看模式(View mode)下所体验的行为和性能,从而能够进行更准确的性能分析。
您可以通过多种方式在分析器模式下与模块进行交互,例如触发新的布局视图以提示加载新的微件和变量,或通过运行操作(Actions)、函数(Functions)或事件(events)来触发微件重新加载或变量重新计算。分析器将捕获新的微件和变量加载及重新加载事件,使您能够查看它们的加载时间。
您还可以根据触发微件和变量加载的页面或叠加层(overlay)进行筛选,按微件或变量名称搜索已捕获的加载事件,并清除分析器中所有已捕获的加载事件。要退出分析器模式,请选择 分析器(Profiler) 面板顶部或分析器模式横幅中的 退出(Exit)。退出分析器模式将刷新模块的网页浏览器页面。