Usage metrics(使用指标(Usage metrics))
Workshop's usage metrics give module builders visibility into how their applications are being used. From the Metrics tab in the Workshop editor's left sidebar, you can view action submission counts and layout view counts to understand which parts of your module are most active and how usage trends change over time. All metrics are aggregate counts and are not attributable to any specific user.
Action metrics
Action metrics show how many times each action in the module has been successfully submitted. The overview card displays the total number of action submissions across the module for a selected time period along with the percentage change compared to the prior equivalent period.
Below the overview are individual actions with their submission counts and a proportional bar indicating relative usage. Select an action to view which widgets in the module use that action.
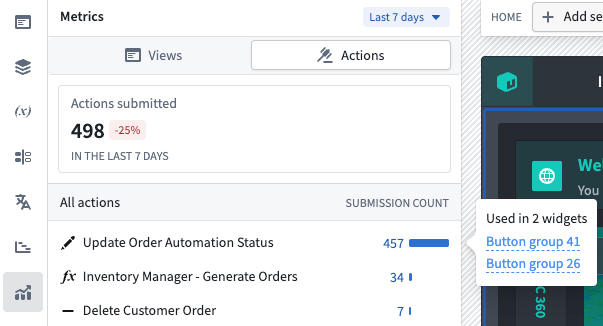
Action metrics are available by default for all modules and do not require any additional configuration.
Layout view metrics
Layout view metrics track how many times each page, tab, and overlay in the module has been viewed by users. The overview card displays total views across all layouts, and the list view breaks down views by individual layout item.
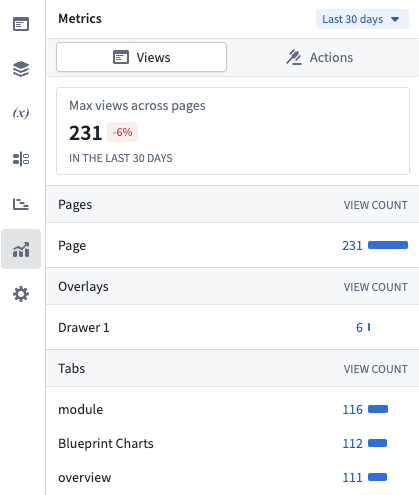
Selecting a page or overlay in the list navigates to that layout in the editor.
Enable layout view tracking
Layout view metrics require builders to opt in. To enable tracking:
- Open the module in Edit mode.
- Open Module settings.
- Navigate to the Metrics tab.
- Toggle on Usage Metrics Tracking.
After enabling, it may take up to 24 hours before view metrics begin to appear in the metrics panel. Layout view data is processed in a daily aggregation, so new views are reflected once per day rather than in real time.
Layout views are only recorded when the module is viewed on the main branch in View mode. Views in Edit mode or on draft branches are not tracked.
Time period
Both action metrics and layout view metrics support configurable time periods. Use the period picker at the top of the Metrics panel to select 7 days, 30 days, or 90 days. The default is 30 days.
Each overview card shows the percentage change compared to the previous equivalent period. For example, when viewing the last 30 days, the percentage change compares against the 30 days before that.
Embedded modules
For modules that use embedded modules, overlay views originating from an embedded module are attributed to the embedded module rather than to the parent module.
中文翻译
使用指标(Usage metrics)
工坊(Workshop)的使用指标可以让模块(Module)构建者清晰了解其应用的使用情况。在工坊(Workshop)编辑器左侧边栏的指标标签页中,你可以查看操作(Action)提交次数和布局(Layout)浏览次数,从而了解模块中哪些部分最活跃,以及使用趋势随时间的变化情况。所有指标均为聚合计数,无法关联到任何特定用户。
操作指标(Action metrics)
操作指标展示模块中每个操作成功提交的次数。概览卡片会展示所选时间段内整个模块的操作提交总次数,以及与上一个同等时长时间段相比的变化百分比。
概览下方是各个独立操作的提交次数,以及展示相对使用情况的比例条形图。选择某个操作即可查看模块中哪些组件(Widget)使用了该操作。
所有模块默认启用操作指标,无需额外配置。
布局浏览指标(Layout view metrics)
布局浏览指标会追踪用户浏览模块中每个页面、标签页和浮层(Overlay)的次数。概览卡片展示所有布局的总浏览量,列表视图则按单个布局项拆分展示各部分的浏览量。
在列表中选择某个页面或浮层,即可跳转至编辑器中对应布局的位置。
启用布局浏览追踪
布局浏览指标需要构建者主动开启。要启用追踪功能,请按照以下步骤操作:
- 在编辑模式下打开目标模块。
- 打开模块设置。
- 切换至指标标签页。
- 开启使用指标追踪开关。
启用后,最长可能需要24小时浏览指标才会开始显示在指标面板中。布局浏览数据按每日聚合处理,因此新的浏览数据会每日更新一次,而非实时更新。
布局浏览记录仅统计在主分支以查看模式打开模块的访问行为,编辑模式下或草稿分支的访问不会被统计。
时间段
操作指标和布局浏览指标均支持自定义时间段。你可以使用指标面板顶部的时间选择器选择7天、30天或90天,默认选项为30天。
每张概览卡片都会展示与上一个同等时长时间段相比的变化百分比。例如,当你查看最近30天的指标时,变化百分比是和再往前30天的指标对比计算得出的。