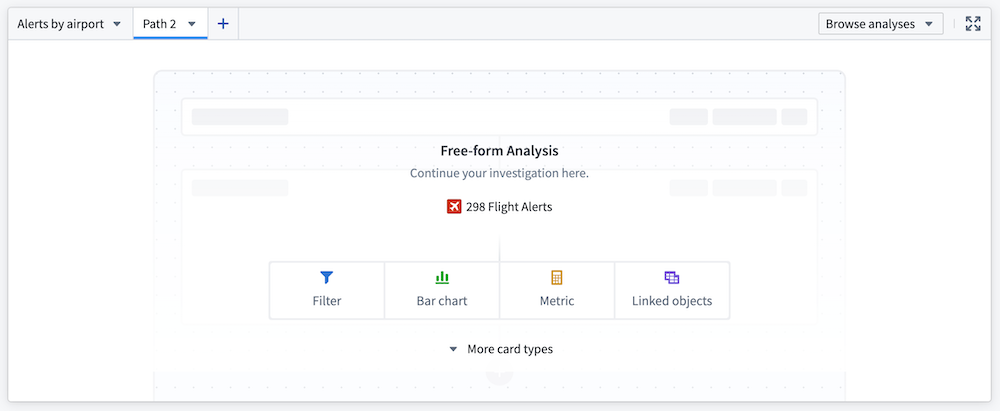
Free-form Analysis(自由形式分析)
The Free-form Analysis widget enables users to independently investigate object data with flexibility, within the framework of the Workshop application.
Available cards
Core display cards
- Metric card: Display numeric aggregations of an object set, including average, count, minimum, maximum, sum, and approximate unique count of a selected property.
- Text card: Add annotations to your analysis with a rich text editor card.
Object cards
- Filter object set: Take an input object set and return an object set based on logical conditions defined on both object properties and properties of linked objects.
- Linked objects: Expose relationships between object types and provide exploration into linked objects.
- Object selector: Select and pin a single object (for example, a particular alert within a
Flight Alertobject type).
Table cards
- Object table: Present an object set in a table, with select properties displayed as columns of a table.
- Pivot table: Display data aggregations from an object set in a table. Choose object properties to serve as row and column properties; the resulting data is organized into groups based on these object properties and aggregated according to the specified configuration.
Visualizations
- Bar chart: Create a horizontal or vertical bar plot of objects. Categories are defined by object properties, and values can be determined by object count (default) or average, maximum, minimum, or sum of a property value.
- Heat grid: Display a three-dimensional chart, illustrating two categorical dimensions and an aggregate dimension (count, average, sum, maximum, or minimum) by color.
- Line chart: Define categories based on object properties. Set values to object count (default) or average, maximum, minimum, or sum of a property value.
- Pie chart: Define categories based on object properties. Set values to object count (default) or average, maximum, minimum, sum of a property value.
- Waterfall plot: Display the running total (average, count, maximum, minimum, sum, or unique count) of one property as values (grouped by a second property) are added or subtracted.
Connect to other Palantir applications
- Open in Quiver: Perform more complex analyses in a Quiver analysis.
- Note: Selecting Open in Quiver creates a duplicate analysis; any changes in the Quiver analysis will not be reflected in the analysis path in the Workshop widget.
- Copy to Notepad: Allows users to copy cards to Notepad.
- Note: This functionality is only available for saved analyses.
Configuration options
- Input object set: The object set that serves as the base input to the analysis.
- Empty state header and description: Define how the widget is configured when there are no cards in a path.
- Enable path saving: Save and share analyses for future reference. Analyses can be saved as either Private or Public.
- Enable copy for Notepad (only available for saved analysis paths): Copy individual cards in a path to add to a Notepad. Cards can only be copied for Notepad if they are in a saved analysis path.
- Output object set: Save the output object set for reference elsewhere within the Workshop application.
中文翻译
自由形式分析
自由形式分析(Free-form Analysis)组件使用户能够在Workshop应用的框架内,灵活且独立地探索对象数据。
可用卡片
核心展示卡片
- 指标卡(Metric card): 显示对象集的数值聚合结果,包括所选属性的平均值、计数、最小值、最大值、总和以及近似唯一计数。
- 文本卡(Text card): 使用富文本编辑器卡片为分析添加注释。
对象卡片
- 筛选对象集(Filter object set): 接收一个输入对象集,并根据针对对象属性及关联对象属性定义的逻辑条件,返回一个对象集。
- 关联对象(Linked objects): 揭示对象类型之间的关系,并提供对关联对象的探索功能。
- 对象选择器(Object selector): 选择并固定单个对象(例如,
Flight Alert对象类型中的某个特定警报)。
表格卡片
- 对象表(Object table): 以表格形式呈现对象集,选定的属性显示为表格的列。
- 透视表(Pivot table): 在表格中显示对象集的数据聚合结果。选择对象属性作为行和列属性;结果数据将根据这些对象属性分组,并按照指定配置进行聚合。
可视化图表
- 条形图(Bar chart): 创建对象的水平或垂直条形图。类别由对象属性定义,数值可通过对象计数(默认)或属性值的平均值、最大值、最小值、总和来确定。
- 热力图(Heat grid): 显示三维图表,通过颜色展示两个分类维度以及一个聚合维度(计数、平均值、总和、最大值或最小值)。
- 折线图(Line chart): 基于对象属性定义类别。将数值设置为对象计数(默认)或属性值的平均值、最大值、最小值、总和。
- 饼图(Pie chart): 基于对象属性定义类别。将数值设置为对象计数(默认)或属性值的平均值、最大值、最小值、总和。
- 瀑布图(Waterfall plot): 显示一个属性的累计值(平均值、计数、最大值、最小值、总和或唯一计数),该累计值随着第二个属性分组的数值被添加或减去而变化。
连接到其他Palantir应用
- 在Quiver中打开(Open in Quiver): 在Quiver分析中执行更复杂的分析。
- 注意:选择在Quiver中打开会创建一个重复的分析;Quiver分析中的任何更改都不会反映在Workshop组件的分析路径中。
- 复制到Notepad(Copy to Notepad): 允许用户将卡片复制到Notepad。
- 注意:此功能仅适用于已保存的分析。
配置选项
- 输入对象集(Input object set): 作为分析基础输入的对象集。
- 空状态标题和描述(Empty state header and description): 定义当路径中没有卡片时组件的配置方式。
- 启用路径保存(Enable path saving): 保存并共享分析以供将来参考。分析可以保存为私有(Private)或公开(Public)。
- 启用Notepad复制(Enable copy for Notepad)(仅适用于已保存的分析路径):复制路径中的单个卡片以添加到Notepad。只有位于已保存分析路径中的卡片才能复制到Notepad。
- 输出对象集(Output object set): 保存输出对象集,以便在Workshop应用中的其他位置引用。