Gantt Chart(甘特图(Gantt Chart))
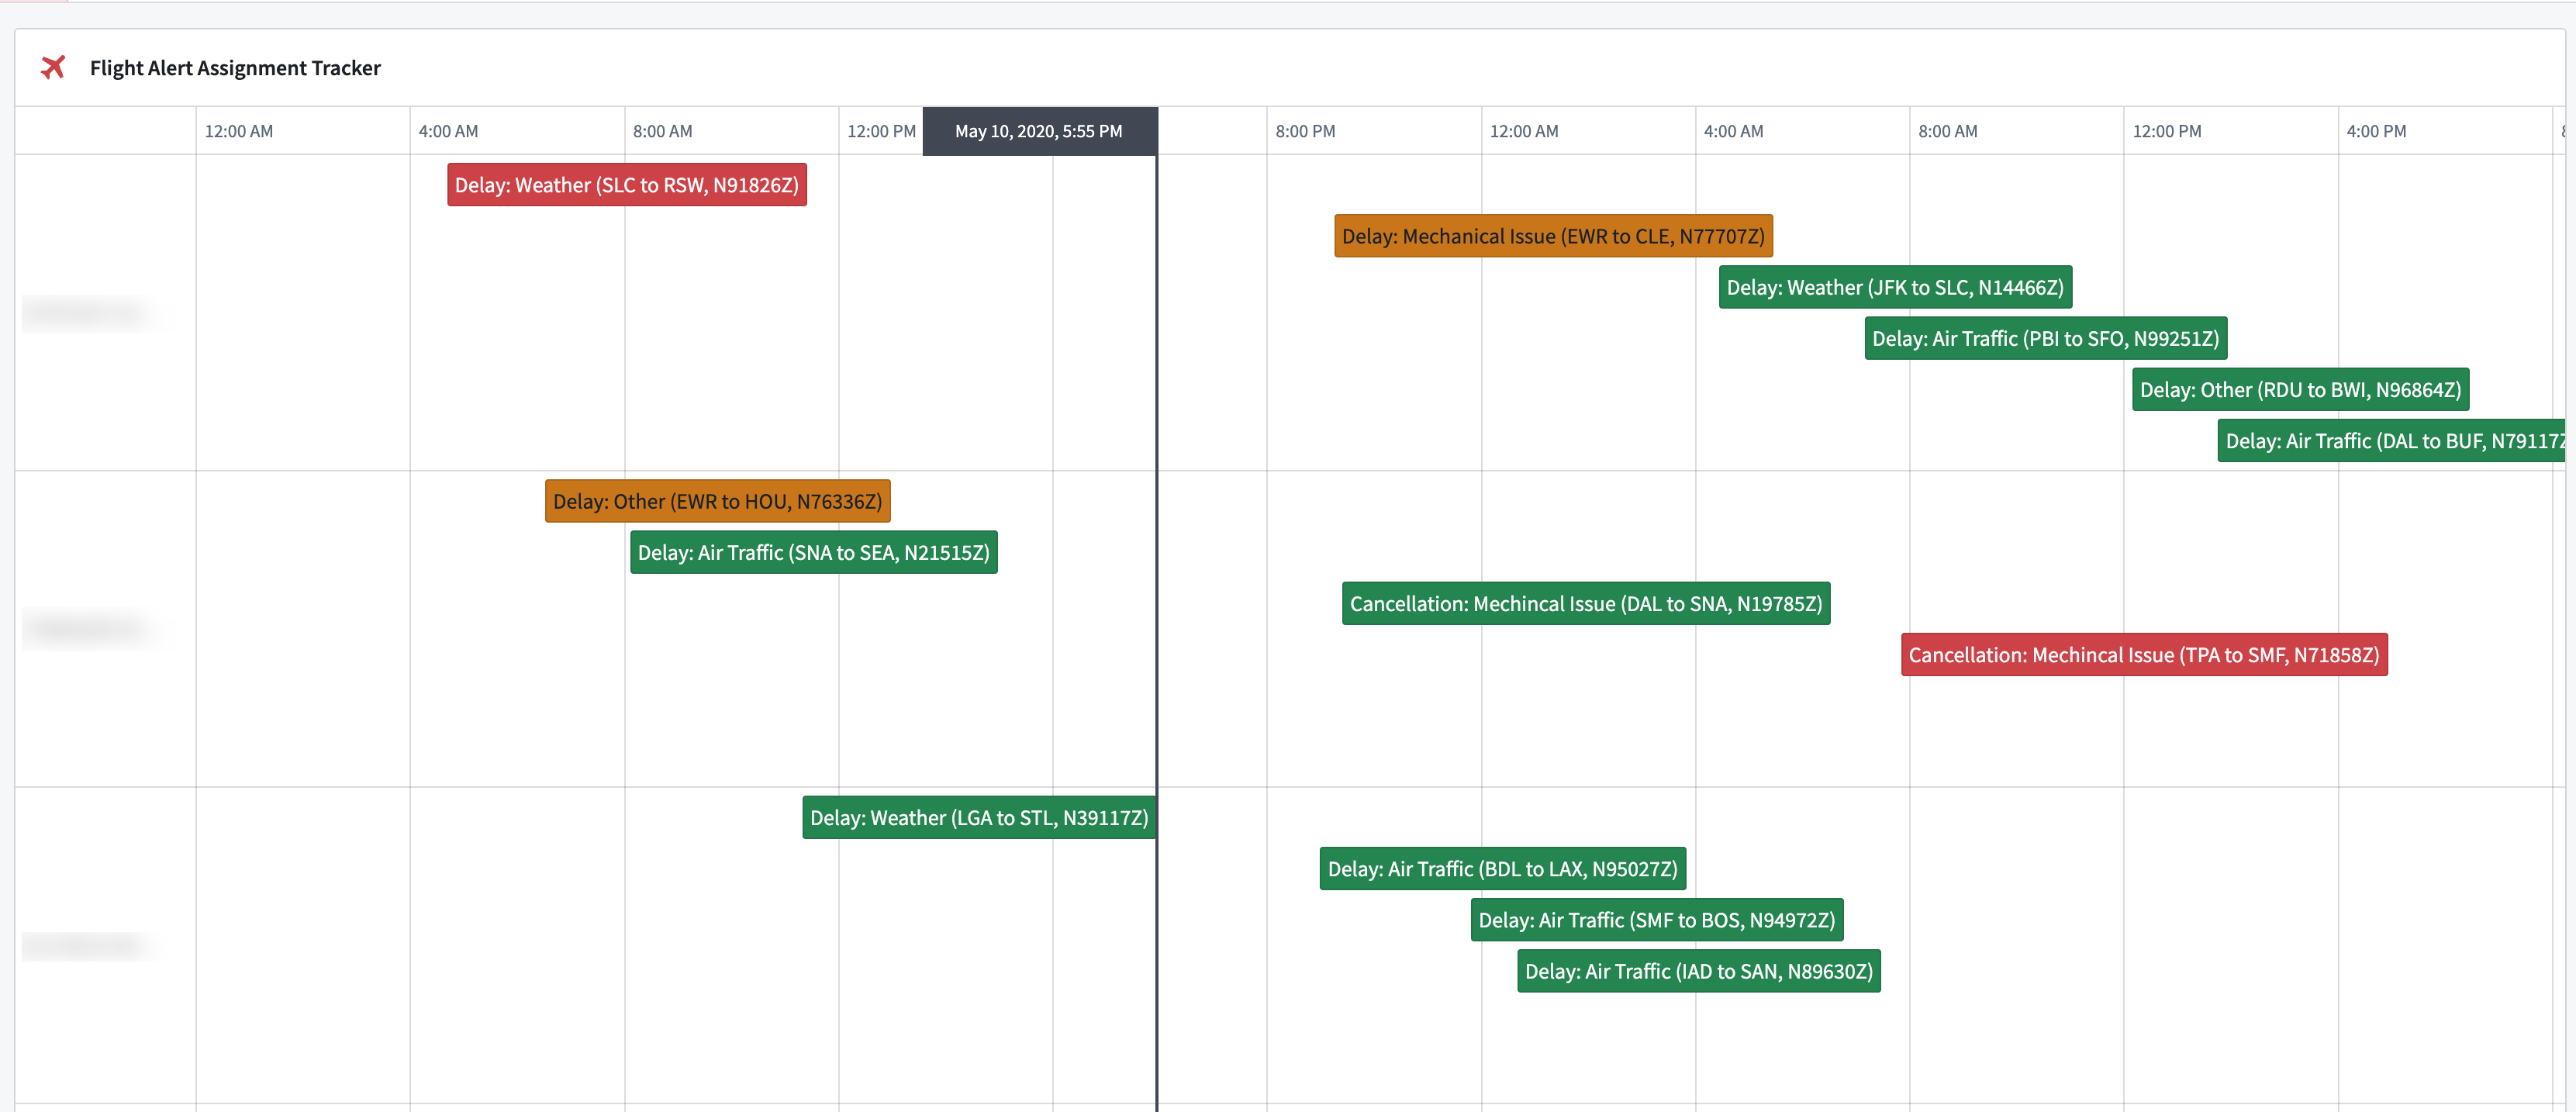
Use the Gantt Chart widget to display objects as timed events in an interactive Gantt chart view to help with scheduling or resource allocation workflows.
Configuration options
- Data layers
- You can use multiple layers to aggregate temporal data across multiple object types as events on a single Gantt chart.
- Layer name: The name of the layer to help differentiate between different layers during configuration. This value is not displayed in the chart itself.
- Input
- Object set: The inputted object set definition that will display for a chart layer.
- Load data from scenario: Select the Scenario to load data for a chart layer.
- Event type:
- Time range: Display events as a range with a specified start and end time.
- Event start date property: Select a date or timestamp property to use as the start time of the events.
- Event end date property: Select a date or timestamp property to use as the end time of the events .
- Event label property: Select a property to use as the displayed label value for the event.
- Handling events with no end time: Select how to handle events with no end time value.
- Exclude: Do not display the event on the chart.
- Draw as point: Display the event as a single point on the chart.
- Use specific timestamp as end time: Set a fallback timestamp variable to be used as the end time.
- Discrete: Display events as a single point on the chart using a single date or timestamp property.
- Display and formatting
- Group by properties: Group objects together on the Gantt chart by common property values.
- Event color: Select the color(s) to use when displaying events in the chart.
- Static: Select a single color for all events.
- Property: Select an object property with pre-configured conditional formatting rules through the Ontology to determine the color(s) of events.
- Dynamic: Configure conditional formatting rules to apply on events in the chart.
- Properties on hover: Select object properties to display on hover over the object event in the chart.
- Output
- Enable selection: Toggle to enable/disable a selection of objects on the chart.
- Enable multiselect: Toggle to enable/disable a selection of multiple objects on the chart by using
Ctrl(macOS) orCmd(Windows) plus click. - Selected object set: The object set variable of the selected objects.
- On selection: Set a Workshop event to trigger on selection of an object on the chart.
- Display options
- Show current time indicator: Display an indicator for the current date directly on the chart.
- Timezone rendering:
- Static: Manually select a timezone for the chart.
- Dynamic: Dynamically set a timezone with a string variable.
- Local: Set the chart timezone to the user’s local timezone.
- Enable grid unit markers: Grid unit markers can be set to yearly, quarterly, monthly, weekly, daily, or hourly. Depending on the selected option, you may need to specify a starting month, day, or hour.
- Stacking options
- New rows: Each event will be displayed in its own row.
- Overlap: Events will be displayed on the same row and may overlap with each other.
- Smart rows: Events will be displayed so they do not overlap by shifting them onto new rows as needed. Non-overlapping events will be displayed on the same row, and overlapping events will be displayed on separate rows.
- Row ordering: If property grouping is configured, set how row groupings are ordered. Options include sorting alphabetically by property or by first event start time.
- Row-level grouping width: Set the width of the property grouping column in the chart.
- Timeline start: Manually set the start time for the chart’s display using a timestamp variable.
- Timeline end: Manually set an end time for the chart’s displaying using a timestamp variable.
中文翻译
甘特图(Gantt Chart)
使用甘特图(Gantt Chart) 组件以交互式甘特图视图的形式将对象显示为定时事件,帮助进行调度或资源分配工作流。
配置选项
- 数据层(Data layers)
- 您可以使用多个层来聚合跨多种对象类型的时间数据,在单个甘特图上显示为事件。
- 层名称(Layer name): 层的名称,用于在配置过程中区分不同层。该值不会显示在图表本身中。
- 输入(Input)
- 对象集(Object set): 输入的对象集定义,将显示在图表层中。
- 从场景加载数据(Load data from scenario): 选择要加载图表层数据的场景(Scenario)。
- 事件类型(Event type):
- 时间范围(Time range): 将事件显示为具有指定开始和结束时间的范围。
- 事件开始日期属性(Event start date property): 选择一个日期或时间戳属性作为事件的开始时间。
- 事件结束日期属性(Event end date property): 选择一个日期或时间戳属性作为事件的结束时间。
- 事件标签属性(Event label property): 选择一个属性作为事件的显示标签值。
- 处理无结束时间的事件(Handling events with no end time): 选择如何处理没有结束时间值的事件。
- 排除(Exclude): 不在图表上显示该事件。
- 绘制为点(Draw as point): 在图表上将事件显示为单个点。
- 使用特定时间戳作为结束时间(Use specific timestamp as end time): 设置一个回退时间戳变量作为结束时间。
- 离散(Discrete): 使用单个日期或时间戳属性将事件显示为图表上的单个点。
- 显示与格式(Display and formatting)
- 按属性分组(Group by properties): 按共同的属性值将对象分组在甘特图上。
- 事件颜色(Event color): 选择在图表中显示事件时使用的颜色。
- 静态(Static): 为所有事件选择单一颜色。
- 属性(Property): 选择一个对象属性,该属性通过本体论(Ontology)预配置的条件格式规则来确定事件的颜色。
- 动态(Dynamic): 配置条件格式规则以应用于图表中的事件。
- 悬停时显示的属性(Properties on hover): 选择在图表中悬停对象事件时显示的对象属性。
- 输出(Output)
- 启用选择(Enable selection): 切换以启用/禁用图表上对象的选择。
- 启用多选(Enable multiselect): 切换以启用/禁用通过使用
Ctrl(macOS)或Cmd(Windows)加点击来选择图表上的多个对象。 - 选中的对象集(Selected object set): 选中对象的对象集变量。
- 选择时(On selection): 设置在图表上选择对象时触发的Workshop事件。
- 显示选项(Display options)
- 显示当前时间指示器(Show current time indicator): 在图表上直接显示当前日期的指示器。
- 时区渲染(Timezone rendering):
- 静态(Static): 手动为图表选择时区。
- 动态(Dynamic): 使用字符串变量动态设置时区。
- 本地(Local): 将图表时区设置为用户的本地时区。
- 启用网格单位标记(Enable grid unit markers): 网格单位标记可以设置为年、季度、月、周、日或小时。根据所选选项,您可能需要指定起始月份、日期或小时。
- 堆叠选项(Stacking options)
- 新行(New rows): 每个事件将显示在自己的行中。
- 重叠(Overlap): 事件将显示在同一行上,可能相互重叠。
- 智能行(Smart rows): 事件将按需移动到新行以避免重叠。不重叠的事件将显示在同一行,重叠的事件将显示在不同行。
- 行排序(Row ordering): 如果配置了属性分组,设置行分组的排序方式。选项包括按属性字母顺序排序或按第一个事件开始时间排序。
- 行级分组宽度(Row-level grouping width): 设置图表中属性分组列的宽度。
- 时间轴起始(Timeline start): 使用时间戳变量手动设置图表显示的起始时间。
- 时间轴结束(Timeline end): 使用时间戳变量手动设置图表显示的结束时间。