Vega Chart(Vega 图表(Vega Chart))
The Vega Chart widget is used to create fully customizable and interactive visualizations in Workshop using the Vega and Vega-Lite ↗ grammars.
What is Vega?
Vega allows you to create, save, and share interactive visualization designs in the form of a concise JSON spec that describes the appearance and behavior of the visualization. Vega is a higher-level visualization specification language built on top of D3 ↗, and Vega-Lite is a higher-level language built on top of Vega that provides a more concise and convenient way to author common visualizations.
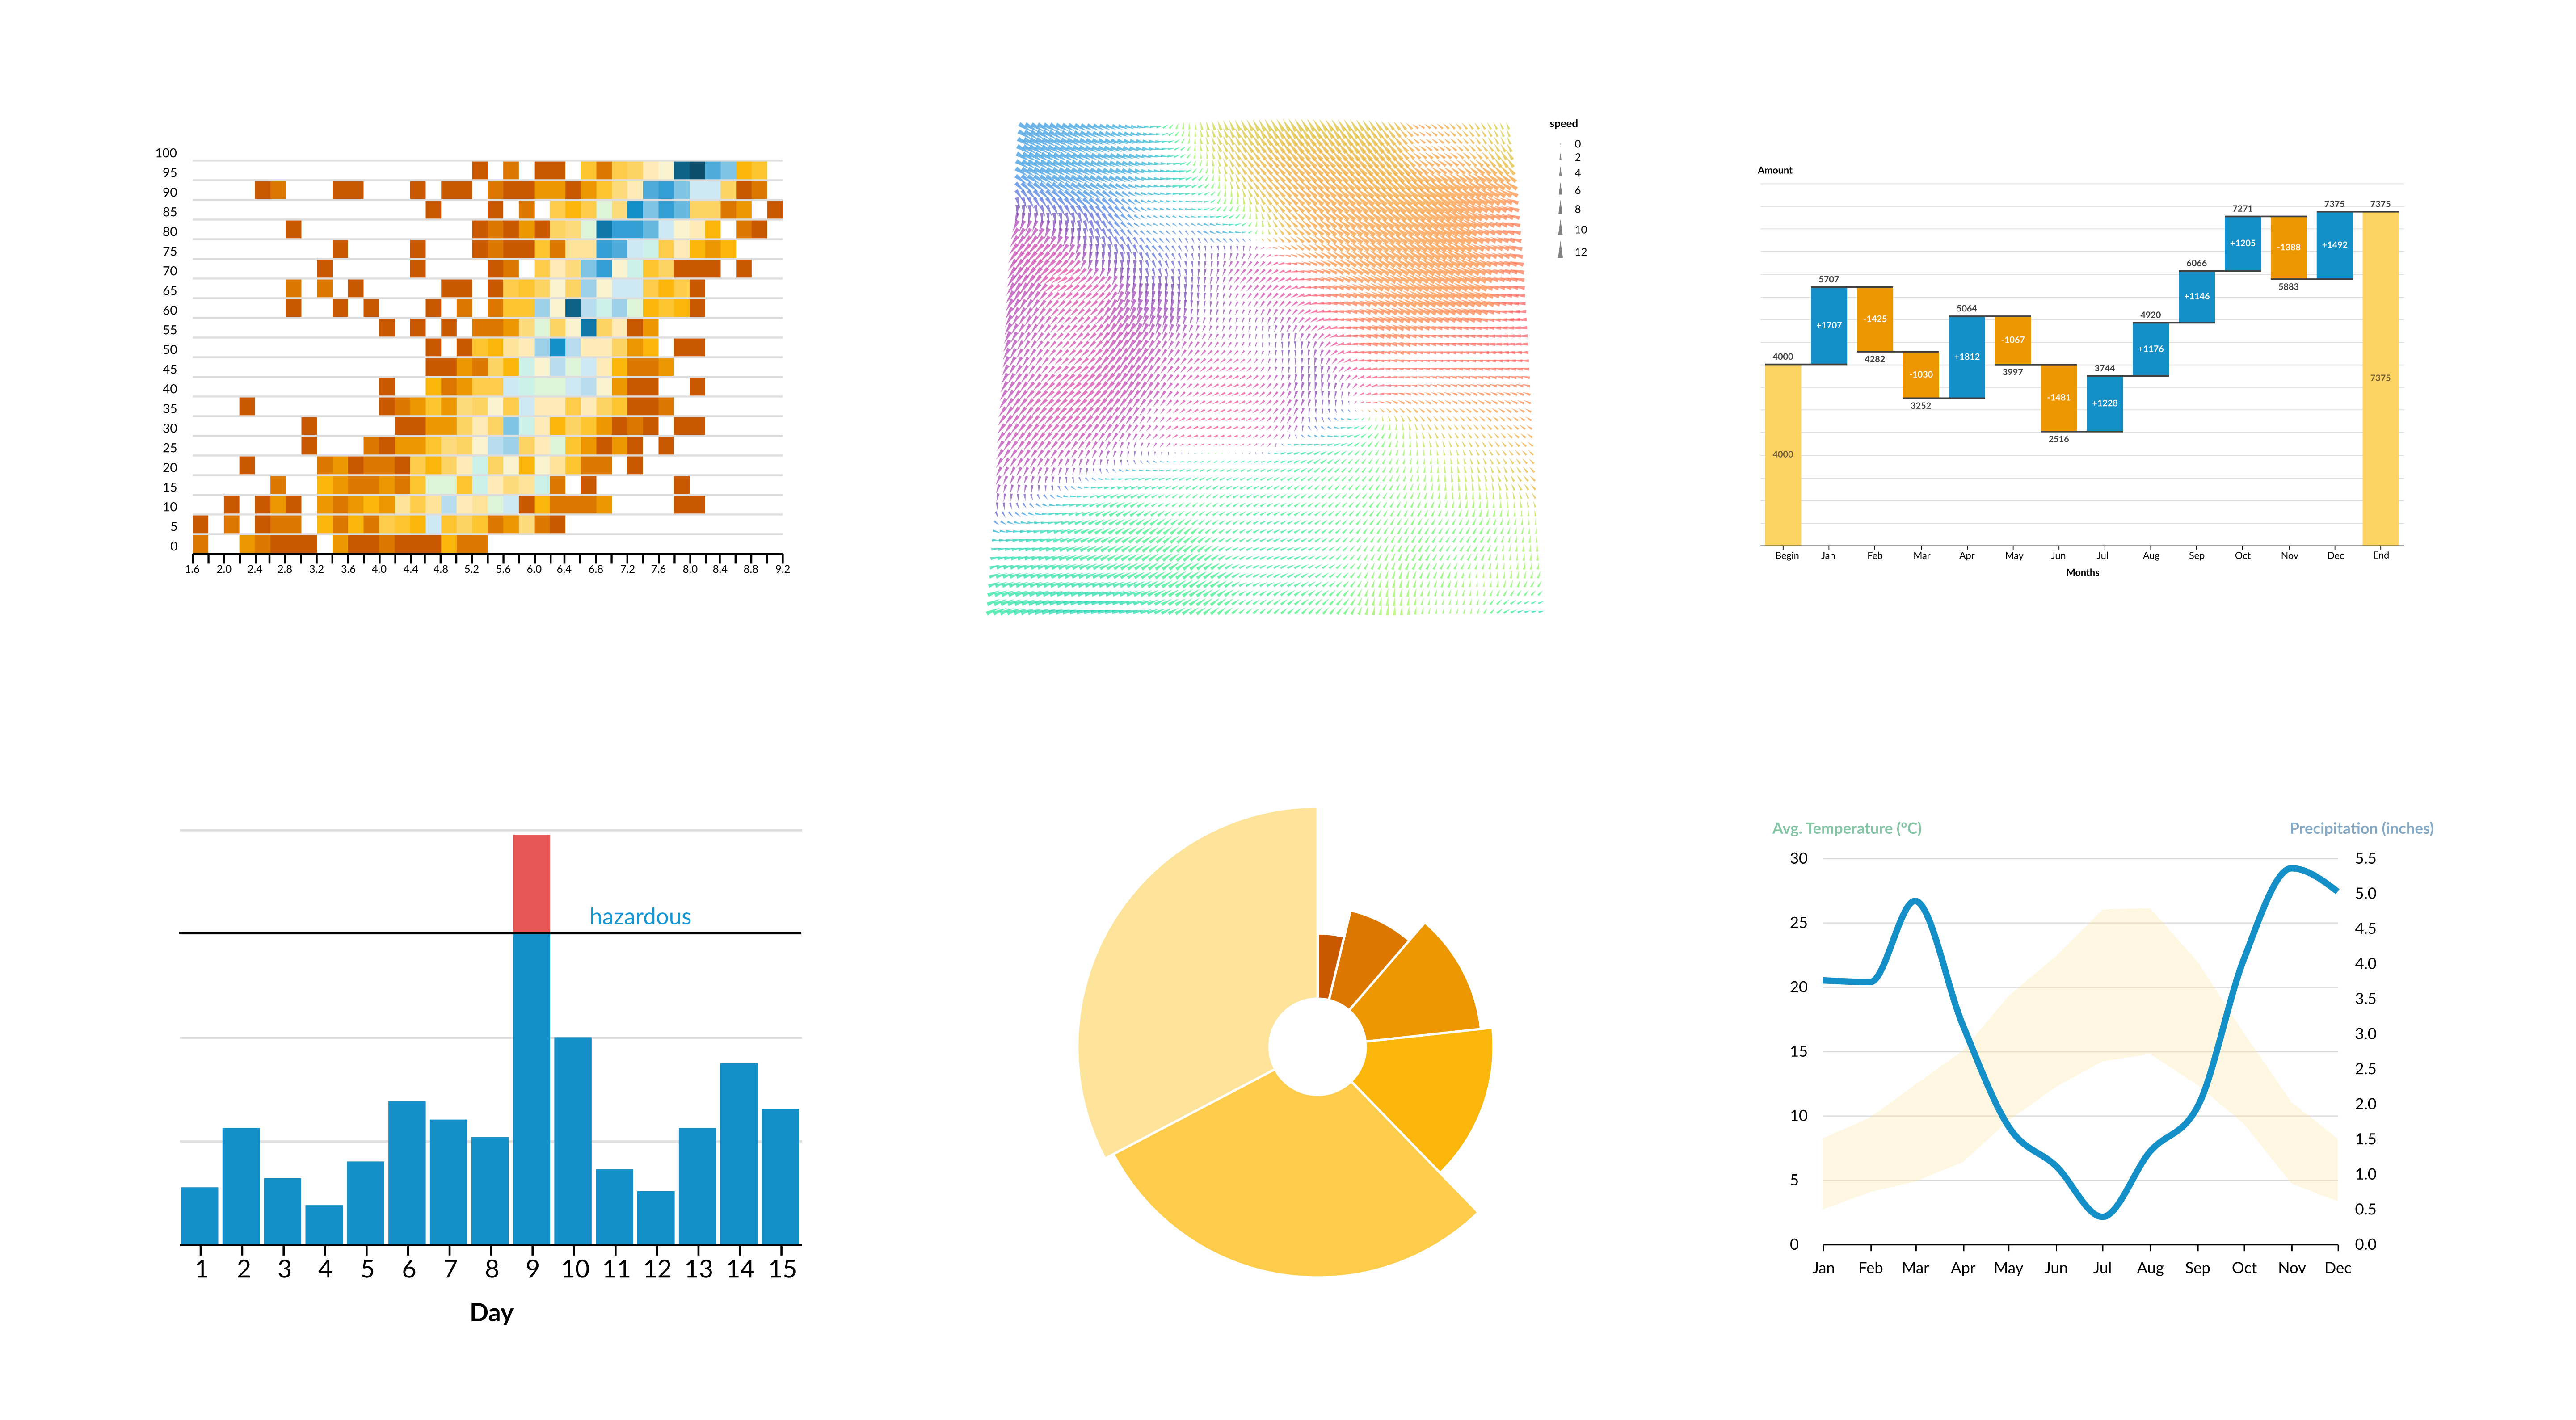
The Vega Chart widget offers more customizability than the standard XY Chart widget, with support for visualizations such as those below, provided by the official Vega-Lite Example Gallery ↗.
Vega data inputs
Vega↗ data is a simple array of structs.
"data": [
  {
    "name": "nba-player-data",
    "values": [
        { "name": "Michael Jordan", "height-in-inches": 78, "weight-in-lbs": 216, ... },
        { "name": "Stephen Curry", "height-in-inches": 74, "weight-in-lbs": 185, ... },
        ...
    ]
  }
]
In Vega-Lite ↗ you can specify multiple datasets in the following way:
"datasets": {
  "nba-player-data": [
    { "name": "Michael Jordan", "height-in-inches": 78, "weight-in-lbs": 216, ... },
    { "name": "Stephen Curry", "height-in-inches": 74, "weight-in-lbs": 185, ... },
    ...
  ],
  "nba-team-data": [
    { "name": "Toronto Raptors", "has-won-championship": true, ... },
    { "name": "Memphis Grizzlies", "has-won-championship": false, ... },
    ...
  ]
}
Data configuration
The Vega Chart widget has three different configuration options which allow you to flexibly transform object data from your Ontology into the expected Vega and Vega-Lite formats, and then inject it into your JSON spec.
-
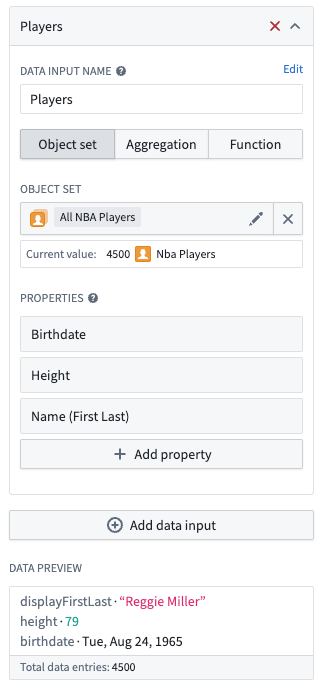
Object set: Specify the object set and properties of that object that should be included in the data.
-
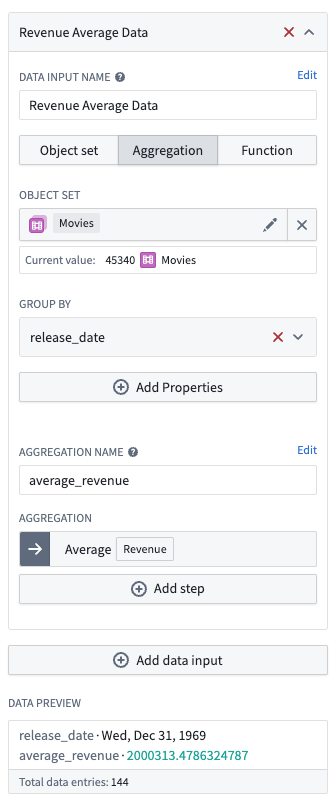
Aggregation: Specify the object set, group by properties with bucketing strategy, and aggregation. Each data point will contain the value of each group by property, as well as the aggregation value keyed by the specified aggregation name.
-
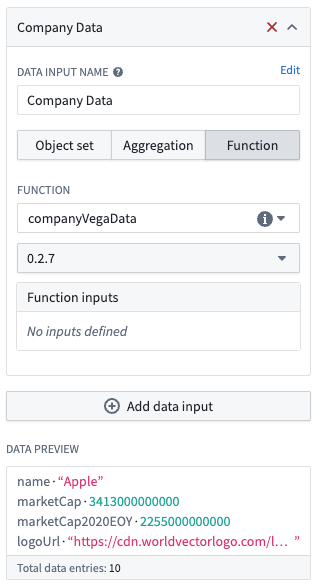
Function: Specify a function that returns a list of structs that will be directly used as the data.
interface CompanyData {
    name: string;
    marketCap: Long;
    logoUrl: string;
}

@Function()
public companyVegaData(): CompanyData[] {...}
You can have multiple data inputs that can be referenced in the specification by their configured names. The data will be automatically injected into the JSON spec, which you can see in the Preview tab of the editor. Note than you can also inline data into the JSON spec by matching the above data formats.
Specification
The spec ↗ is the JSON that defines your visualization; the spec can be specified inline or by using a string variable.
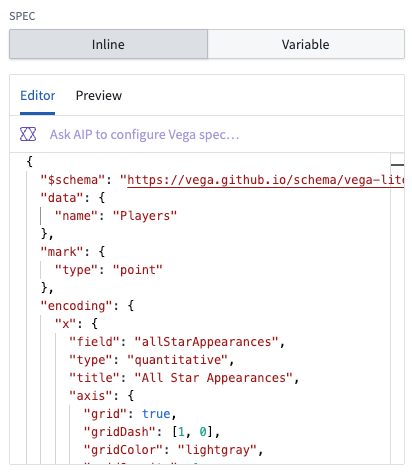
Vega vs. Vega-Lite
The widget allows you to specify whether you want to use Vega-Lite or Vega for your spec.
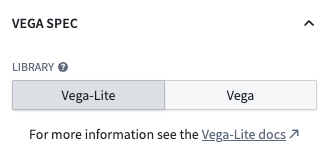
If you are making a common plot, we recommend using Vega-Lite for its more concise grammar, and support for selection parameters. For more complex visualizations, you can use Vega. See the Vega-Lite ↗ and Vega ↗ examples for an idea of what both can support.
Theme configuration
For ease of reusability, you can configure a theme that will be injected into the spec. The default theme matches the Blueprint styling of the XY Charts widget, but you can also specify your own custom theme from a string variable, or turn off the theme entirely.
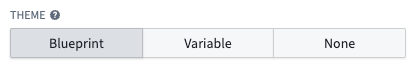
See the vega-themes repository ↗ for examples when building out your own custom themes.
:::callout{theme="neutral"} If you want to modify our default Blueprint theme, you can find the config that is inserted in the Preview Tab of the Inline Editor and paste it directly to your spec with your changes. :::
Inline editor
You can use AIP to create the initial version of your Vega chart. With your given data input, you can provide a prompt to AIP such as:
Make me a bar chart of average points per game, bucketed by the number of seasons played.
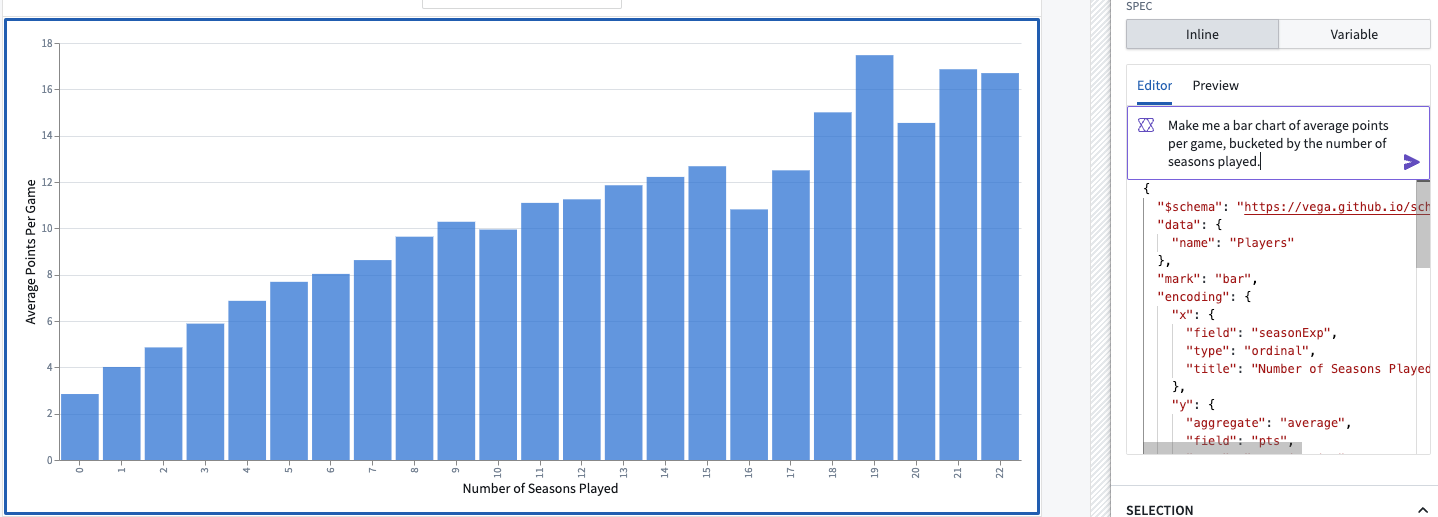
This will create a chart which you can iterate on with additional AIP prompts:
Remove the gridlines from this chart, and only show number of seasons greater than 4.
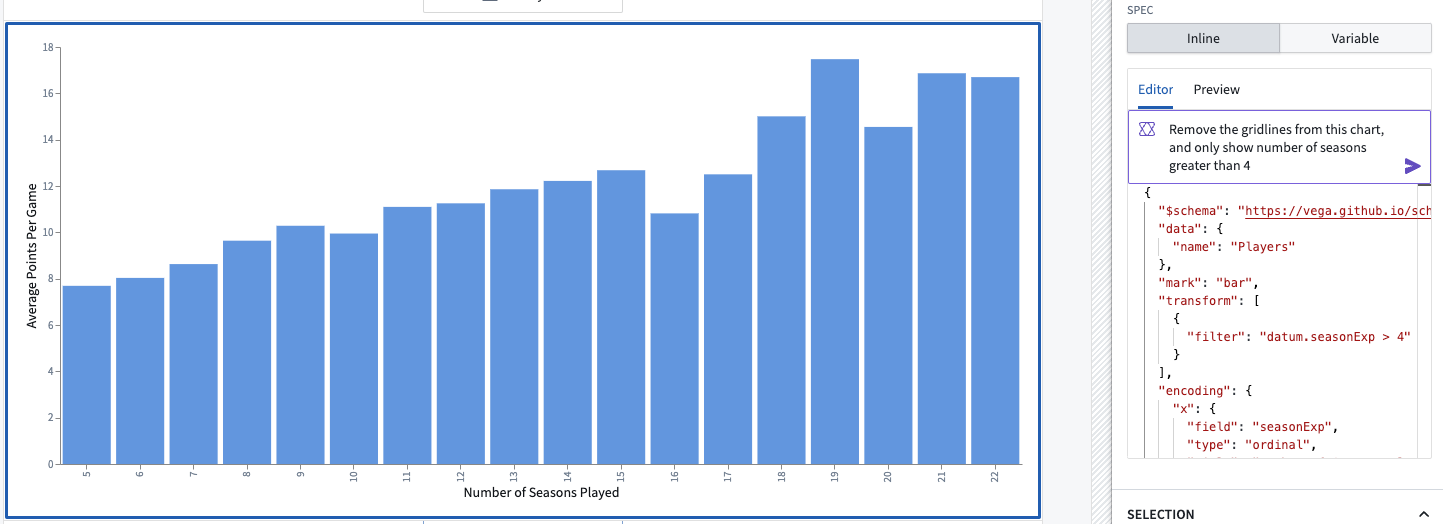
If your AIP prompts do not provide the desired result, you can modify the spec directly. Refer to existing Vega-Lite examples ↗ and other Vega resources for guidance on how to modify the spec: for instance, you can start from an example and replace the example data with a reference to your input data.
Inline editor: Preview
The Preview tab shows the complete spec with your data inputs and theme data injected into it. You are able to truncate the data for readability, and copy this complete spec to the clipboard. This allows your to verify that the data is in the expected format.
:::callout{theme="neutral"} The online Vega Editor ↗ is a valuable tool for debugging your spec. You can move your spec to the editor by copying the JSON to the clipboard in the inline editor Preview tab. There is also the option to truncate your data to limit the scale and more easily replace any sensitive data. :::
Selection Parameters (Vega-Lite Only)
The primary reason that Workshop recommends using the Vega-Lite schema is because Vega-Lite supports selection parameters ↗. In the Vega Chart widget, you can configure multiple selection parameters, each of which has a name and an output variable. The output variable can be either an object set filter or a string.
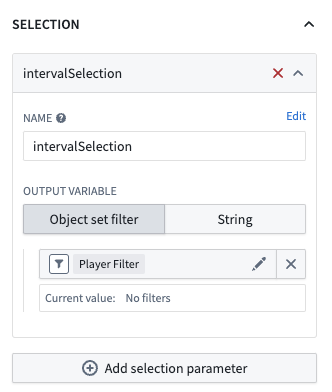
Because selection can be specified in several different places in the spec, this configuration is not auto-injected into the spec. As a builder, you are responsible for including a selection parameter in the spec for each of the configured parameter names.
Here is an example selection parameter that would output range selections on the X-axis:
...
"params": [{
  "name": "intervalSelection",
  "select": {
    "type": "interval",
    "encodings": [ "x" ]
  }
}]
...
:::callout{theme="neutral"}
Not all types of selections can be output to a Object Set Filter. If your data input is an object set with specified properties, or an Aggregation with a group by, this should translate easily, but otherwise you can use the string output variable, which is the selection returned in the JSON format used by Vega-Lite. You can manage this output with a function or variable transform.
:::
中文翻译
Vega 图表(Vega Chart)
Vega 图表(Vega Chart) 组件用于在 Workshop 中使用 Vega 和 Vega-Lite ↗ 语法创建完全可定制且交互式的可视化图表。
什么是 Vega?
Vega 允许您以简洁的 JSON 规范形式创建、保存和共享交互式可视化设计,该规范描述了可视化的外观和行为。 Vega 是构建在 D3 ↗ 之上的高级可视化规范语言,而 Vega-Lite 是构建在 Vega 之上的更高级语言,为编写常见的可视化图表提供了更简洁便捷的方式。
Vega 图表(Vega Chart)组件比标准的 XY 图表(XY Chart)组件 提供了更高的可定制性,支持官方 Vega-Lite 示例库 ↗ 提供的以下可视化类型。
Vega 数据输入(Vega data inputs)
Vega↗ 数据是一个简单的结构体数组。
"data": [
  {
    "name": "nba-player-data",
    "values": [
        { "name": "Michael Jordan", "height-in-inches": 78, "weight-in-lbs": 216, ... },
        { "name": "Stephen Curry", "height-in-inches": 74, "weight-in-lbs": 185, ... },
        ...
    ]
  }
]
在 Vega-Lite ↗ 中,您可以通过以下方式指定多个数据集:
"datasets": {
  "nba-player-data": [
    { "name": "Michael Jordan", "height-in-inches": 78, "weight-in-inches": 216, ... },
    { "name": "Stephen Curry", "height-in-inches": 74, "weight-in-lbs": 185, ... },
    ...
  ],
  "nba-team-data": [
    { "name": "Toronto Raptors", "has-won-championship": true, ... },
    { "name": "Memphis Grizzlies", "has-won-championship": false, ... },
    ...
  ]
}
数据配置(Data configuration)
Vega 图表(Vega Chart)组件提供了三种不同的配置选项,使您能够灵活地将本体论(Ontology)中的对象数据转换为预期的 Vega 和 Vega-Lite 格式,然后将其注入到您的 JSON 规范中。
-
对象集(Object set): 指定应包含在数据中的对象集及其属性。
-
聚合(Aggregation): 指定对象集、分组属性及分桶策略,以及聚合方式。每个数据点将包含每个分组属性的值,以及以指定聚合名称作为键的聚合值。
-
函数(Function): 指定一个返回结构体列表的函数,该列表将直接用作数据。
interface CompanyData {
    name: string;
    marketCap: Long;
    logoUrl: string;
}

@Function()
public companyVegaData(): CompanyData[] {...}
您可以拥有多个数据输入,这些输入可以通过其配置的名称在规范中引用。数据将自动注入到 JSON 规范中,您可以在编辑器的预览(Preview)选项卡中查看。请注意,您也可以通过匹配上述数据格式将数据内联到 JSON 规范中。
规范(Specification)
规范 ↗ 是定义可视化的 JSON;该规范可以内联指定,也可以使用字符串变量指定。
Vega 与 Vega-Lite 对比
该组件允许您指定是使用 Vega-Lite 还是 Vega 来编写规范。
如果您正在制作常见的图表,我们建议使用 Vega-Lite,因为它语法更简洁,并且支持选择参数(selection parameters)。对于更复杂的可视化,您可以使用 Vega。请参阅 Vega-Lite ↗ 和 Vega ↗ 示例,了解两者各自支持的功能。
主题配置(Theme configuration)
为了便于复用,您可以配置一个主题,该主题将被注入到规范中。默认主题与 XY 图表(XY Charts)组件的 Blueprint 样式相匹配,但您也可以从字符串变量指定自己的自定义主题,或者完全关闭主题。
在构建您自己的自定义主题时,请参阅 vega-themes 仓库 ↗ 获取示例。
:::callout{theme="neutral"} 如果您想修改我们的默认 Blueprint 主题,您可以在内联编辑器的预览(Preview)选项卡中找到插入的配置,并将其直接粘贴到您的规范中并进行修改。 :::
内联编辑器(Inline editor)
您可以使用 AIP 创建 Vega 图表的初始版本。在给定数据输入的情况下,您可以向 AIP 提供如下提示:
Make me a bar chart of average points per game, bucketed by the number of seasons played.
这将创建一个图表,您可以通过额外的 AIP 提示对其进行迭代:
Remove the gridlines from this chart, and only show number of seasons greater than 4.
如果您的 AIP 提示未能提供所需结果,您可以直接修改规范。请参考现有的 Vega-Lite 示例 ↗ 和其他 Vega 资源,了解如何修改规范:例如,您可以从一个示例开始,然后将示例数据替换为对您输入数据的引用。
内联编辑器:预览(Preview)
预览(Preview) 选项卡显示完整的规范,其中已注入您的数据输入和主题数据。您可以截断数据以提高可读性,并将此完整规范复制到剪贴板。这使您可以验证数据是否符合预期格式。
:::callout{theme="neutral"} 在线 Vega 编辑器 ↗ 是调试规范的宝贵工具。您可以通过在内联编辑器的预览(Preview)选项卡中将 JSON 复制到剪贴板,将规范移至该编辑器。还可以选择截断数据以限制规模,并更轻松地替换任何敏感数据。 :::
选择参数(Selection Parameters)(仅限 Vega-Lite)
Workshop 推荐使用 Vega-Lite 模式的主要原因在于 Vega-Lite 支持选择参数(selection parameters) ↗。在 Vega 图表(Vega Chart)组件中,您可以配置多个选择参数,每个参数都有一个名称和一个输出变量。输出变量可以是对象集过滤器(object set filter)或字符串。
由于选择可以在规范中的多个不同位置指定,因此此配置不会自动注入到规范中。作为构建者,您有责任为每个配置的参数名称在规范中包含一个选择参数。
以下是一个选择参数示例,它将输出 X 轴上的范围选择:
...
"params": [{
  "name": "intervalSelection",
  "select": {
    "type": "interval",
    "encodings": [ "x" ]
  }
}]
...
:::callout{theme="neutral"}
并非所有类型的选择都能输出到对象集过滤器(Object Set Filter)。如果您的数据输入是指定了属性的对象集,或者是带有 group by 的聚合,那么这应该很容易转换,否则您可以使用字符串输出变量,该变量是 Vega-Lite 使用的 JSON 格式返回的选择。您可以使用函数或变量转换来管理此输出。
:::