Debug applications(调试应用程序)
Slate applications may become very complex, with hundreds of widgets, functions, queries, and events creating a web of dependencies. Performance issues with a Slate application are often first encountered in the user interface, such as a table missing the expected data or a button failing to produce the expected response. However, the root cause for these issues may be located somewhere in the backend.
The Slate health check dialog and the debugger facilitate error investigation and resolution preventing outdated or inaccurate data in widgets.
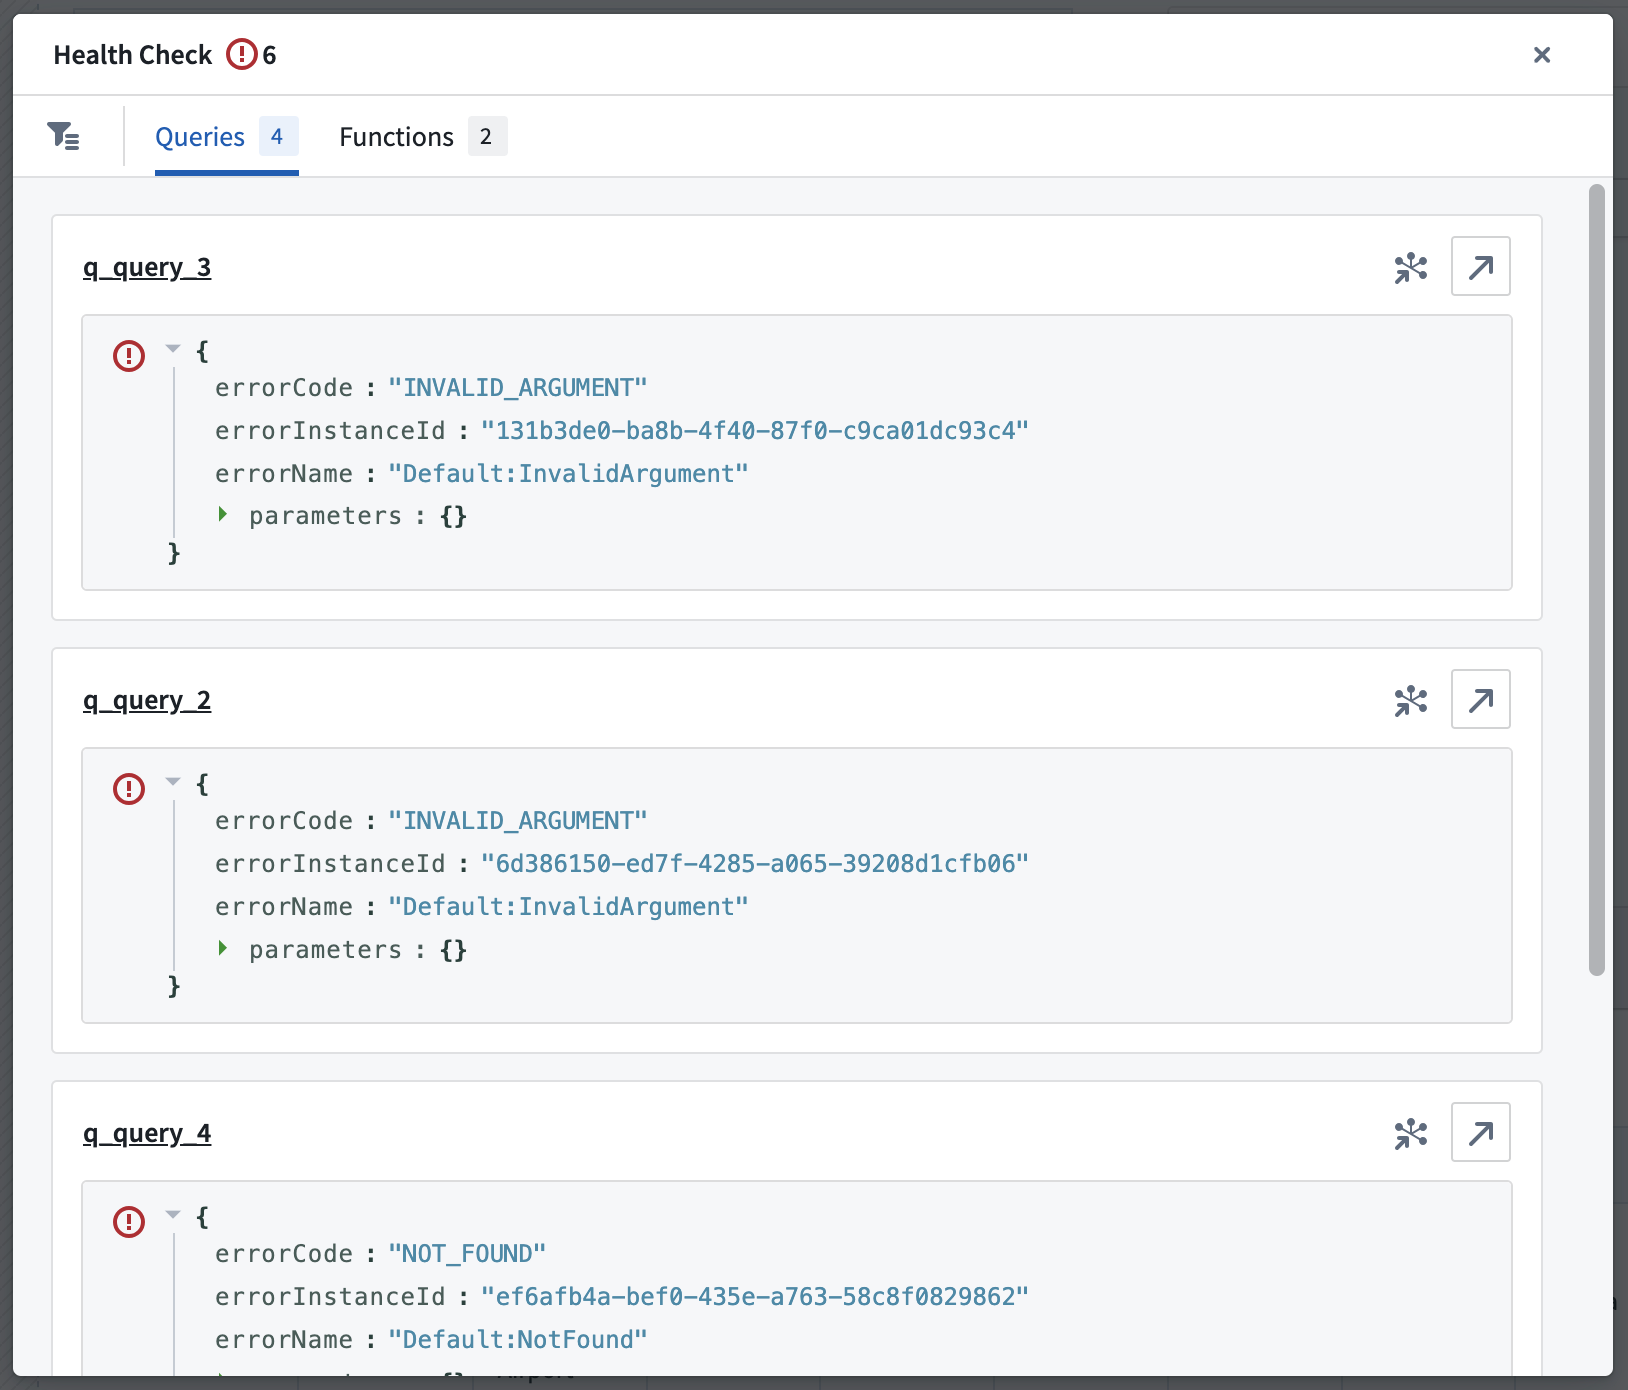
The health check dialog allows application builders to quickly identify and resolve failed queries and functions by consolidating all errors and warnings in a single view.
The debugger enables application testing using breakpoints and makes it easier to discover and address issues across Slate application components. This also helps application builders understand the downstream implications of changes on other application components.
Health check dialog
When a Slate application is opened in edit mode, Slate automatically checks for a successful runtime of all queries and functions upon loading. However, users should note that queries with conditions may not run if the conditions are unmet in the default application state.
Any errors or warnings encountered will appear in the action bar located atop the page.
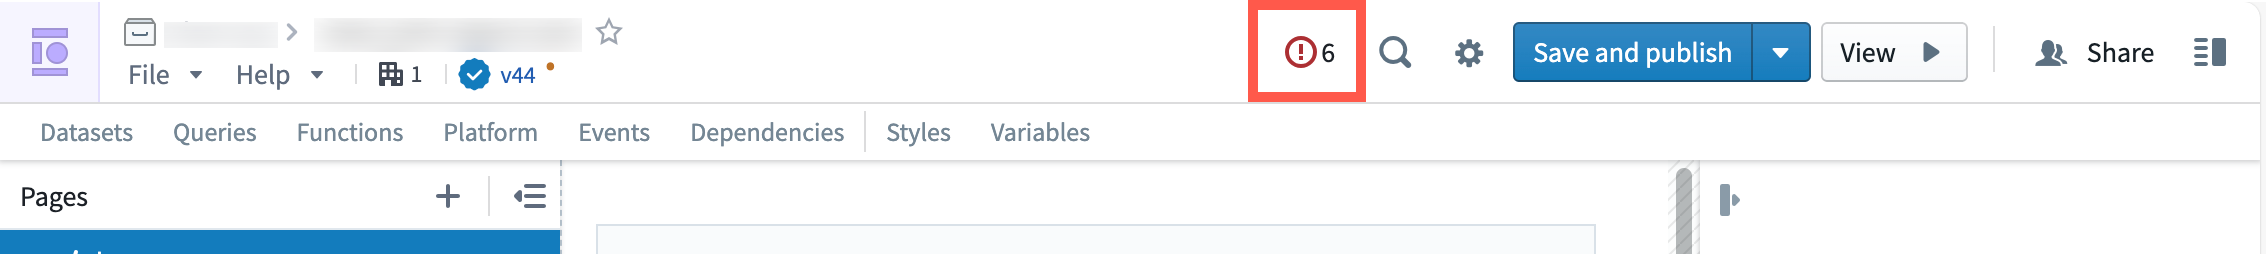
Select the issues icon to open the health check dialog. From here, jump directly to the query or function raising the issue either on the canvas or in the dependency graph view.
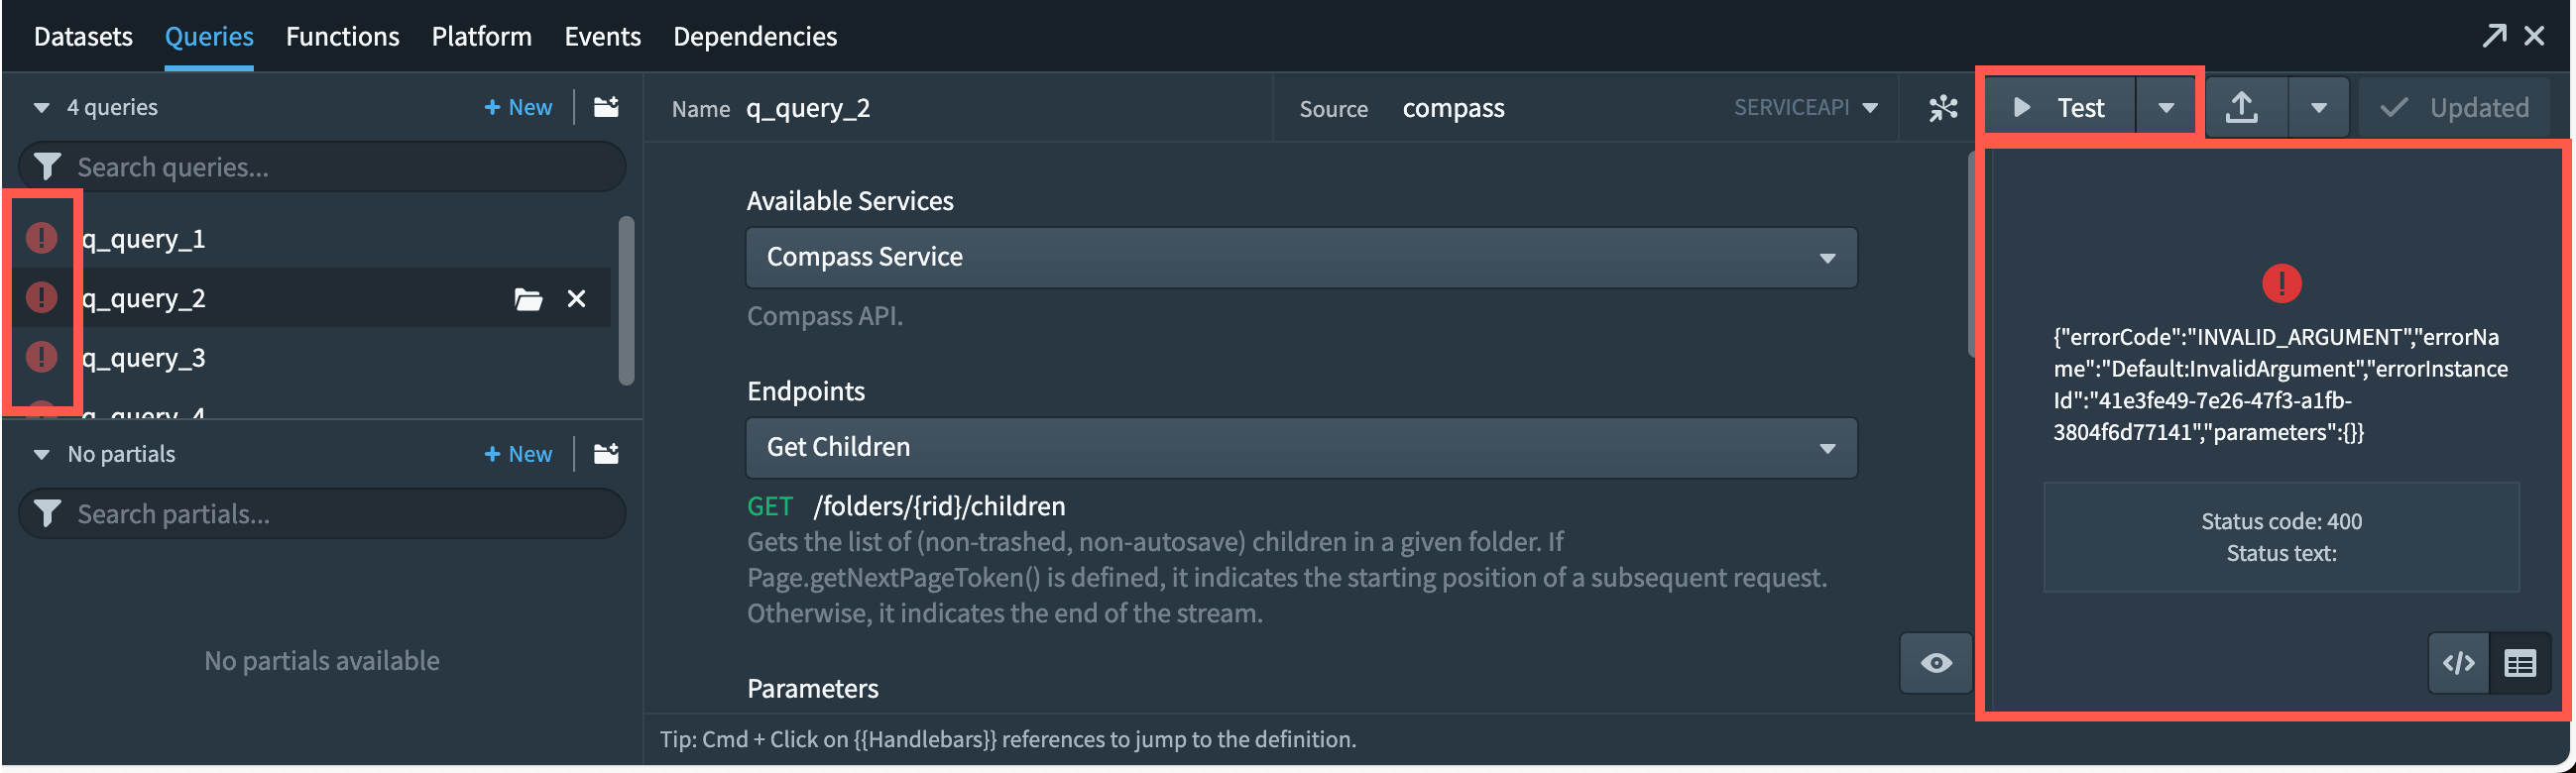
Errors are also visible in the queries or the functions panels. The queries panel will highlight all failed queries. Select Test to run the query and see the detailed error.
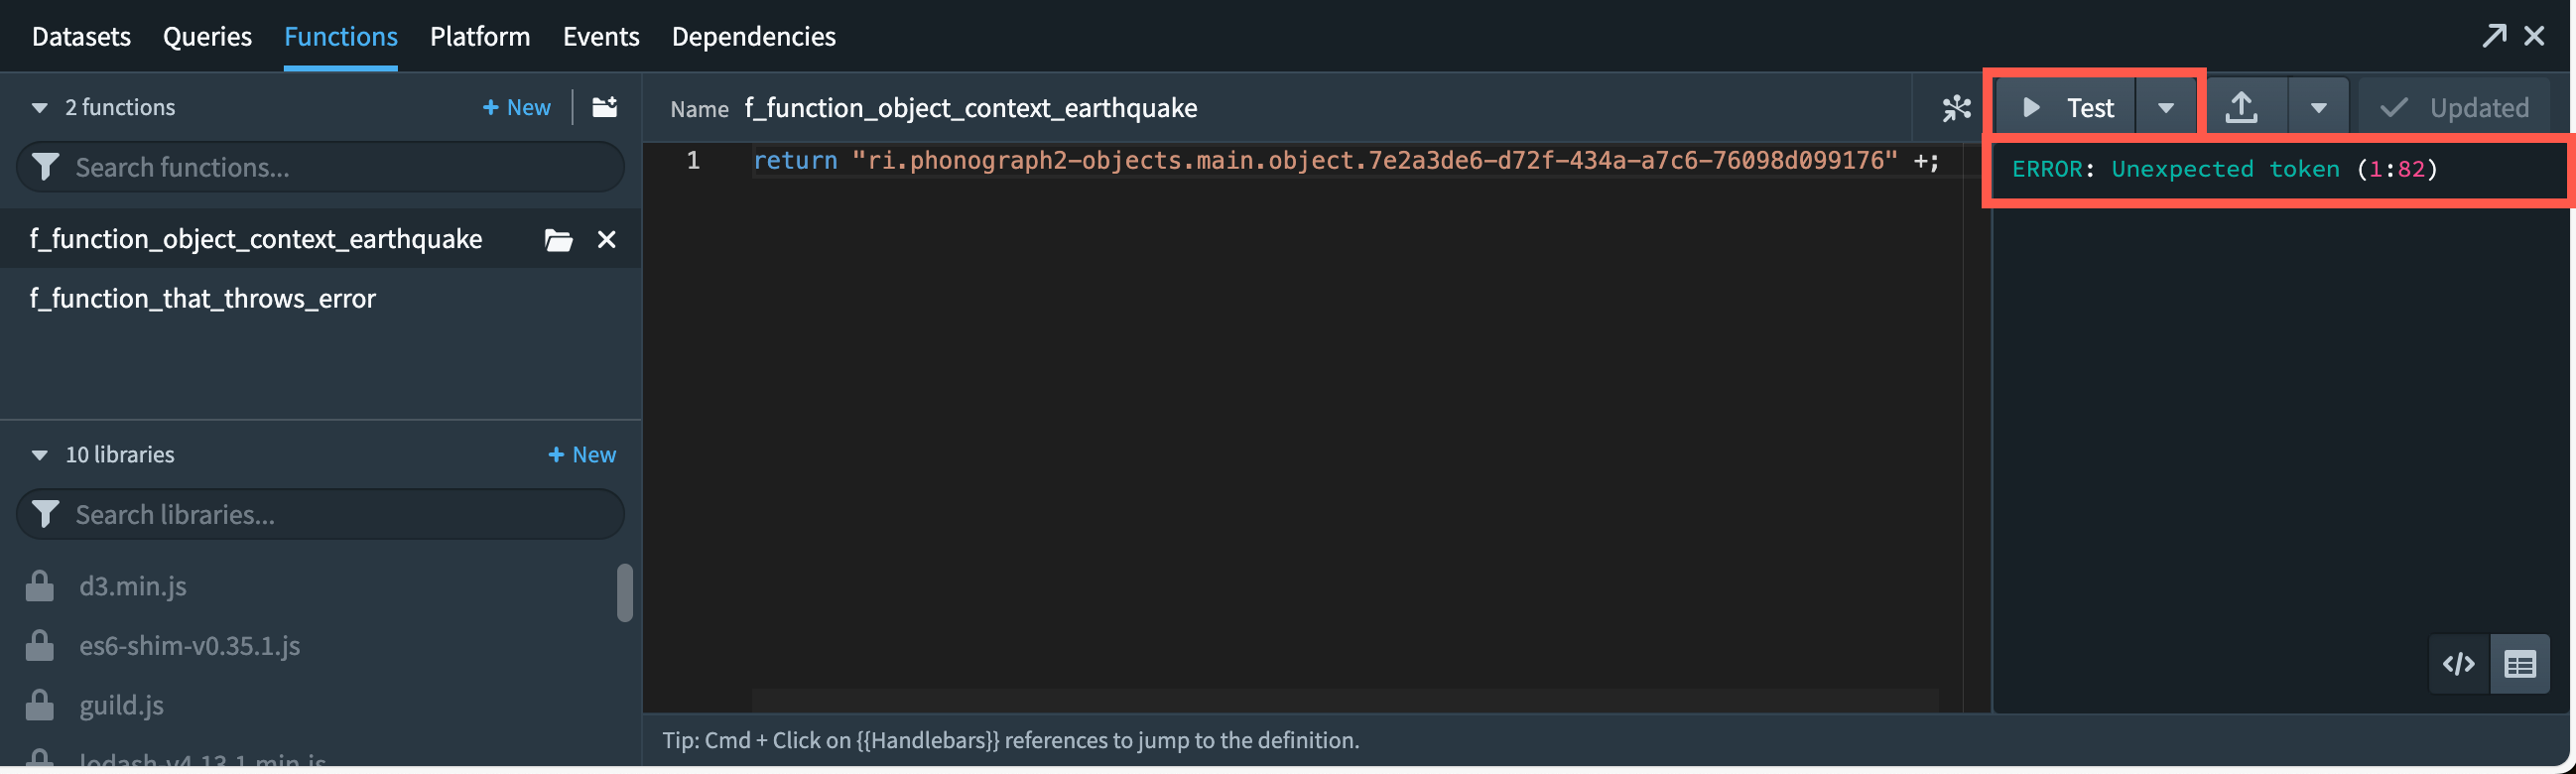
The functions panel will not highlight all failed functions. To run a function, select Test. In the case of failure, this will display a detailed error message for further analysis.
Debugger
The Slate debugger simplifies the process of investigating errors while providing all relevant information in a single view.
Enable debugger
To enable or disable the debugger, toggle on the Debugger in the top-right corner of the dependencies tab.
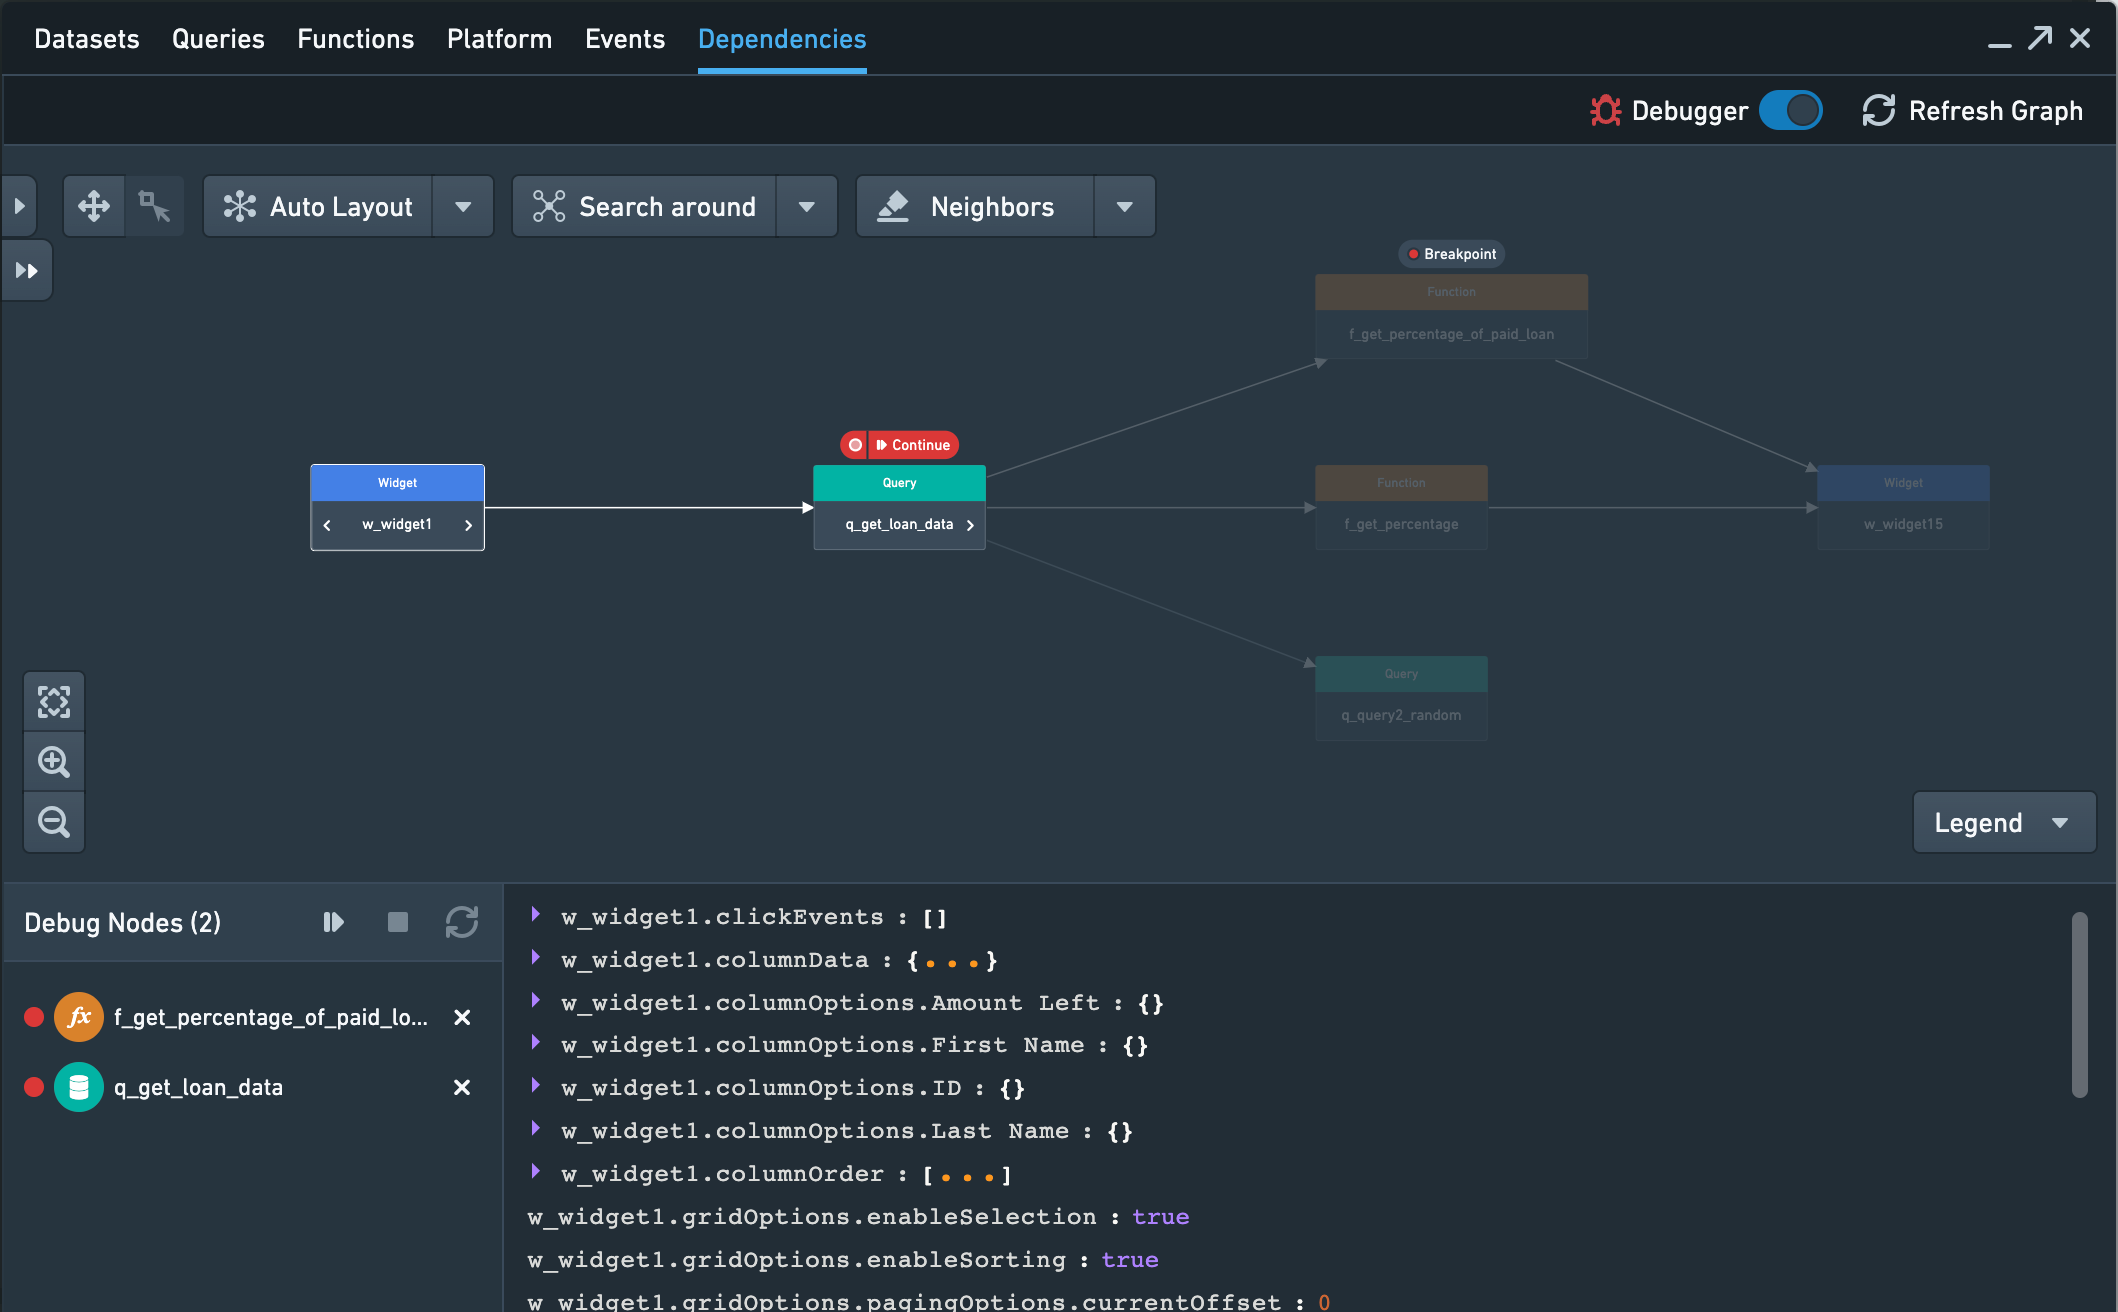
Enabling the debugger adds a variety of new functionalities to the graph. A new bottom drawer becomes available; on the left side of the drawer, you can see all nodes which currently have breakpoints set. From this drawer, you can run and refresh an application. The right side of the drawer gives a preview of current values of a selected node.
Set a breakpoint
A breakpoint can be set on any component once the component has been added to the graph. To add a breakpoint, hover over the node on the graph and select Breakpoint which will appear above the node. Once a breakpoint has been set, an entry will be visible in the bottom drawer for the node.
When running or refreshing the application, execution will pause before the node with the breakpoint is executed.
Run and refresh nodes
When debugging, you might have to rerun a chain of nodes or components at some point. Nodes can be rerun via different methods. In the debugger, you can select the play button on any node, which executes all nodes starting with the selected one and stops upon reaching the next breakpoint.
You can also refresh the entire application by clicking on the refresh button in the bottom drawer. Refreshing the application will re-trigger all the events without having to reload the page.
Finally, you can trigger nodes manually by performing an action in the Slate application itself. Running a query or selecting a button in the application interface will act like running a node manually in the debugger.
中文翻译
调试应用程序
Slate 应用程序可能变得非常复杂,包含数百个微件(widget)、函数(function)、查询(query)和事件(event),形成一张依赖关系网。Slate 应用程序的性能问题通常首先在用户界面中显现,例如表格缺少预期数据,或按钮未能产生预期响应。然而,这些问题的根本原因可能位于后端的某个位置。
Slate 的健康检查对话框和调试器有助于错误调查和解决,防止微件中出现过时或不准确的数据。
健康检查对话框允许应用程序构建者将所有错误和警告整合到单一视图中,从而快速识别并解决失败的查询和函数。
调试器支持使用断点进行应用程序测试,使发现和解决 Slate 应用程序组件中的问题变得更加容易。这也有助于应用程序构建者理解更改对其他应用程序组件的下游影响。
健康检查对话框
当 Slate 应用程序在编辑模式下打开时,Slate 会在加载时自动检查所有查询和函数是否成功运行。但用户应注意,如果默认应用程序状态中条件未满足,带有条件的查询可能不会运行。
遇到的任何错误或警告将显示在页面顶部的操作栏中。
选择问题图标以打开健康检查对话框。在此处,可以直接跳转到在画布或依赖关系图视图中引发问题的查询或函数。
错误也可见于查询或函数面板中。查询面板将高亮显示所有失败的查询。选择测试以运行查询并查看详细错误。
函数面板不会高亮显示所有失败的函数。要运行函数,请选择测试。如果失败,将显示详细的错误消息以供进一步分析。
调试器
Slate 调试器简化了错误调查过程,同时将所有相关信息整合到单一视图中。
启用调试器
要启用或禁用调试器,请切换依赖关系选项卡右上角的调试器开关。
启用调试器会为图形添加多种新功能。底部会出现一个新的抽屉;在抽屉左侧,您可以查看所有当前已设置断点的节点。通过此抽屉,您可以运行和刷新应用程序。抽屉右侧提供所选节点当前值的预览。
设置断点
一旦组件被添加到图形中,就可以在其上设置断点。要添加断点,请将鼠标悬停在图形中的节点上,然后选择节点上方出现的断点。设置断点后,该节点的条目将出现在底部抽屉中。
在运行或刷新应用程序时,执行将在执行带有断点的节点之前暂停。
运行和刷新节点
调试时,您可能需要在某个时刻重新运行一系列节点或组件。节点可以通过不同方法重新运行。在调试器中,您可以选择任意节点上的播放按钮,该操作将从所选节点开始执行所有节点,并在遇到下一个断点时停止。
您还可以通过单击底部抽屉中的刷新按钮来刷新整个应用程序。刷新应用程序将重新触发所有事件,而无需重新加载页面。
最后,您可以通过在 Slate 应用程序本身中执行操作来手动触发节点。在应用程序界面中运行查询或选择按钮,其效果类似于在调试器中手动运行节点。