View application dependencies(查看应用依赖关系)
The Dependencies viewer lets you see how elements in your application are related, including widgets, queries, functions, and variables.
Your application is displayed as a graph, with elements as nodes and dependencies as directed edges. The dependency graph does not include information about Function libraries and styles.
To add an element to the graph, tick or double-click the checkbox next to the entry in the list. Once an element is added to the graph, its dependencies can be explored by clicking the chevrons on the right or the left of the element. If no chevron is displayed, there are no elements for the graph to expand.
Use the graph icon displayed in the top right of every element in the graph when hovering over it to navigate to the element, allowing for an easy way to investigate the element in more detail. Select a node or an item in the list to highlight other elements that element depends on (or vice versa).
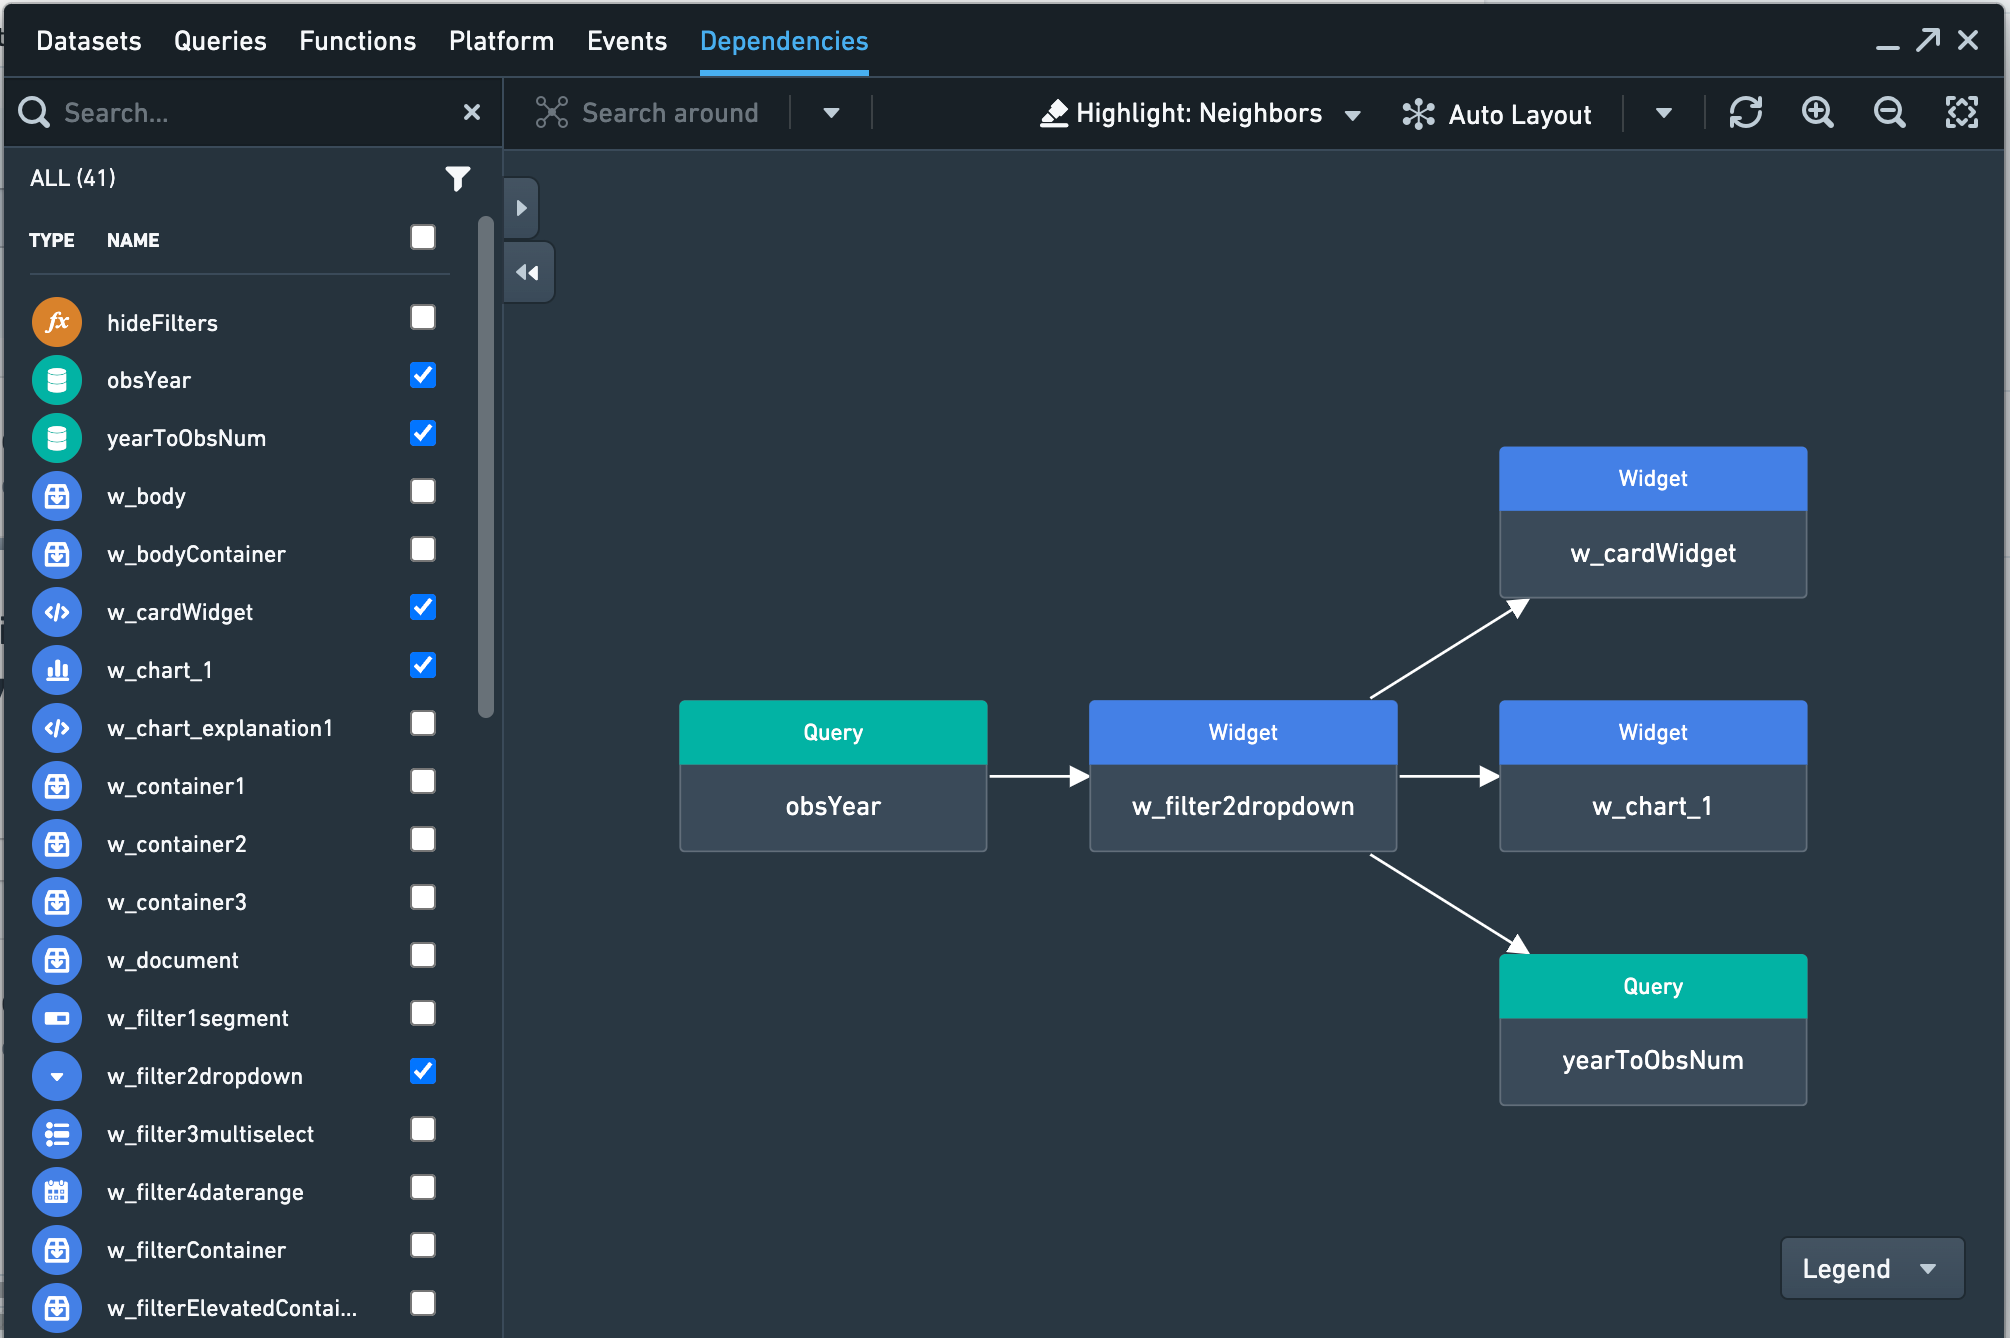
For example, in the screenshot below, the Dropdown widget named w_filter2dropdown depends on data from a query obsYear. The value selected in that dropdown in turn feeds two other widgets and a query.
You can configure which related nodes are highlighted with the Highlight dropdown. Choose from:
- Selected only: Highlight the selected node.
- Neighbors: Highlight the selected node as well as nodes with an immediate dependency on the selected node (either upstream or downstream).
- Upstream: Highlight the selected node as well as all nodes “upstream” of the selected node (nodes on which the selected node depends, and upwards in the chain of dependencies).
- Downstream: Highlight the selected node as well as all nodes “downstream” of the selected node (nodes that depend on the selected node, and downwards in the chain of dependencies).
The nodes are arranged automatically, but you can click-and-drag nodes to rearrange them on the graph. You can also use the Hierarchy layout button with Upstream or Downstream highlights to see the selected node and its upstream or downstream dependencies as a hierarchy. Select the Restore auto layout button to exit the hierarchy layout.
Use the Refresh button to update the graph if you make changes to your application while the panel is open.
Performance Statistics
You can expand the Dependencies Viewer table to see additional columns with performance data. This data can help you identify which parts of a Slate application might be slow.
- Time in node shows the amount of time spend processing that node. Only applies to queries and functions. For queries, this includes time on the server, latency between the Slate server and the browser, and queueing the request. (Queueing might occur if there are too many queries to run concurrently. For example, the Chrome browser lets you run six queries concurrently, so a seventh query would be queued until another query finishes.) For functions, this includes setup and computation time.
- Server time only applies to queries, and shows the amount of time between when the Slate server receives the request and when the server sends the response back to the browser after retrieving data from the data source.
- Load time for a given node is the amount of time between when the first node of the application begins calculation and when the given node finishes calculation.
中文翻译
查看应用依赖关系
依赖关系查看器可让您了解应用中各元素(包括组件、查询、函数和变量)之间的关联方式。
您的应用以图形形式展示,元素作为节点,依赖关系作为有向边。依赖关系图不包含函数库和样式的信息。
要向图形中添加元素,请勾选或双击列表中条目旁的复选框。元素添加到图形后,可通过点击元素左侧或右侧的箭头来探索其依赖关系。如果未显示箭头,则表示没有可供图形展开的元素。
将鼠标悬停在图形中任意元素上时,点击元素右上角显示的图形图标即可导航至该元素,从而方便您更详细地查看该元素。选中某个节点或列表中的项目,可高亮显示该元素所依赖的其他元素(反之亦然)。
例如,在下方截图中,名为 w_filter2dropdown 的下拉组件依赖于查询 obsYear 的数据。该下拉菜单中选中的值又会传递给另外两个组件和一个查询。
您可以通过高亮下拉菜单配置高亮显示哪些相关节点。可选选项包括:
- 仅选中项: 高亮显示选中的节点。
- 相邻节点: 高亮显示选中的节点以及与该节点有直接依赖关系的节点(上游或下游)。
- 上游: 高亮显示选中的节点以及该节点所有"上游"节点(该节点所依赖的节点,以及依赖链中更上游的节点)。
- 下游: 高亮显示选中的节点以及该节点所有"下游"节点(依赖该节点的节点,以及依赖链中更下游的节点)。
节点会自动排列,但您也可以点击并拖动节点来重新排列图形。您还可以使用层次布局按钮配合上游或下游高亮,以层次结构查看选中节点及其上游或下游依赖关系。选择恢复自动布局按钮可退出层次布局。
如果在面板打开时对应用进行了更改,请使用刷新按钮更新图形。
性能统计
您可以展开依赖关系查看器表格,查看包含性能数据的额外列。这些数据有助于识别 Slate 应用中可能运行缓慢的部分。
- 节点耗时 显示处理该节点所花费的时间。仅适用于查询和函数。对于查询,这包括服务器端时间、Slate 服务器与浏览器之间的延迟以及请求排队时间。(如果同时运行的查询过多,可能会发生排队。例如,Chrome 浏览器允许同时运行六个查询,因此第七个查询将排队等待,直到其他查询完成。)对于函数,这包括设置和计算时间。
- 服务器时间 仅适用于查询,显示从 Slate 服务器收到请求到服务器从数据源检索数据后将响应发送回浏览器之间的时间。
- 加载时间 对于给定节点,是指从应用中第一个节点开始计算到该节点完成计算之间的时间。