Diagrams(图表(Diagrams))
This section provides a summary of the Solution Designer graph functionality and the various configurations you can apply to your diagrams.
Canvas
The canvas is where your diagram is built as you add nodes and create node groups. The following tools are useful for navigating the canvas.
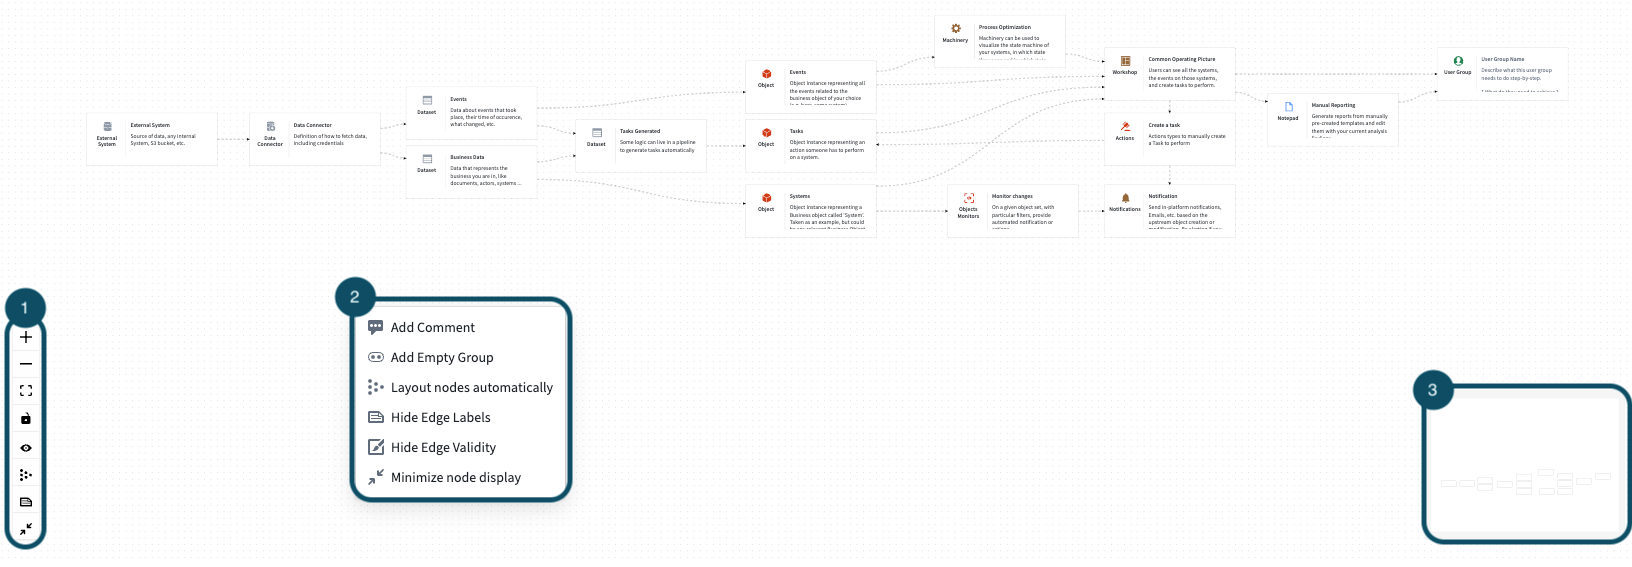
- Canvas toolbar
- Zoom in
- Zoom out
- Center diagram
- Lock diagram: Prevent unwanted changes
- Show/hide background dots
- Layout nodes automatically: Arranges nodes in a structured (grid-like) manner
- Show/hide edge labels
- Expand/collapse nodes
- Canvas menu: Right-click on the canvas to open the menu
- Add comment
- Add empty group: Add an empty node that supports nested graphs
- Layout nodes automatically: Arranges nodes in a structured (grid-like) manner
- Show/hide edge labels: Control text visibility of text labels on edges
- Hide edge validity: Ignore incorrect component connections
- Expand/collapse nodes
- Mini-map: Provides a preview of your current location on the canvas
Nodes
The nodes on your canvas represent resources and applications available across the Palantir platform. Use the following tools to configure, contextualize, and connect your nodes across your diagram.
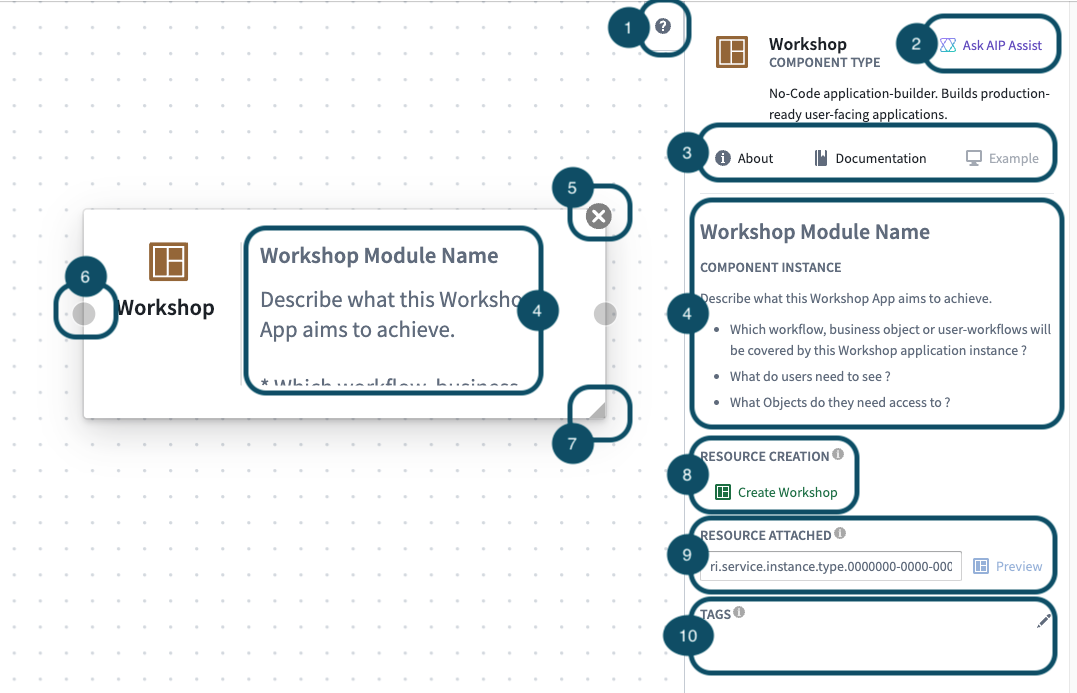
- Configuration panel toggle: Expand or collapse the node configuration panel.
- Ask AIP Assist: Prompt AIP Assist to explain a platform component.
- Component information
- About: A short description of the node and its intended use.
- Documentation: Link to relevant documentation.
- Example: Provides a preview for how the node can be used.
- Title and node description
- Delete node (displays on hover)
- Node connectivity (displays on hover): Drag from here to connect nodes.
- Resize node (displays on hover)
- Create/redirect to a relevant part of the platform
- Associate an RID with the resource.
- Add relevant tags by selecting the pencil icon
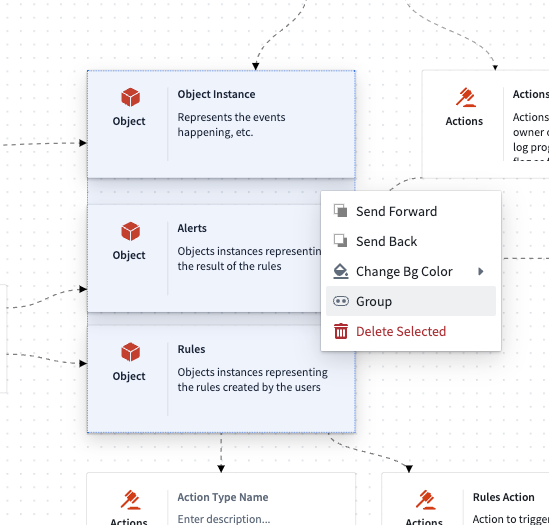
Context menu node actions
- Send forward: Bring node to front by one index
- Send back: Send node to back by one index
- Change Bg color: Change node color
- Group: Create single group
- Delete node
Abstract nodes [Beta]
:::callout{theme="neutral" title="Beta"} Abstract nodes are in the beta phase of development and may not be available on your enrollment. Functionality may change during active development. :::
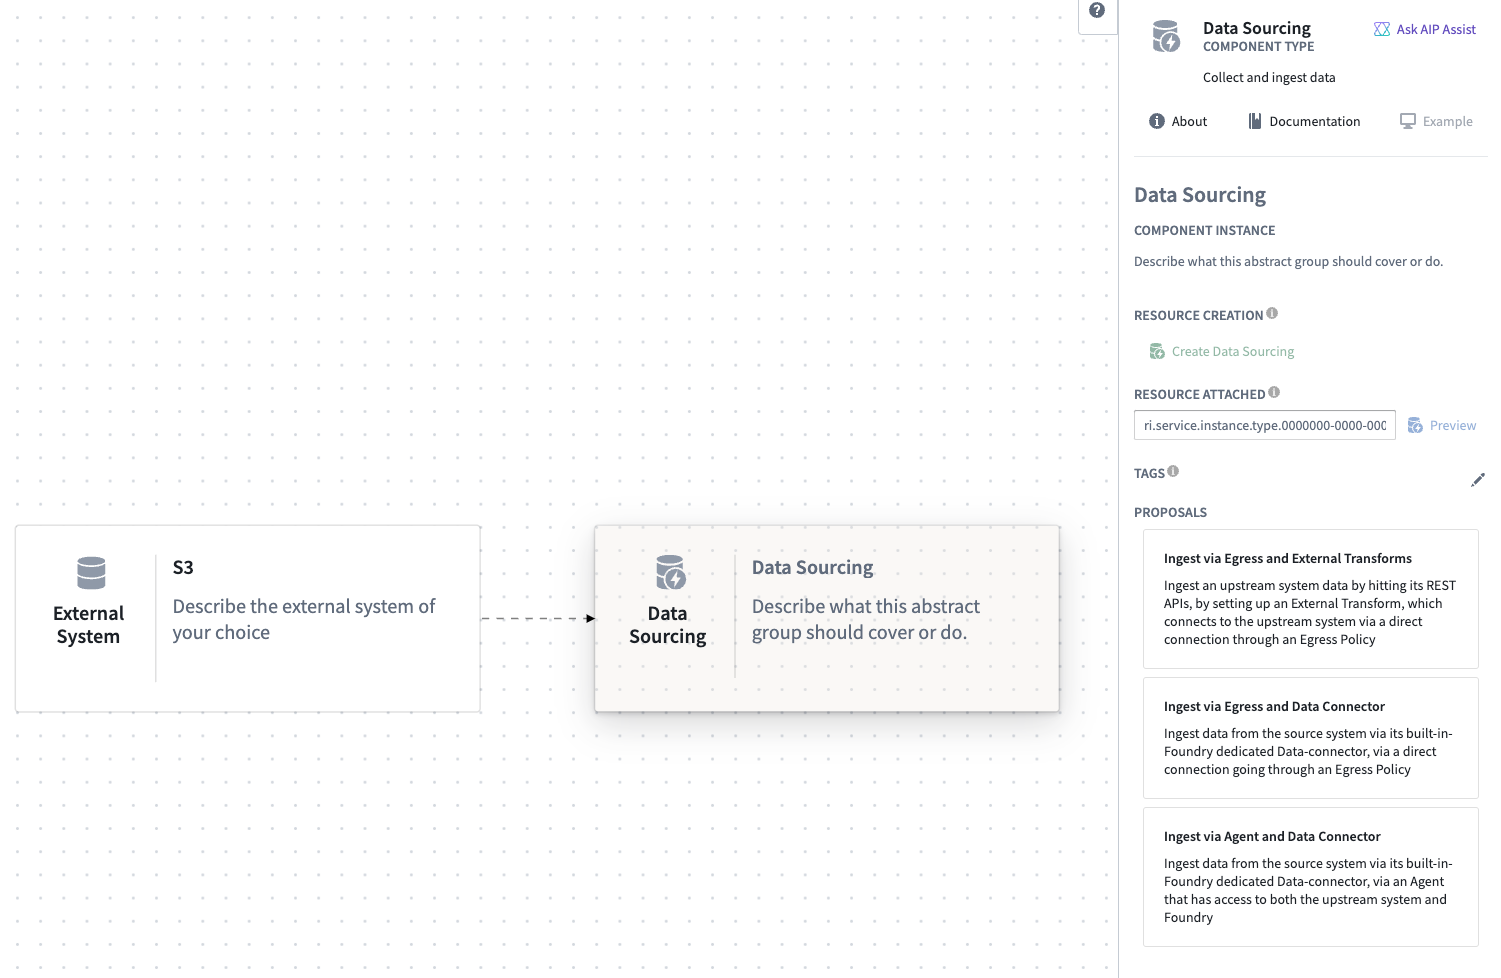
Abstract nodes function similarly to normal nodes. However, once connected, they generate suggestions based on the connected input and output nodes. You can choose from the suggested options to replace the abstract node with an appropriate selection.
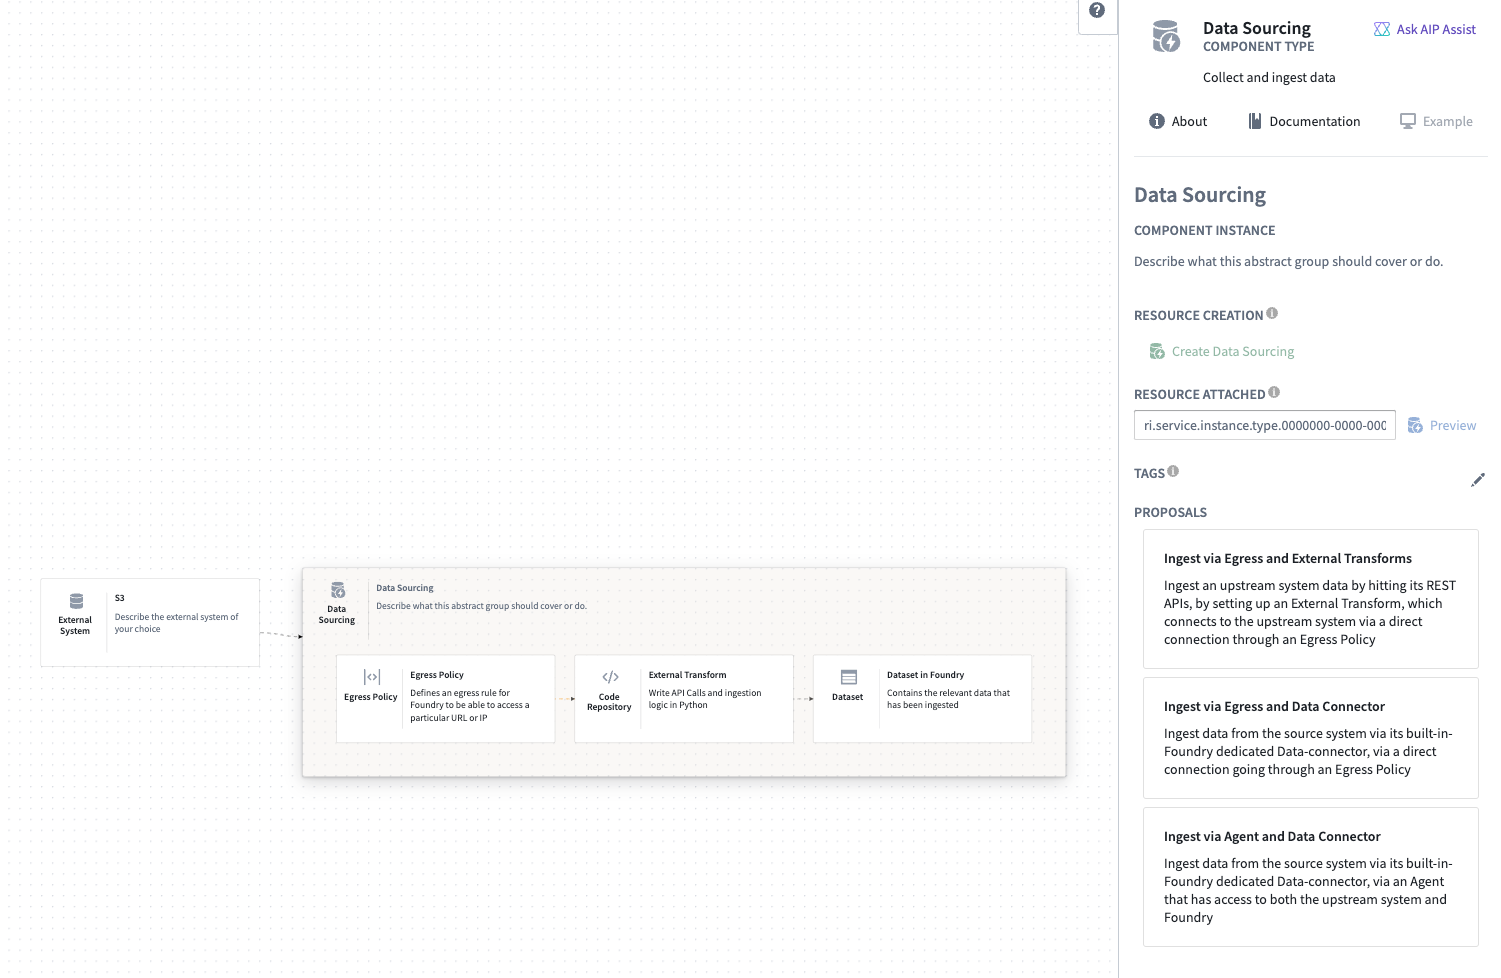
Group nodes
Grouping nodes together allows you to combine components conceptually. Creating node groups can help to add modularity and organization to your diagrams, making it easier to understand and navigate.
To create a group, select multiple nodes by holding Shift and dragging your cursor across the canvas. You may also multi-select by selecting individual nodes and holding Shift.
Once your nodes are selected, right-click and select Group to group your nodes together. You can change the group contents by dragging nodes into or out of the group.
中文翻译
图表(Diagrams)
本节概述了解决方案设计器(Solution Designer)的图形功能,以及您可以应用于图表的各种配置。
画布(Canvas)
画布是您添加节点和创建节点组时构建图表的地方。以下工具对于浏览画布非常有用。
- 画布工具栏
- 放大
- 缩小
- 居中图表
- 锁定图表:防止意外更改
- 显示/隐藏背景点
- 自动布局节点:以结构化(网格状)方式排列节点
- 显示/隐藏边标签
- 展开/折叠节点
- 画布菜单:右键单击画布打开菜单
- 添加注释
- 添加空组:添加支持嵌套图的空节点
- 自动布局节点:以结构化(网格状)方式排列节点
- 显示/隐藏边标签:控制边上文本标签的可见性
- 隐藏边有效性:忽略不正确的组件连接
- 展开/折叠节点
- 小地图:提供您在画布上当前位置的预览
节点(Nodes)
画布上的节点代表整个Palantir平台中可用的资源和应用程序。使用以下工具在图表中配置、情境化和连接您的节点。
- 配置面板切换:展开或折叠节点配置面板。
- 询问AIP Assist:提示AIP Assist解释平台组件。
- 组件信息
- 关于:节点的简短描述及其预期用途。
- 文档:相关文档的链接。
- 示例:提供节点使用方式的预览。
- 标题和节点描述
- 删除节点(悬停时显示)
- 节点连接(悬停时显示):从此处拖动以连接节点。
- 调整节点大小(悬停时显示)
- 创建/重定向到平台的相关部分
- 将RID与资源关联。
- 选择铅笔图标添加相关标签
上下文菜单节点操作
- 前移:将节点向前移动一个索引
- 后移:将节点向后移动一个索引
- 更改背景颜色:更改节点颜色
- 分组:创建单个组
- 删除节点
抽象节点(Abstract Nodes) [测试版(Beta)]
:::callout{theme="neutral" title="测试版(Beta)"} 抽象节点处于测试版开发阶段,可能不适用于您的注册环境。功能在活跃开发期间可能会发生变化。 :::
抽象节点的功能与普通节点类似。然而,一旦连接,它们会根据连接的输入和输出节点生成建议。您可以从建议的选项中进行选择,以用合适的选项替换抽象节点。
组节点(Group nodes)
将节点分组可以让您在概念上组合组件。创建节点组有助于为图表增加模块化和组织性,使其更易于理解和导航。
要创建组,请按住Shift键并在画布上拖动光标来选择多个节点。您也可以通过按住Shift键并逐个选择节点来进行多选。
选择节点后,右键单击并选择分组(Group)即可将节点组合在一起。您可以通过将节点拖入或拖出组来更改组内容。