Tutorial: Create your first diagram(教程:创建你的第一个图表)
In this section, we will create a simple diagram representing a common connection to an external system, a data transformation, and an ontology layer that users can interact with in the Palantir platform. This is a common pattern in the platform and serves as a strong foundational point for working with Solution Designer tools.
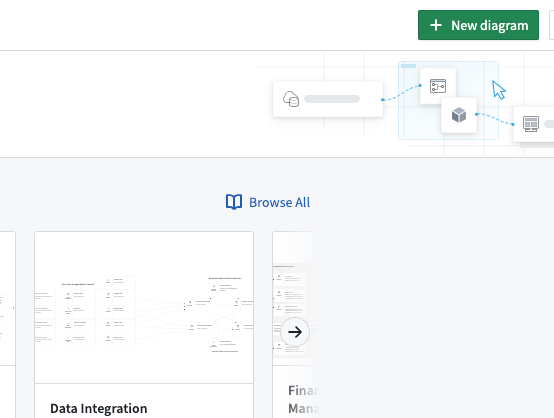
- Create a new diagram by selecting New diagram.
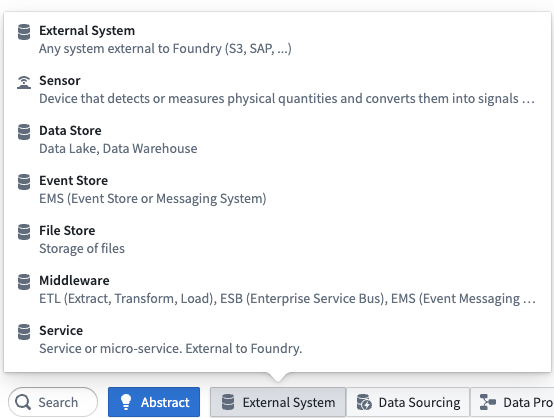
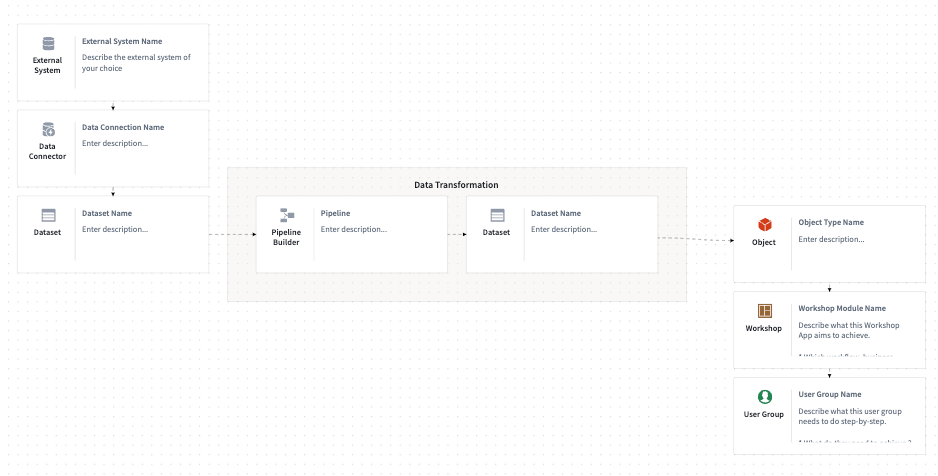
- Select External System and navigate to External System within the menu.
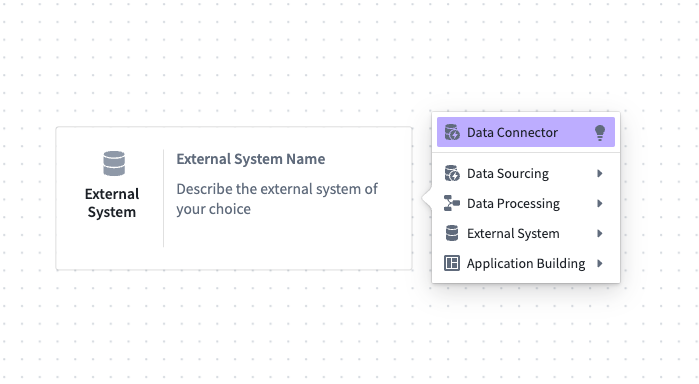
- Hover over the right edge of the External System node until you see a + symbol. Click and select the Data Connector option at the top of the list.
-
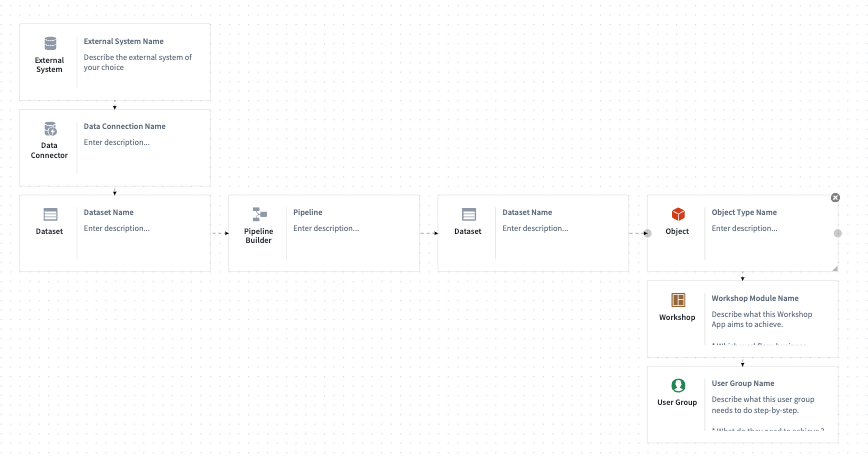
Now, hover over the new Data Connector node to click and select Dataset to generate a Dataset Name node.
-
Hover over Dataset Name, then click and select Data Processing → Pipeline Builder to add a Pipeline node.
-
Continue with this pattern to achieve the following flow: External System → Data Connector → Dataset → Pipeline Builder → Dataset → Object → Workshop → User Group.
- Press and hold
Shiftand select the Pipeline Builder node together with the Dataset node, grouping these two components together. You may also group them by right-clicking on selected items and then selecting Group.
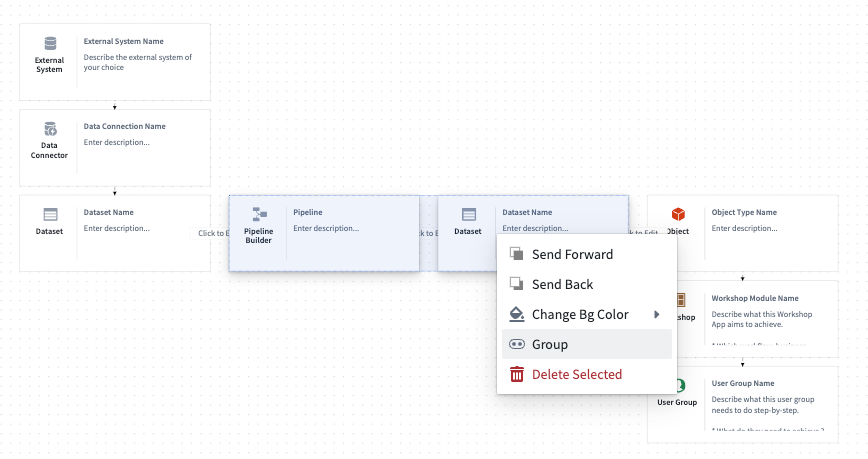
-
Name the group Data Transformation.
-
Choose Save in the top right corner to complete your first diagram.
Solution Design provides additional diagram functionality that can be useful for building out your use cases. Learn more in our diagrams documentation.
Tips
- Align with enterprise architects in your organization on how your Workshop application will pull from the Ontology. Initially, you can create a single generic Ontology node to abstractly represent all your objects.
- Align the five data domain owners on what types of data you will be using; create five different Ontology nodes, one per domain, to show from where your Workshop application will be pulling.
Your diagram does not need to be a one-to-one, detailed representation of what you will actually build. You may choose to first represent your use case conceptually, then iterate over time once additional details begin to appear.
中文翻译
教程:创建你的第一个图表
在本节中,我们将创建一个简单的图表,展示与外部系统的常见连接、数据转换过程,以及用户可在 Palantir 平台中交互的本体层(Ontology Layer)。这是平台中的常见模式,也是使用 Solution Designer 工具的良好基础起点。
- 选择 新建图表(New diagram) 来创建一个新图表。
- 选择 外部系统(External System),并在菜单中导航至 External System。
- 将鼠标悬停在 External System 节点的右侧边缘,直到出现 + 符号。点击该符号,然后选择列表顶部的 数据连接器(Data Connector) 选项。
-
现在,将鼠标悬停在新出现的 Data Connector 节点上,点击并选择 数据集(Dataset),以生成一个 数据集名称(Dataset Name) 节点。
-
将鼠标悬停在 Dataset Name 上,然后点击并选择 数据处理 → Pipeline Builder,以添加一个 管道(Pipeline) 节点。
-
按照此模式继续操作,实现以下流程:外部系统 → 数据连接器 → 数据集 → Pipeline Builder → 数据集 → 对象(Object) → Workshop → 用户组(User Group)。
- 按住
Shift键,同时选中 Pipeline Builder 节点和 Dataset 节点,将这两个组件组合在一起。你也可以通过右键点击选中的项目,然后选择 分组(Group) 来进行组合。
-
将分组命名为 数据转换(Data Transformation)。
-
点击右上角的 保存(Save),完成你的第一个图表。
Solution Design 提供了额外的图表功能,有助于构建你的用例。更多信息请参阅我们的图表文档。
提示
- 与组织内的企业架构师协调,确定你的 Workshop 应用将如何从本体(Ontology)中拉取数据。最初,你可以创建一个单一的通用 Ontology 节点,以抽象方式表示所有对象。
- 与五个数据域负责人协调,确定你将使用的数据类型;创建五个不同的 Ontology 节点,每个域一个,以展示你的 Workshop 应用将从何处拉取数据。
你的图表无需与实际构建的内容一一对应、详细呈现。你可以先以概念方式表示你的用例,然后在后续细节逐渐明确时进行迭代调整。