Exporting outputs(导出输出结果)
Foundry allows qualified users to export analytical outputs for use off-platform.
Supported exports include PDF export, export of visualizations as images, and export as CSV or XLSX.
PDF export
Notepad supports downloading documents to PDF with the ability to customize content such as page orientation, headers and footers, and individual embed (charts, tables, etc.) appearance.
Learn how to get started with Notepad.
Visualization export
You can export individual visualizations as images in Contour, Quiver, and Code Workbook.
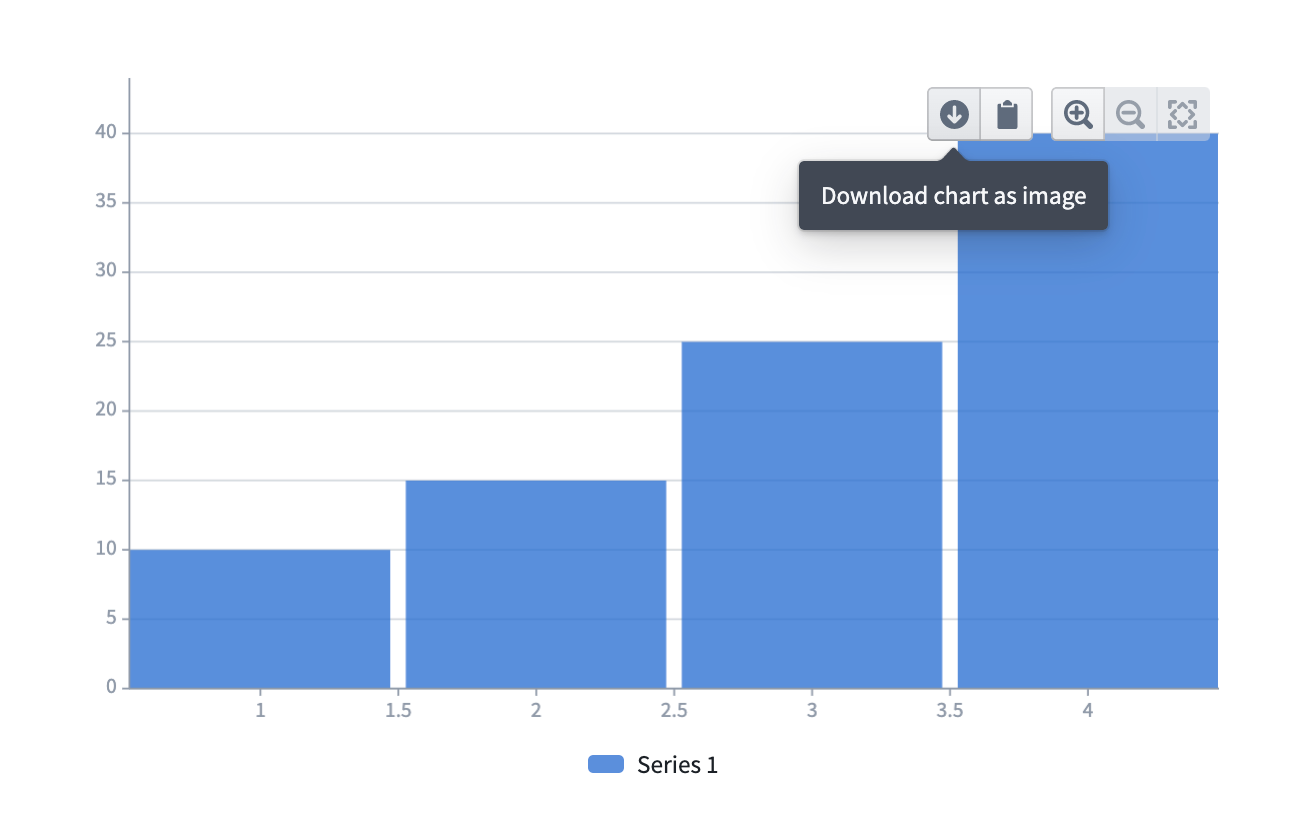
In Contour and Quiver, look for the  button (Download chart as image) in the top right of any chart, as shown below.
In Code Workbook, choose Download image from the action menu of any visualization node as shown below.

Data export
You can export analytical results as CSV and/or XLSX in Contour, Quiver, and Code Workbook.
Contour
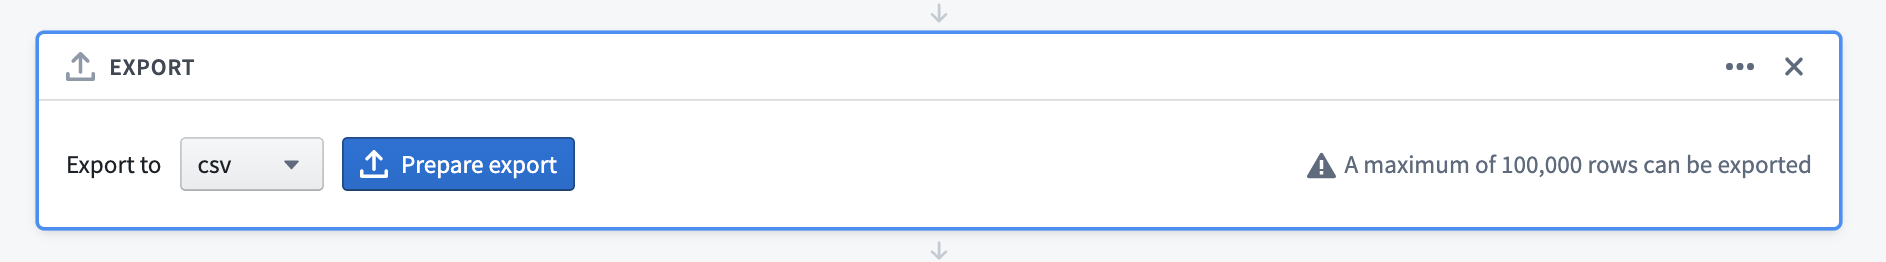
There are two ways to export data from Contour, both of which have an export limit of 100,000 rows:
- Add an Export board to your analysis path.
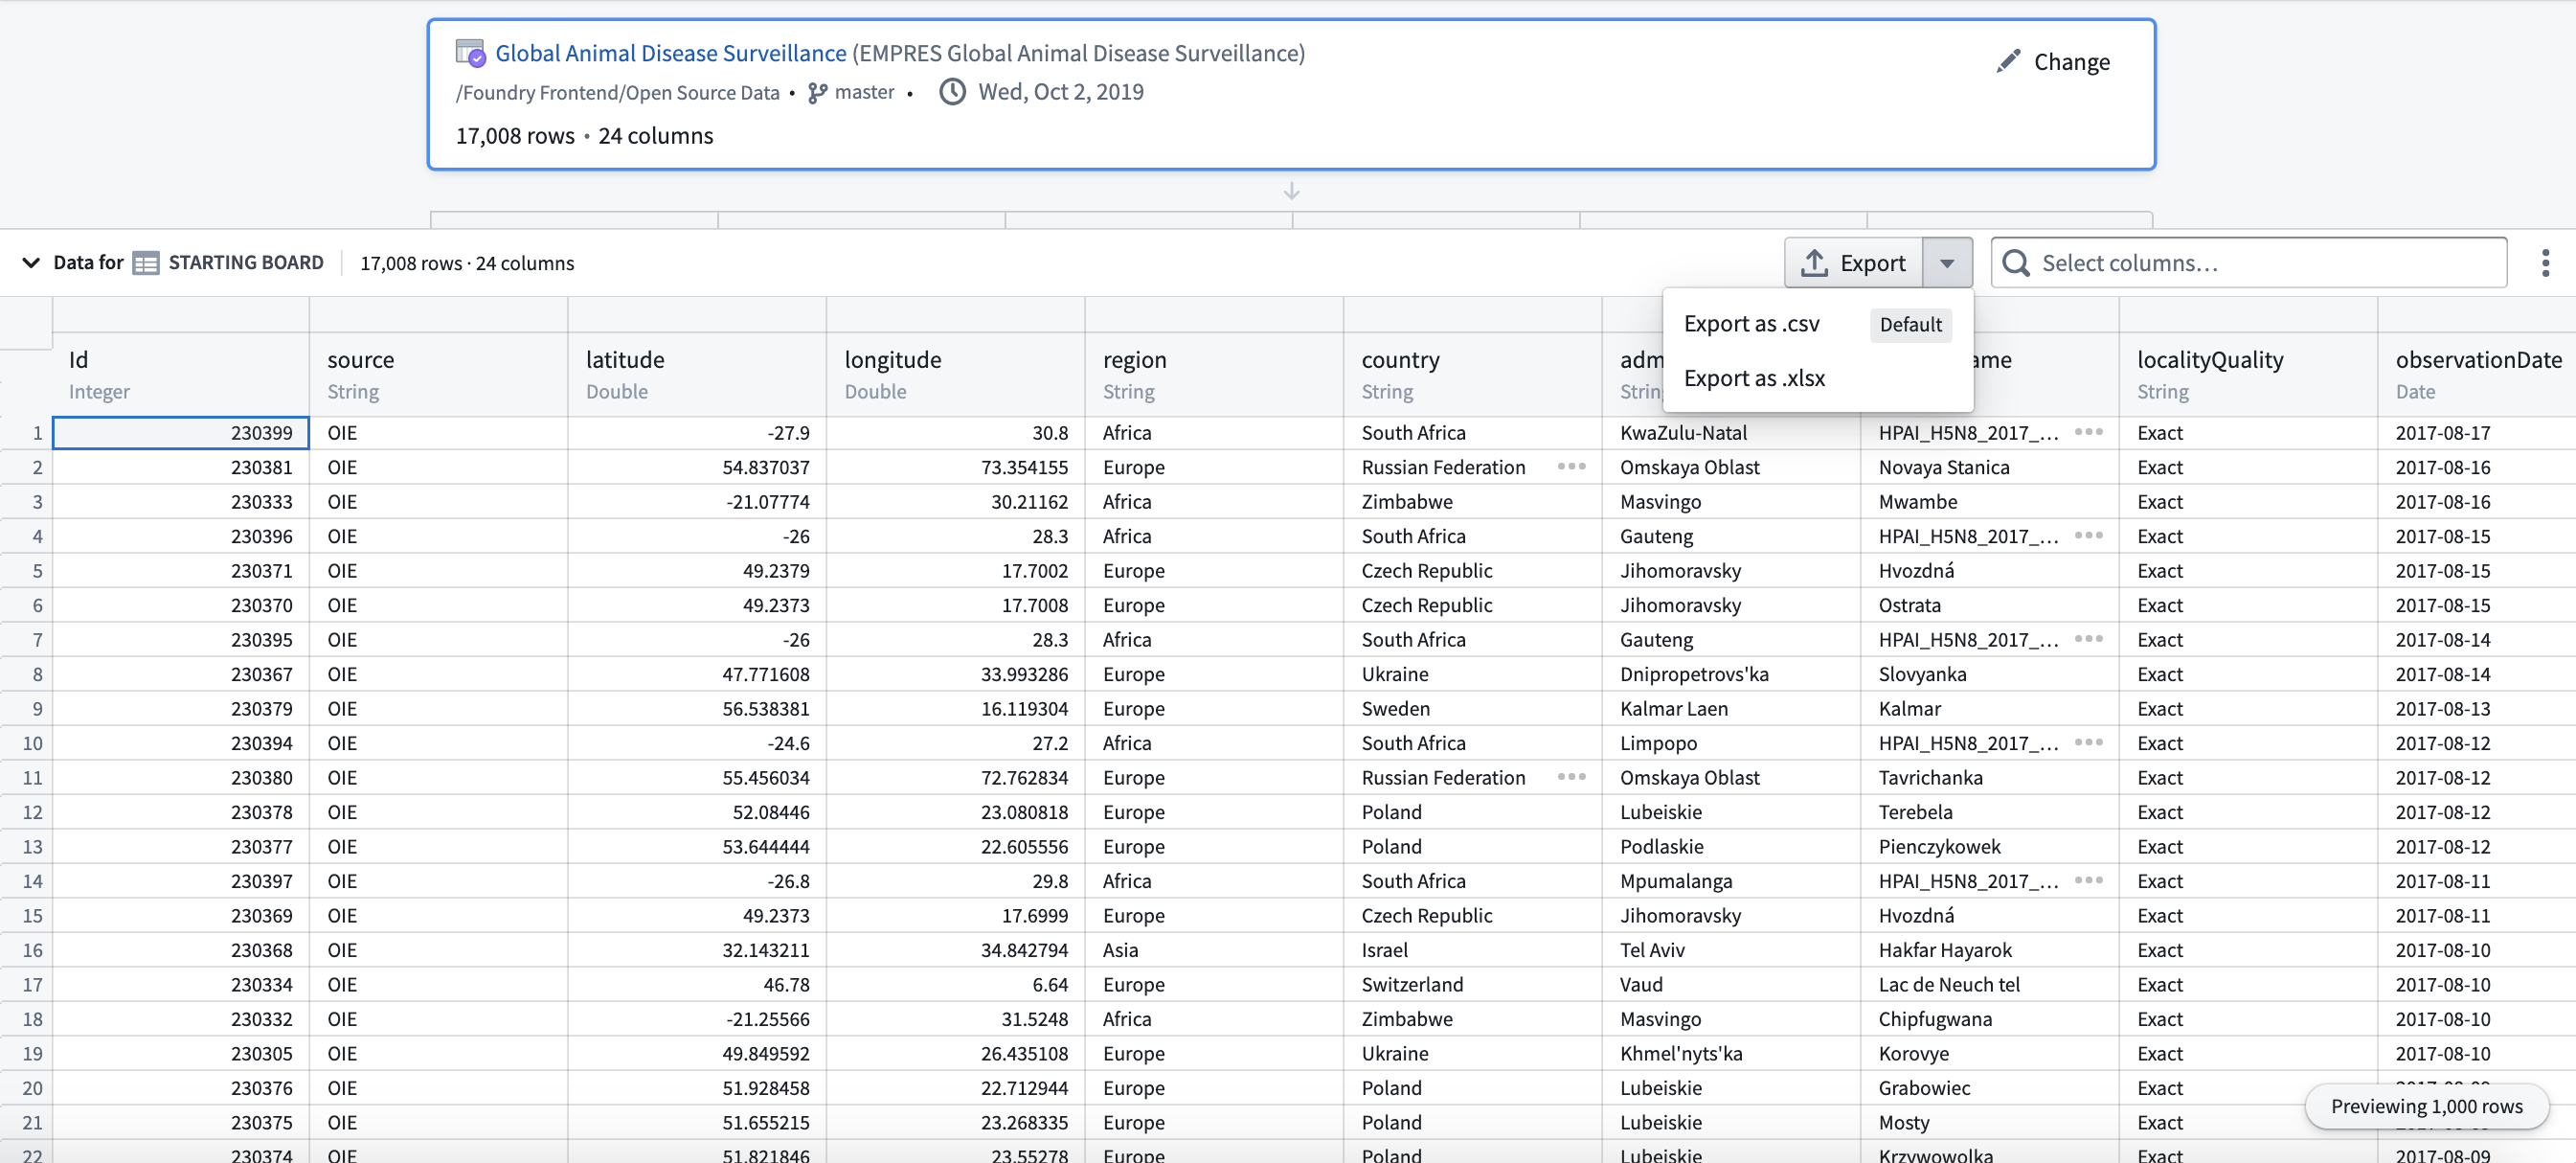
- Alternatively, you can select the relevant board in your analysis and open the table panel, then select your desired export option.
Quiver
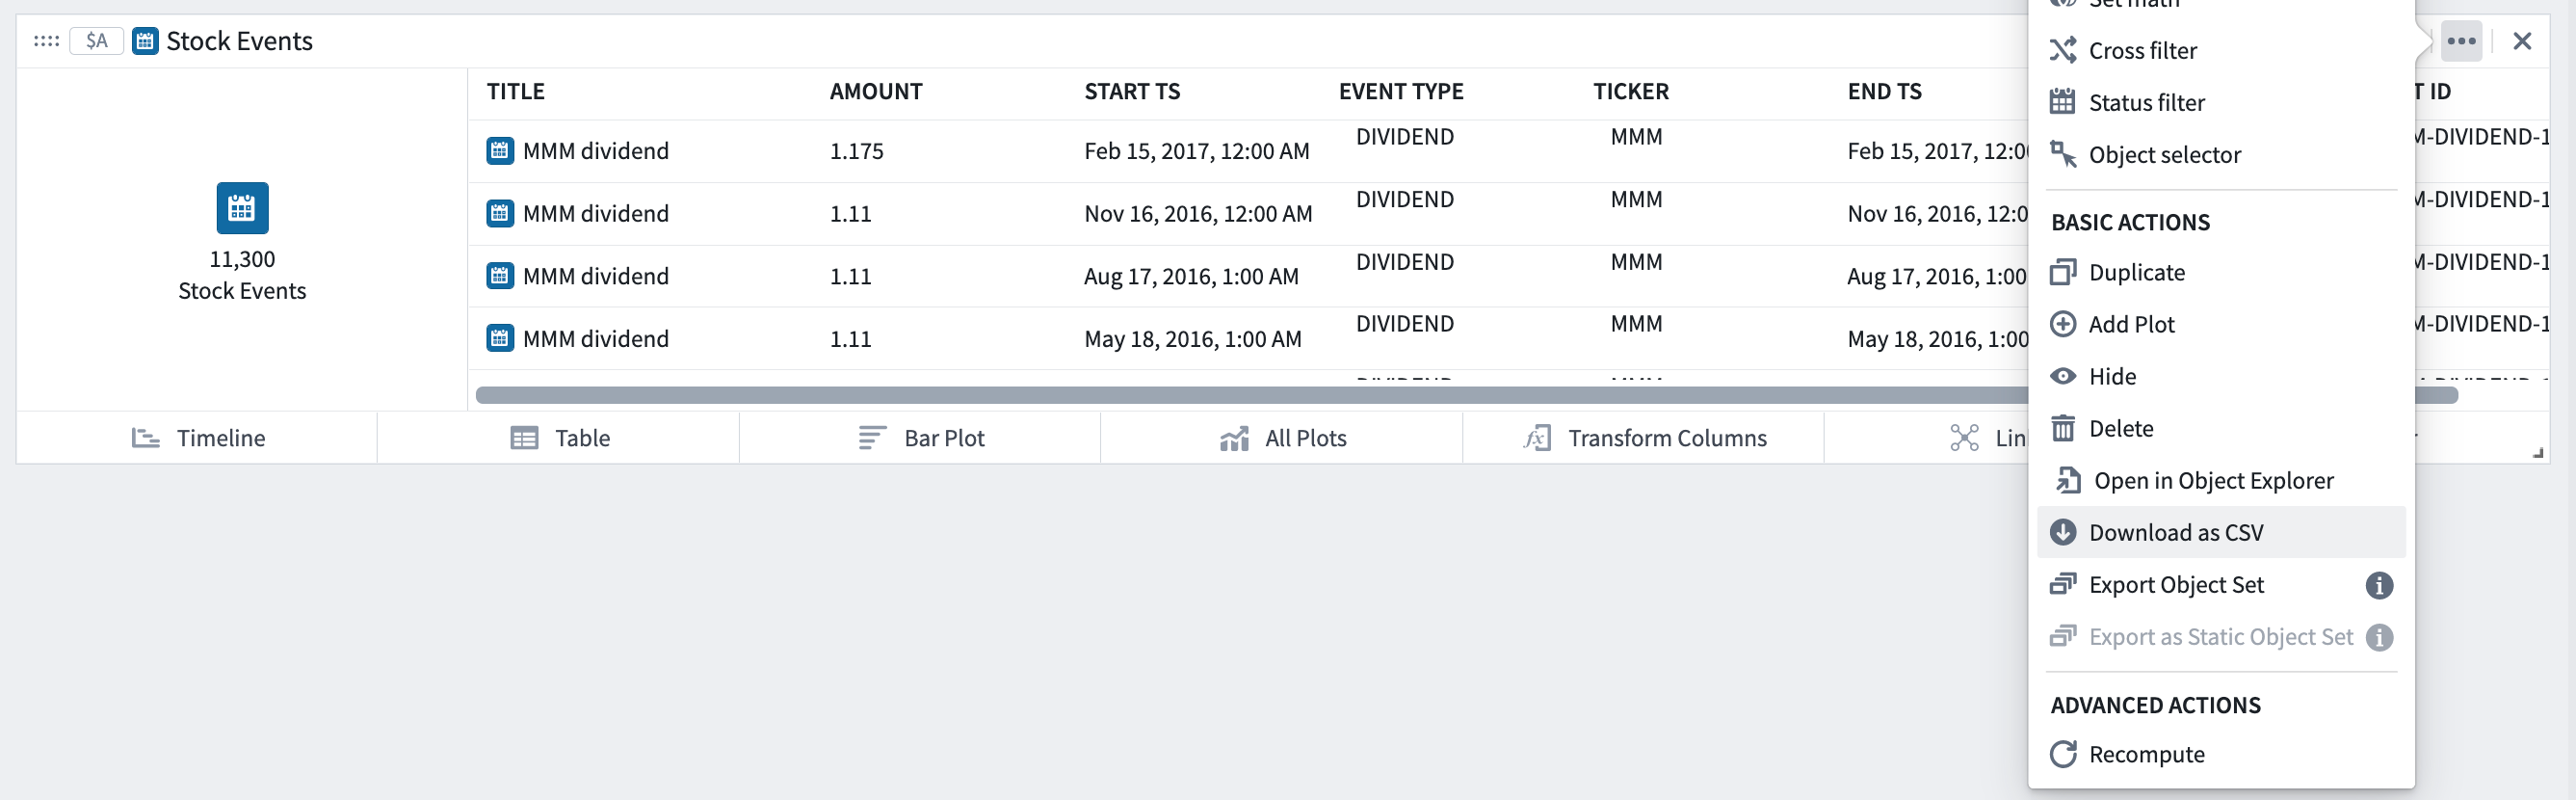
To export data from a Quiver analysis, select Download as CSV from the action menu for any card.
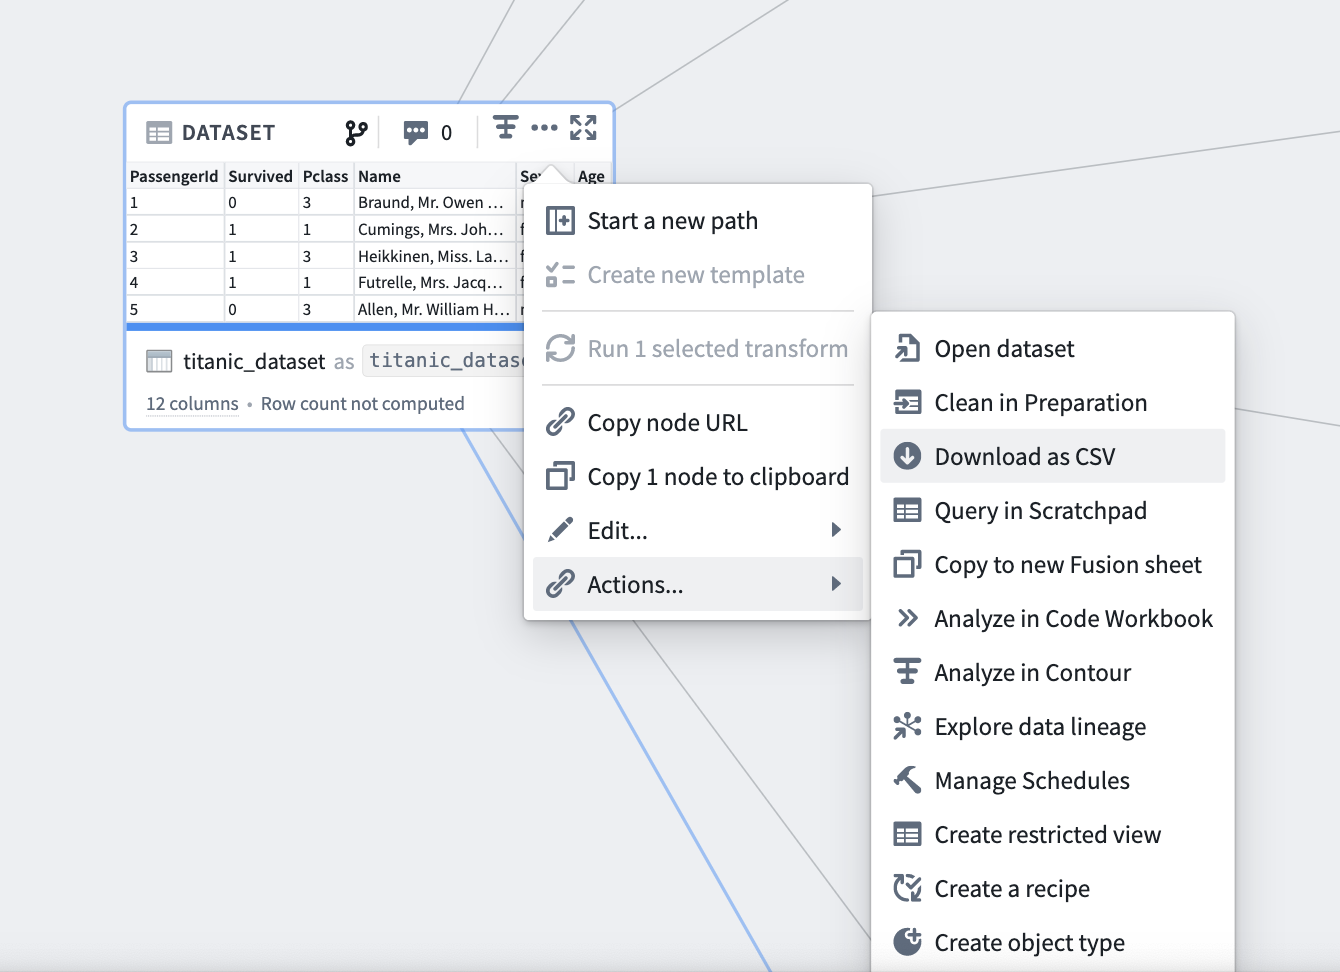
Code Workbook
To export data from a Code Workbook, select Download as CSV from the action menu for transforms that are saved as datasets. The default export limit is 100,000 rows. Note that the results of unpersisted transforms cannot be downloaded as CSV. Learn more about persisted and unpersisted transforms in Code Workbook.
中文翻译
导出输出结果
Foundry 允许合格用户将分析输出结果导出到平台外使用。
支持的导出格式包括 PDF 导出、将可视化结果导出为图片 以及 导出为 CSV 或 XLSX。
PDF 导出
Notepad 支持将文档下载为 PDF,并可自定义页面方向、页眉页脚以及单个嵌入元素(如图表、表格等)的外观等内容。
可视化结果导出
在 Contour、Quiver 和 Code Workbook 中,您可以将单个可视化结果导出为图片。
在 Contour 和 Quiver 中,请查找任意图表右上角的 按钮(将图表下载为图片),如下图所示。
在 Code Workbook 中,从任意可视化节点的操作菜单中选择 下载图片,如下图所示。
数据导出
在 Contour、Quiver 和 Code Workbook 中,您可以将分析结果导出为 CSV 和/或 XLSX 格式。
Contour
从 Contour 导出数据有两种方式,两种方式的导出上限均为 100,000 行:
- 在分析路径中添加一个 导出 面板。
- 或者,您可以选择分析中的相关面板并打开表格面板,然后选择所需的导出选项。
Quiver
要从 Quiver 分析中导出数据,请从任意卡片的操作菜单中选择 下载为 CSV。
Code Workbook
要从 Code Workbook 中导出数据,请从已保存为数据集的转换操作菜单中选择 下载为 CSV。默认导出上限为 100,000 行。请注意,未持久化转换的结果无法下载为 CSV。了解 Code Workbook 中持久化与未持久化转换的更多信息。