Types of analysis(分析类型)
The Foundry analytical suite supports both point-and-click analysis (no-code or low-code) and code-based data analysis, with tools optimized for different analysis and source types as well as tools for dashboarding and reporting.
A summary of tools and supported workflows is below:
| Point-and-click analysis | Code-based analysis | |
|---|---|---|
| Tabular data | Contour | Code Workbook |
| Object data (Ontology) | Insight, Quiver | |
| Time series data | Quiver | Code Workbook |
| Map (geospatial) data | Map, Contour, Quiver, Insight |
Point-and-click analysis
Foundry provides several tools for point-and-click analysis: Contour, Insight, and Quiver.
- Contour enables data analysis on tabular data at scale.
- Insight is designed for operational users to analyze the ontology and create object sets.
- Quiver supports advanced ontology analysis, dashboard creation, and time series data.
Additionally, Object Explorer is a search and discovery tool for the Ontology layer that supports searching across the ontology and finding individual objects.
Contour, Insight, and Quiver allow you to:
- Visualize, filter, and transform data without code.
- Leverage expression languages for more advanced transformations and aggregations.
- Organize complex analyses.
- Create interactive dashboards that allow others to explore and investigate data in a guided, structured way.
- Share analyses with colleagues.
Learn more below about the specific use cases for which these tools are optimized.
Contour
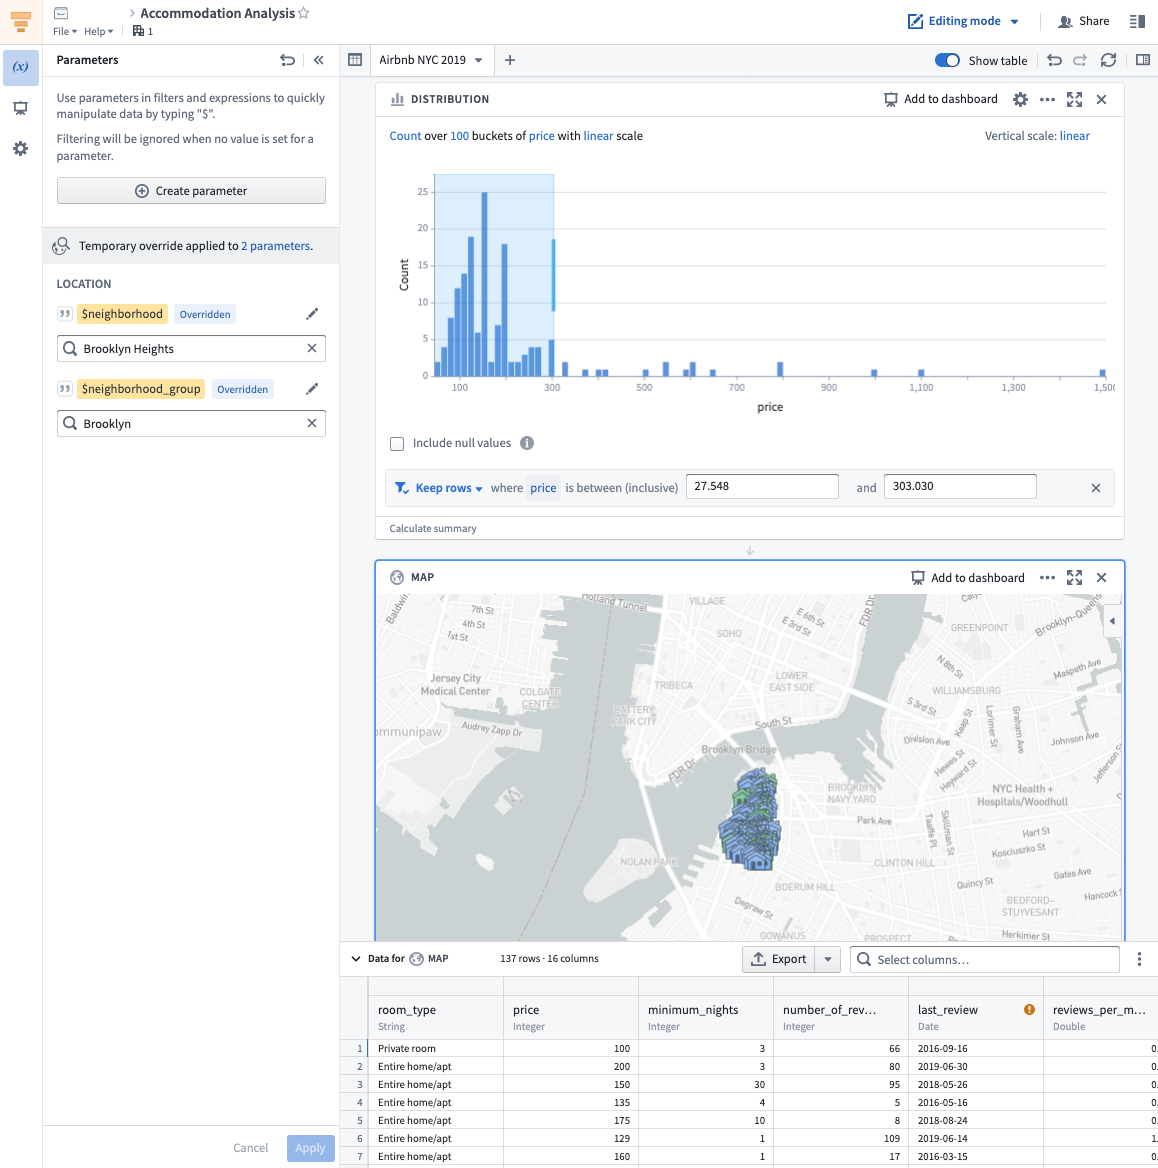
Contour is a good fit for analytical use cases where:
- Some or all of the data you want to use is not mapped in the Ontology: In general, we recommend using the Ontology layer whenever possible, but there are some cases where this may not be appropriate, such as a one-time upload that will not be cleaned or reused. Not all data is intended for the ontology layer. For example Contour can be useful for looking at intermediary datasets in pipelines.
- You need to operate on a very large dataset: Contour was designed to facilitate analytical operations on very large datasets, while Quiver supports object aggregations of up to 50,000 rows.
- You want to share your analysis results as a new dataset for use in other Foundry tools. Learn more about saving results as datasets.
- You want to build parameterized analyses to easily switch between different views of the data and results.
Learn how to get started with Contour.
Insight
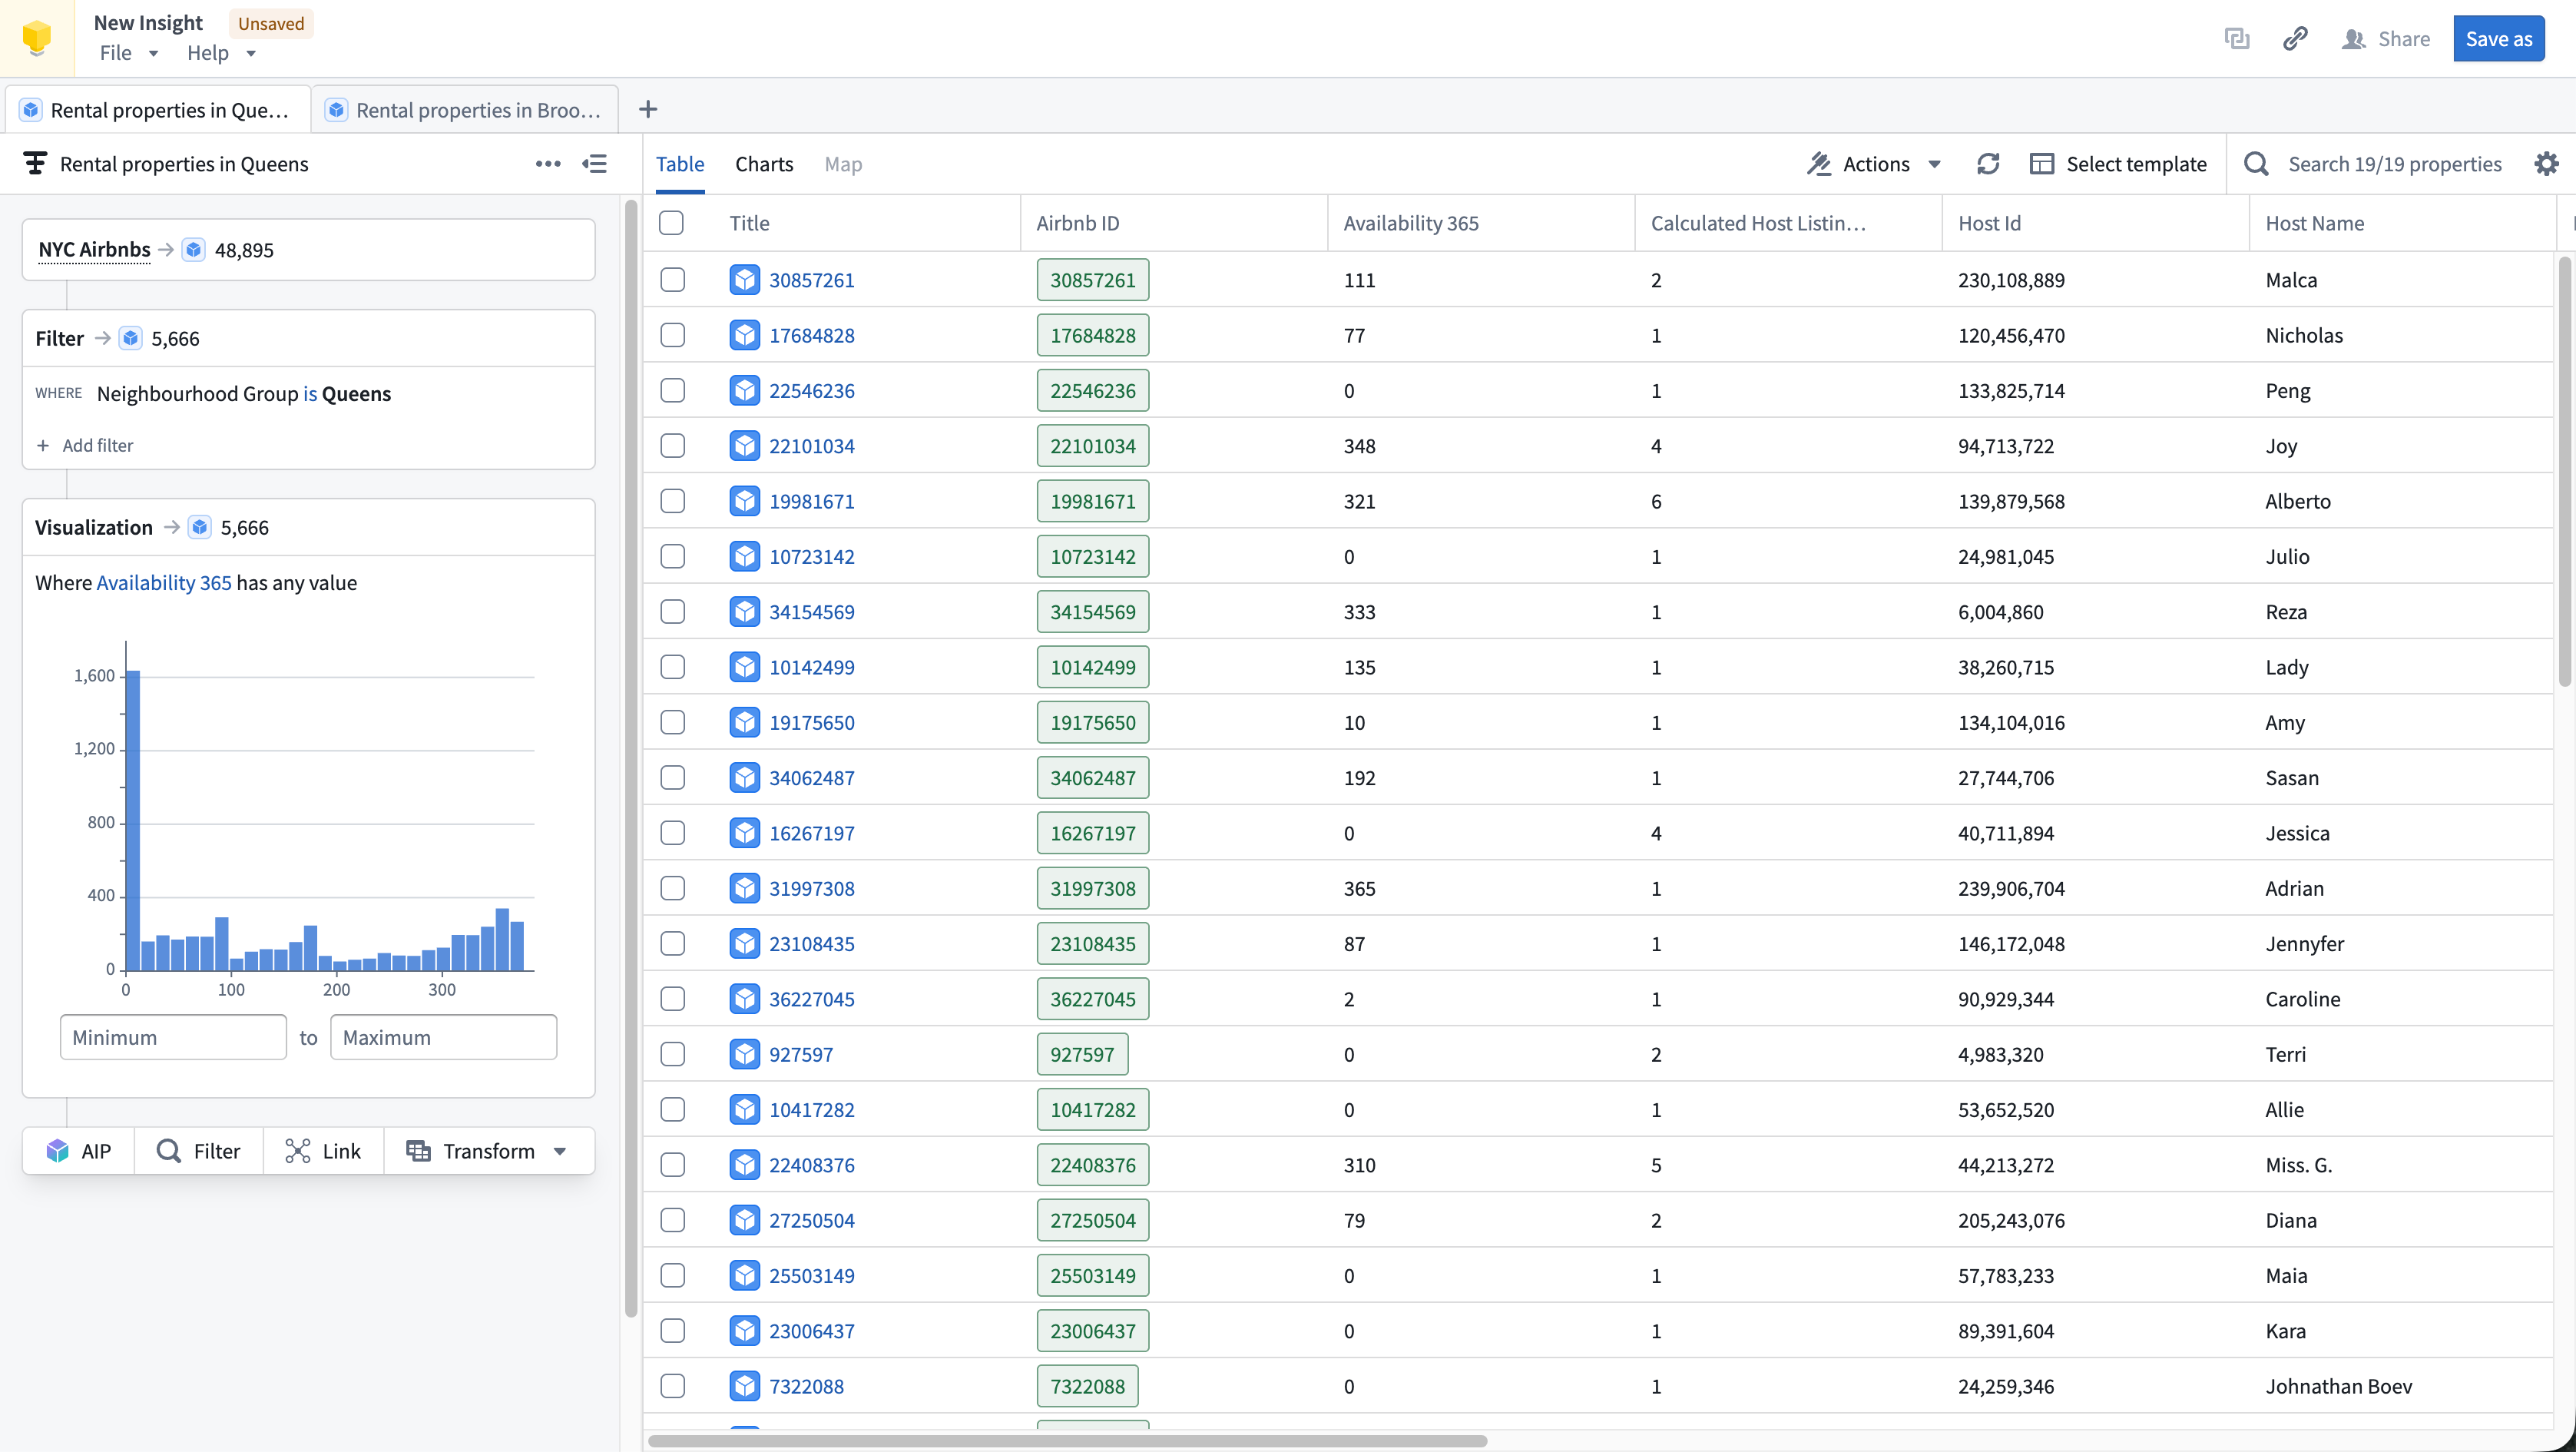
Insight is a good fit for analytical use cases where:
- Your data is mapped in the Ontology: Insight leverages Ontology data such as object types, interfaces, link types, and actions.
- You need to perform ad-hoc analysis without code: The visual analysis path makes it easy to build complex queries step by step, supporting both simple and complex drill down workflows.
- You want to explore relationships between objects: The Link step lets you follow links to discover connected objects across the Ontology as well as filter data based on linked properties.
- You want to write data back to the Ontology: Insight supports creating, updating, and deleting objects from your analysis results.
Learn how to get started with Insight.
Quiver

Quiver is a good fit for analytical use cases where:
- Your data is mapped in the Ontology: Links between objects are natively represented in the Ontology, so Quiver users do not have to perform joins or worry about identifying primary or foreign keys. Joins represented as links are returned by performing a Search Around on an object or object set to retrieve any linked objects.
- You are working with time series data: Quiver has been optimized to work with time series data. Quiver includes a specific time series library with sensor and signal processing functions and can be backed by a proprietary time series database that has been optimized for specific operations on high frequency signals. See Time series analysis for more information.
- You want to embed your findings into other object-aware applications: Quiver dashboards can be embedded into operational applications such as Workshop.
- You want to write back to the Ontology: Quiver can be used to write analytical decisions back to the Ontology using an Action. This allows you to capture analytical conclusions immediately for use by others.
Learn how to get started with Quiver.
Object Explorer
Users can conduct simple object-based analytical workflows in Object Explorer. Object Explorer is a search and analysis tool for answering questions about anything in the Ontology layer. Users can visually compose search queries in Object Explorer, ranging from simple filters to Search-arounds to find objects of interest. Object Explorer is a good fit for analytical workflows in which:
- You want to search terms across your Ontology: Object Explorer provides a search entry point to find objects or object types across the ontology. The search results page supports viewing object instance and object type results.
- You want to explore an object type and its properties: Object Explorer is a great starting point for finding relevant object data and looking at Object Views.
- Your end goal is creating a list of relevant objects (object set): Object Explorer enables creating object explorations and object lists to share with others or use in other applications like Quiver or Insight for further analysis. Learn more about explorations and object lists.
Learn how to get started with Object Explorer.
Code-based analysis
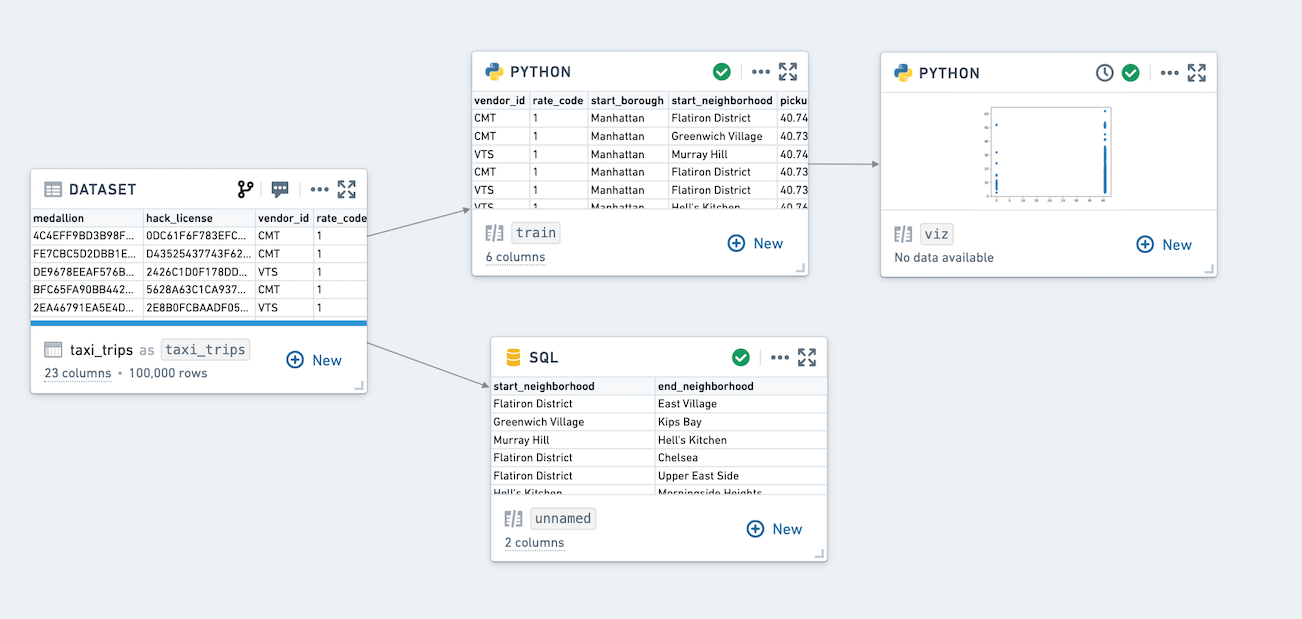
Code Workbook
Code Workbook is an application that allows users to analyze and transform data using an intuitive graphical interface.
Code Workbook was designed with these principles in mind:
- Iteration speed: Users can quickly test and refine logic for transformation and visualization in order to produce useful results.
- Low barrier to entry: Code Workbook's graphical interface and support for using pre-authored logic were designed to enable easy onboarding of users of varying technical skill.
- Collaboration: Disparate groups of users can share logic and work together on a single analysis in Code Workbook.
- Model creation: Users can iterate on Foundry Models in Code Workbook, and easily view Model stages and metrics. Models can then be submitted to Modeling objectives and used operationally.
- Platform interoperability: Users can productionize their findings across the platform by adding visualizations to Notepads and promoting production-ready pipelines to Code Repository.
Key features of Code Workbook include:
- An interactive console for rapid iteration on transformation logic and ad-hoc data exploration.
- Visualization support to create detailed, interactive images with commonly used packages (Matplotlib, Plotly, Seaborn).
- Templates that enable reuse of complex and domain-specific logic through a simple interface.
- Support for multiple languages (Python, SQL, R) for code and templates to allow users to select the best language for an analysis and leverage multiple languages in a single analysis.
- Branching to facilitate collaboration by isolating users’ changes from one another.
- An intuitive user interface that makes it easy to customize the Spark environment, set input types for transforms, and view relationships between nodes.
Learn how to get started with Code Workbook.
:::callout{theme="neutral" title="Which tool should I use to build pipelines?"} Code Workbook is not optimized for building production pipelines. If you are building or maintaining production pipelines, use the Code Repositories application, which includes version history, branching and pull requests, and other functionality essential for robust pipelines. More information can be found in this comparison of Foundry’s tools for writing code-based transformations. :::
Time series analysis
Foundry provides advanced end-to-end tooling for time series storage, monitoring, transformation, analysis, and writeback. Workflows from historical performance analysis to trend and correlation analysis to forecasting can make use of Foundry's time series capabilities.
Both Quiver and Code Workbook support time series analysis for no-code and code-based analysis respectively. Learn how to get started with time series.
Map-based (geospatial) analysis
Geospatial data is often a key input for Foundry users seeking to connect analytics with operations. Foundry streamlines geospatial data transformations and analytics and can enable map-based workflows.
The Map application is a powerful application for geospatial analysis. Also, Contour and Quiver include map widgets for use in analyses that include geospatial data.
Dashboarding
Both Contour and Quiver support building interactive dashboards based on analytical results. Learn more about dashboarding.
Reporting
Notepad is Foundry’s next-gen reporting tool and is recommended for the majority of reporting use cases. Learn more about reporting.
中文翻译
分析类型
Foundry 分析套件既支持点击式分析(无代码或低代码),也支持基于代码的数据分析,并针对不同的分析和数据源类型提供了优化工具,以及用于仪表盘和报告的工具。
以下是工具及支持的工作流摘要:
| 点击式分析 | 基于代码的分析 | |
|---|---|---|
| 表格数据 | Contour | Code Workbook |
| 对象数据(本体论 Ontology) | Insight, Quiver | |
| 时间序列数据 | Quiver | Code Workbook |
| 地图(地理空间)数据 | Map, Contour, Quiver, Insight |
点击式分析
Foundry 提供了多种点击式分析工具:Contour、Insight 和 Quiver。
- Contour 支持对表格数据进行大规模数据分析。
- Insight 专为操作型用户设计,用于分析本体论(Ontology)并创建对象集(Object Sets)。
- Quiver 支持高级本体论(Ontology)分析、仪表盘创建以及时间序列(Time Series)数据分析。
此外,对象浏览器(Object Explorer) 是一个用于本体论层(Ontology Layer)的搜索和发现工具,支持跨本体论(Ontology)搜索并查找单个对象。
Contour、Insight 和 Quiver 允许您:
- 无需代码即可可视化、筛选和转换数据。
- 利用表达式语言进行更高级的转换和聚合。
- 组织复杂的分析。
- 创建交互式仪表盘,让他人能够以引导式、结构化的方式探索和研究数据。
- 与同事共享分析结果。
请参阅下文,了解这些工具所优化的具体用例。
Contour
Contour 适用于以下分析场景:
- 您想要使用的部分或全部数据未映射到本体论(Ontology)中: 通常,我们建议尽可能使用本体论层(Ontology Layer),但在某些情况下这可能不合适,例如一次性上传且不会清理或复用的数据。并非所有数据都旨在进入本体论层(Ontology Layer)。例如,Contour 可用于查看管道中的中间数据集。
- 您需要对非常大的数据集进行操作: Contour 旨在促进对超大数据集的分析操作,而 Quiver 支持最多 50,000 行的对象聚合。
- 您希望将分析结果作为新数据集共享,以便在 Foundry 的其他工具中使用。 了解有关将结果保存为数据集的更多信息。
- 您希望构建参数化分析,以便轻松切换数据和结果的不同视图。
Insight
Insight 适用于以下分析场景:
- 您的数据已映射到本体论(Ontology)中: Insight 利用本体论(Ontology)数据,如对象类型(Object Types)、接口(Interfaces)、链接类型(Link Types)和操作(Actions)。
- 您需要无需代码即可进行临时分析: 可视化分析路径使您可以轻松地逐步构建复杂查询,支持简单和复杂的下钻工作流。
- 您希望探索对象之间的关系: 链接(Link) 步骤允许您跟随链接发现跨本体论(Ontology)的连接对象,并基于链接属性筛选数据。
- 您希望将数据写回本体论(Ontology): Insight 支持根据分析结果创建、更新和删除对象。
Quiver
Quiver 适用于以下分析场景:
- 您的数据已映射到本体论(Ontology)中: 对象之间的链接在本体论(Ontology)中天然表示,因此 Quiver 用户无需执行连接操作或担心识别主键或外键。通过在一个对象或对象集上执行搜索周边(Search Around)来检索任何链接对象,即可返回表示为链接的连接。
- 您正在处理时间序列数据: Quiver 已针对时间序列数据进行了优化。Quiver 包含一个特定的时间序列库,具有传感器和信号处理功能,并可由专有的时间序列数据库支持,该数据库已针对高频信号的特定操作进行了优化。有关更多信息,请参阅时间序列分析。
- 您希望将发现嵌入到其他对象感知应用程序中: Quiver 仪表盘可以嵌入到操作型应用程序中,例如 Workshop。
- 您希望写回本体论(Ontology): Quiver 可用于使用操作(Action)将分析决策写回本体论(Ontology)。这使您可以立即捕获分析结论,供他人使用。
对象浏览器(Object Explorer)
用户可以在对象浏览器(Object Explorer)中执行简单的基于对象的分析工作流。对象浏览器(Object Explorer)是一个搜索和分析工具,用于回答关于本体论层(Ontology Layer)中任何内容的问题。用户可以在对象浏览器(Object Explorer)中直观地组合搜索查询,范围从简单的筛选器到搜索周边(Search-around)以查找感兴趣的对象。对象浏览器(Object Explorer)适用于以下分析工作流:
- 您希望跨本体论(Ontology)搜索术语: 对象浏览器(Object Explorer)提供了一个搜索入口点,用于跨本体论(Ontology)查找对象或对象类型。搜索结果页面支持查看对象实例和对象类型结果。
- 您希望探索对象类型及其属性: 对象浏览器(Object Explorer)是查找相关对象数据和查看对象视图(Object Views)的绝佳起点。
- 您的最终目标是创建相关对象列表(对象集 Object Set): 对象浏览器(Object Explorer)支持创建对象探索和对象列表,以便与他人共享或在其他应用程序(如 Quiver 或 Insight)中用于进一步分析。了解有关探索和对象列表的更多信息。
了解如何开始使用对象浏览器(Object Explorer)。
基于代码的分析
Code Workbook
Code Workbook 是一个应用程序,允许用户使用直观的图形界面分析和转换数据。
Code Workbook 的设计遵循以下原则:
- 迭代速度: 用户可以快速测试和完善转换和可视化的逻辑,以产生有用的结果。
- 低入门门槛: Code Workbook 的图形界面以及对使用预编写逻辑的支持,旨在使不同技术水平的用户都能轻松上手。
- 协作: 不同的用户组可以在 Code Workbook 中共享逻辑并共同处理单个分析。
- 模型创建: 用户可以在 Code Workbook 中迭代 Foundry 模型,并轻松查看模型阶段和指标。然后可以将模型提交到建模目标并进行操作化使用。
- 平台互操作性: 用户可以通过向 Notepad 添加可视化并将生产就绪的管道提升到 Code Repository,从而在整个平台上将他们的发现投入生产。
Code Workbook 的主要功能包括:
- 交互式控制台,用于快速迭代转换逻辑和临时数据探索。
- 可视化支持,使用常用包(Matplotlib、Plotly、Seaborn)创建详细的交互式图像。
- 模板,通过简单的界面实现复杂和领域特定逻辑的重用。
- 支持多种语言(Python、SQL、R)用于代码和模板,允许用户为分析选择最佳语言,并在单个分析中利用多种语言。
- 分支(Branching),通过隔离用户之间的更改来促进协作。
- 直观的用户界面,使自定义 Spark 环境、设置转换的输入类型以及查看节点之间的关系变得容易。
:::callout{theme="neutral" title="我应该使用哪个工具来构建管道?"} Code Workbook 并非为构建生产管道而优化。如果您正在构建或维护生产管道,请使用 Code Repositories 应用程序,它包含版本历史、分支和拉取请求以及其他对健壮管道至关重要的功能。更多信息请参见此 Foundry 编写基于代码转换的工具比较。 :::
时间序列分析
Foundry 为时间序列存储、监控、转换、分析和回写提供了先进的端到端工具。从历史性能分析到趋势和相关性分析,再到预测,工作流都可以利用 Foundry 的时间序列功能。
Quiver 和 Code Workbook 分别支持无代码和基于代码的时间序列分析。了解如何开始使用时间序列。
基于地图的(地理空间)分析
对于寻求将分析与运营联系起来的 Foundry 用户来说,地理空间数据通常是一个关键输入。Foundry 简化了地理空间数据转换和分析,并支持基于地图的工作流。
地图应用程序(Map Application) 是一个用于地理空间分析的强大应用程序。此外,Contour 和 Quiver 包含地图小部件,可用于包含地理空间数据的分析。
仪表盘(Dashboarding)
Contour 和 Quiver 都支持基于分析结果构建交互式仪表盘。了解有关仪表盘的更多信息。
报告(Reporting)
Notepad 是 Foundry 的下一代报告工具,推荐用于大多数报告用例。了解有关报告的更多信息。