Parameterize your analysis(参数化分析)
Use Parameters in a Contour analysis to easily switch between different views of the data and results. For example, imagine a dataset listing sales of food items across time and store location. For each food item, we would like to perform some analysis on its sales. Rather than creating one path for item and duplicating work, we can use parameters to switch the food item.
Creating parameters
Use the sidebar on the left-hand side of the interface to create a parameter. The supported types are Date, String, and Number. Here, we create a Item parameter with default value Sandwich. When you or others open this analysis, the value for the Item parameter will default to Sandwich. Editors and viewers can choose to override this parameter to investigate other food items.

:::callout{theme="neutral" title="Adding parameters"} After adding a new parameter and using it in your analysis, ensure that you update any downstream paths so that any linked Report will be updated with the newly added parameter. :::
Multi-value parameters
To enable a parameter to take multiple values simultaneously, toggle Allow multiple values in the parameter settings. This option is available for String and Number parameters but not for Date parameters.
Note that a multi-value parameter is treated as an array of its values in the Expression Board, even if only one or no values are specified for the parameter. When enabling multiple values for a parameter, you may have to update any expressions where it is used so that the correct type (Array) is expected.
Using parameters in transformations
Parameters can be used in the Filter or Expression boards.
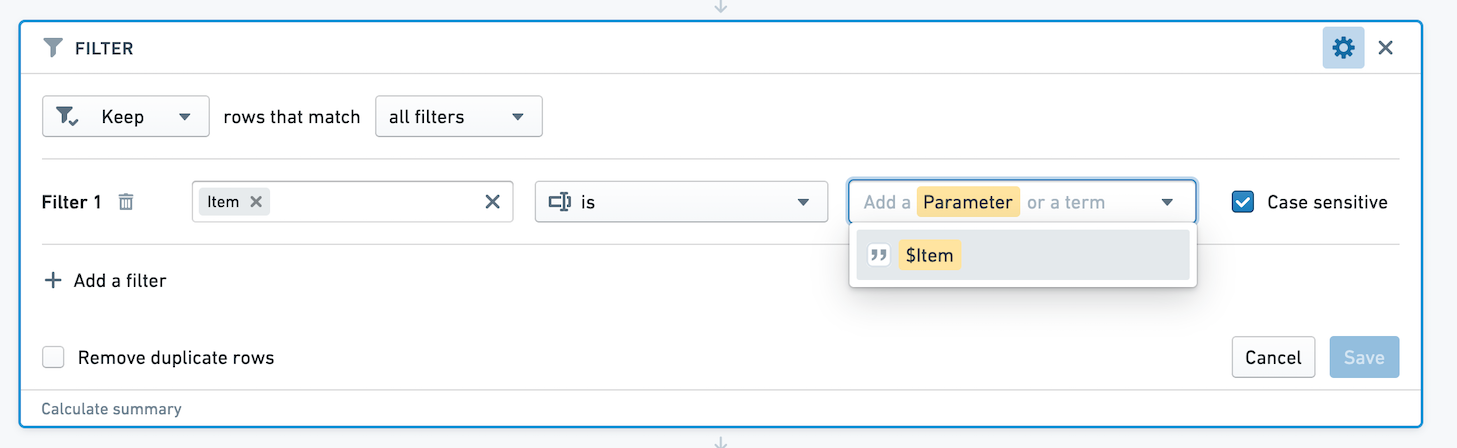
Let's say we want to visualize our data by producing a Pivot Table with the sales of the food item for each location. First, we need to filter the dataset to rows where the Item is equal to the value of the Item parameter. In the filter board, clicking the down arrow shows a list of available parameters. Then, select the Item parameter.
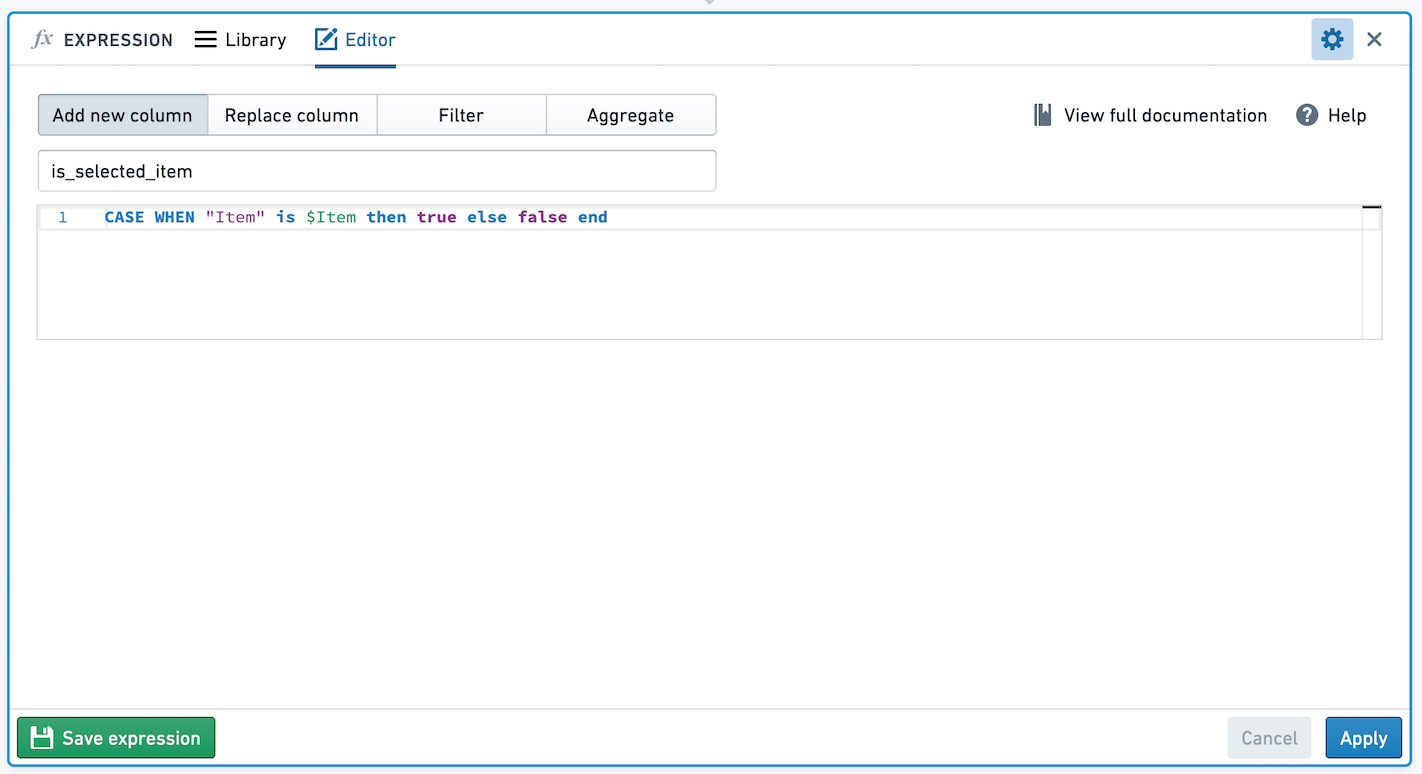
Another visualization we'd like to produce is a chart comparing sales of the food item to all other items. We want to create a new column with value True for sales of the item, and False otherwise.
Use parameters in the Expression board by referring to $parameter_name (note the dollar sign). We can add a case when statement to create this new column, as below.
Editing parameters
If you want to change the name, type, default value, or whether the parameter accepts multiple values, click the pencil icon to edit the parameter.

Note that editing the parameter will change what all viewers and editors of the analysis see. If you'd like to quickly try out a parameter value, without changing the default, override the parameter value as described below.
Suggested values
Sometimes the valid options of a parameter may be drawn from a known set. You can provide suggested values for a parameter either by linking it to a column of dataset or restricted view included in the analysis, or by manually entering a list of values. To get started, toggle on Suggest values from linked column at the bottom of the parameter editor.

From here, you can add a manual set of values by selecting Or enter values manually. This will open a dialog where you can enter your own suggested values for the parameter, one per line.
Alternatively, opening the Link to values of a column dropdown will show a list of all of the datasets and restricted views included in starting boards in the analysis. Hovering over one of these datasets or restricted views will open a nested menu showing the columns of that resource.

The dataset in the screenshot above uses open source data from the UN Food and Agriculture Organization ↗.
Select a column and save the parameter. In the parameter overview, you should see a list of suggestions when you select the input field for that parameter. This will provide up to 1000 unique values computed from the saved column.

Cross-filter groups
If you have multiple string parameters derived from various columns of a single dataset or restricted view, these parameters can be added to a cross-filtering group. In a cross-filtering group, selections for each parameter will filter the suggestions shown for other parameters. After linking a parameter to a column of a resource, you should see a new section appear which allows you to add that parameter to a group:

Click into the dropdown and select Create new cross-filtering group. Enter a name for the group (in this example, "Location parameters"). Remember to save the parameter. Now, you can edit another parameter linked to the same dataset and add it to the group by selecting it from the dropdown.

Save the parameter and go back to the editor. The parameters will now be displayed together under the "Location parameters" heading. Make a selection for one of the parameters and then click into the second. The suggested values for the second will update accordingly.

Note that the 1000 unique values limit applies to the entire group rather than an individual parameter within the group. If a pair of columns has more than 1000 unique pairs between them, not all of the possible suggested values will be available.
Overriding parameter values
You can temporarily override the value of your parameter by manually typing in parameter values in the left sidebar. This is useful to see how an analysis updates to a change in the value, without updating the default for all viewers.

Once this change is applied, note that the parameter is tagged with Overridden. Use the arrow in the top bar to reset all parameter values to their defaults.
Overriding a parameter value will persist until you refresh the page, and will not affect what that other users see.
Parameters in Contour dashboards
If any boards you add to a Contour dashboard rely on a parameter, that parameter will automatically show up in the Contour dashboard. This means that if a parameter exists in the analysis but is unused by the boards in the dashboard, it will not appear in the dashboard.
In a Contour dashboard, users can override the values of parameters to see different views of their data. Learn more about Contour dashboards.
When navigating between the Contour dashboard and the analysis, parameter values will be retained. If you override a parameter value in the dashboard and want to investigate its origin path more deeply, clicking the Back to analysis button will retain the overridden parameter value.
Parameters in Foundry Reports
Once you create a parameter inside a Contour analysis, you can also use it in the legacy Foundry Reports application. However, Reports does not support parameters linked to Restricted View columns, or cross-filter groups - these features are only available in Contour analyses and Contour dashboards. If you add a parameter linked to a Restricted View to a Report, no suggested values will be populated. If you add a parameter in a cross-filter group to a Report, by default the Report parameter will be linked to the same dataset column, but it will not be cross-filtered based on selections in other parameters in the Contour cross-filter group.
中文翻译
参数化分析
在 Contour 分析中使用参数(Parameters),可以轻松切换数据和结果的不同视图。例如,假设有一个数据集记录了不同时间和门店位置的食品销售情况。对于每种食品,我们想对其销售数据进行分析。与其为每种食品创建单独的分析路径并重复工作,不如使用参数来切换食品种类。
创建参数
使用界面左侧的侧边栏创建参数。支持的类型包括日期(Date)、字符串(String)和数字(Number)。这里我们创建一个Item参数,默认值为Sandwich。当您或其他人打开此分析时,Item参数的默认值将为Sandwich。编辑者和查看者可以选择覆盖此参数来查看其他食品的数据。
:::callout{theme="neutral" title="添加参数"} 添加新参数并在分析中使用后,请确保更新所有下游路径,以便任何关联的报表(Report)都能同步更新新添加的参数。 :::
多值参数
要允许参数同时接受多个值,请在参数设置中开启允许多个值(Allow multiple values)选项。此选项适用于字符串和数字参数,但不适用于日期参数。
请注意,在表达式面板(Expression Board)中,多值参数会被视为其值的数组,即使只为参数指定了一个值或没有指定值。当启用参数的多值功能时,您可能需要更新所有使用该参数的表达式,以确保期望的数据类型为数组(Array)。
在转换中使用参数
参数可以在筛选面板(Filter)或表达式面板(Expression Board)中使用。
假设我们想通过生成数据透视表(Pivot Table)来可视化数据,展示每种食品在每个地点的销售情况。首先,我们需要筛选数据集,只保留食品名称等于Item参数值的行。在筛选面板中,点击向下箭头会显示可用参数列表,然后选择Item参数。
我们还想生成另一个可视化图表,比较该食品与其他所有食品的销售情况。我们需要创建一个新列,当销售的是该食品时值为True,否则为False。
在表达式面板中,通过引用$parameter_name(注意美元符号)来使用参数。我们可以添加一个条件判断语句来创建这个新列,如下所示。
编辑参数
如果您想更改参数的名称、类型、默认值或是否接受多个值,请点击铅笔图标进行编辑。
请注意,编辑参数将改变所有查看者和编辑者在该分析中看到的内容。如果您想快速尝试某个参数值而不更改默认值,可以按照下文描述的方式覆盖参数值。
建议值
有时参数的有效选项可能来自已知集合。您可以通过将参数链接到分析中包含的数据集(dataset)或受限视图(restricted view)的列,或手动输入值列表,来为参数提供建议值。首先,在参数编辑器底部开启从链接列建议值(Suggest values from linked column)选项。
接下来,您可以通过选择或手动输入值(Or enter values manually)来添加手动值集合。这将打开一个对话框,您可以在其中逐行输入参数的建议值。
或者,打开链接到列的值(Link to values of a column)下拉菜单,会显示分析中起始面板(starting boards)包含的所有数据集和受限视图列表。将鼠标悬停在某个数据集或受限视图上,会弹出嵌套菜单,显示该资源的列。
上述截图中的数据集使用了联合国粮农组织的开源数据 ↗。
选择一列并保存参数。在参数概览中,当您点击该参数的输入字段时,应该会看到建议值列表。这将提供从保存的列中计算出的最多1000个唯一值。
交叉筛选组
如果您有多个字符串参数来自单个数据集或受限视图的不同列,可以将这些参数添加到一个交叉筛选组(cross-filtering group)中。在交叉筛选组中,每个参数的选择将过滤其他参数显示的建议值。将参数链接到资源的列后,您会看到出现一个新区域,允许您将该参数添加到组中:
点击下拉菜单并选择创建新的交叉筛选组(Create new cross-filtering group)。为组命名(在此示例中为"Location parameters")。记得保存参数。现在,您可以编辑链接到同一数据集的另一个参数,并通过从下拉菜单中选择将其添加到该组。
保存参数并返回编辑器。这些参数现在将一起显示在"Location parameters"标题下。为其中一个参数做出选择,然后点击第二个参数。第二个参数的建议值将相应更新。
请注意,1000个唯一值的限制适用于整个组,而不是组内的单个参数。如果一对列之间有超过1000个唯一值对,则并非所有可能的建议值都可用。
覆盖参数值
您可以通过在左侧边栏中手动输入参数值来临时覆盖参数的值。这对于查看分析如何随值的变化而更新非常有用,而无需为所有查看者更新默认值。
应用此更改后,请注意参数会被标记为已覆盖(Overridden)。使用顶部栏中的箭头可以将所有参数值重置为默认值。
覆盖参数值将一直持续到您刷新页面,并且不会影响其他用户看到的内容。
Contour 仪表板中的参数
如果您添加到 Contour 仪表板(Contour dashboard)的任何面板依赖于某个参数,该参数将自动显示在 Contour 仪表板中。这意味着,如果分析中存在某个参数但仪表板中的面板未使用它,则该参数不会出现在仪表板中。
在 Contour 仪表板中,用户可以覆盖参数值以查看数据的不同视图。了解更多关于 Contour 仪表板的信息。
在 Contour 仪表板和分析之间导航时,参数值将被保留。如果您在仪表板中覆盖了参数值,并想更深入地探究其来源路径,点击返回分析(Back to analysis)按钮将保留覆盖后的参数值。
Foundry 报表中的参数
在 Contour 分析中创建参数后,您也可以在旧版 Foundry 报表(Foundry Reports) 应用程序中使用它。但是,报表不支持链接到受限视图列的参数或交叉筛选组——这些功能仅在 Contour 分析和 Contour 仪表板中可用。如果您将链接到受限视图的参数添加到报表中,则不会填充建议值。如果您将交叉筛选组中的参数添加到报表中,默认情况下报表参数将链接到同一数据集列,但不会根据 Contour 交叉筛选组中其他参数的选择进行交叉筛选。