Add a board(添加面板)
Contour's toolbar is always located at the bottom of your analysis path and allows you to select boards to be applied to your dataset. Clicking a board in the toolbar will add the board to your path.
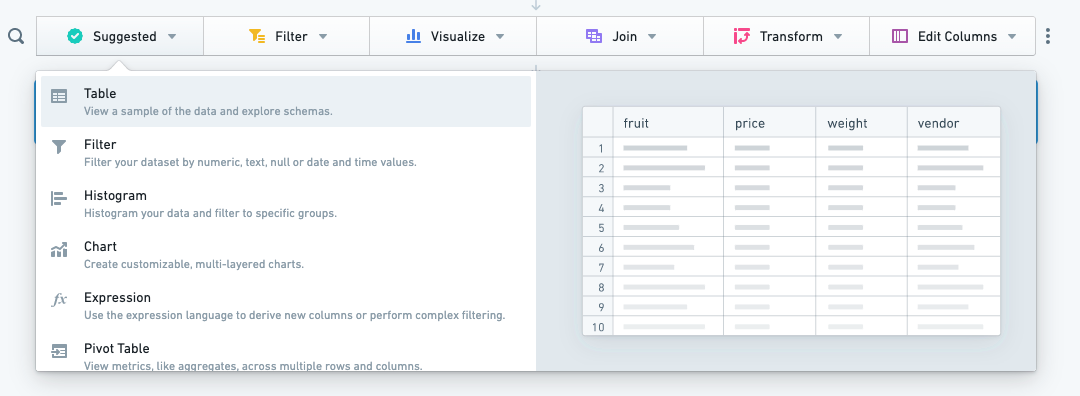
Category mode
Category mode is the default mode for the toolbar, where all the available boards can be easily found grouped by their functionality. You will notice that some boards appear in multiple categories, as they have multiple functionalities. The categories are:
- Suggested: The most popular boards in Contour. Consult the suggested boards if you are unsure where to start with your analysis.
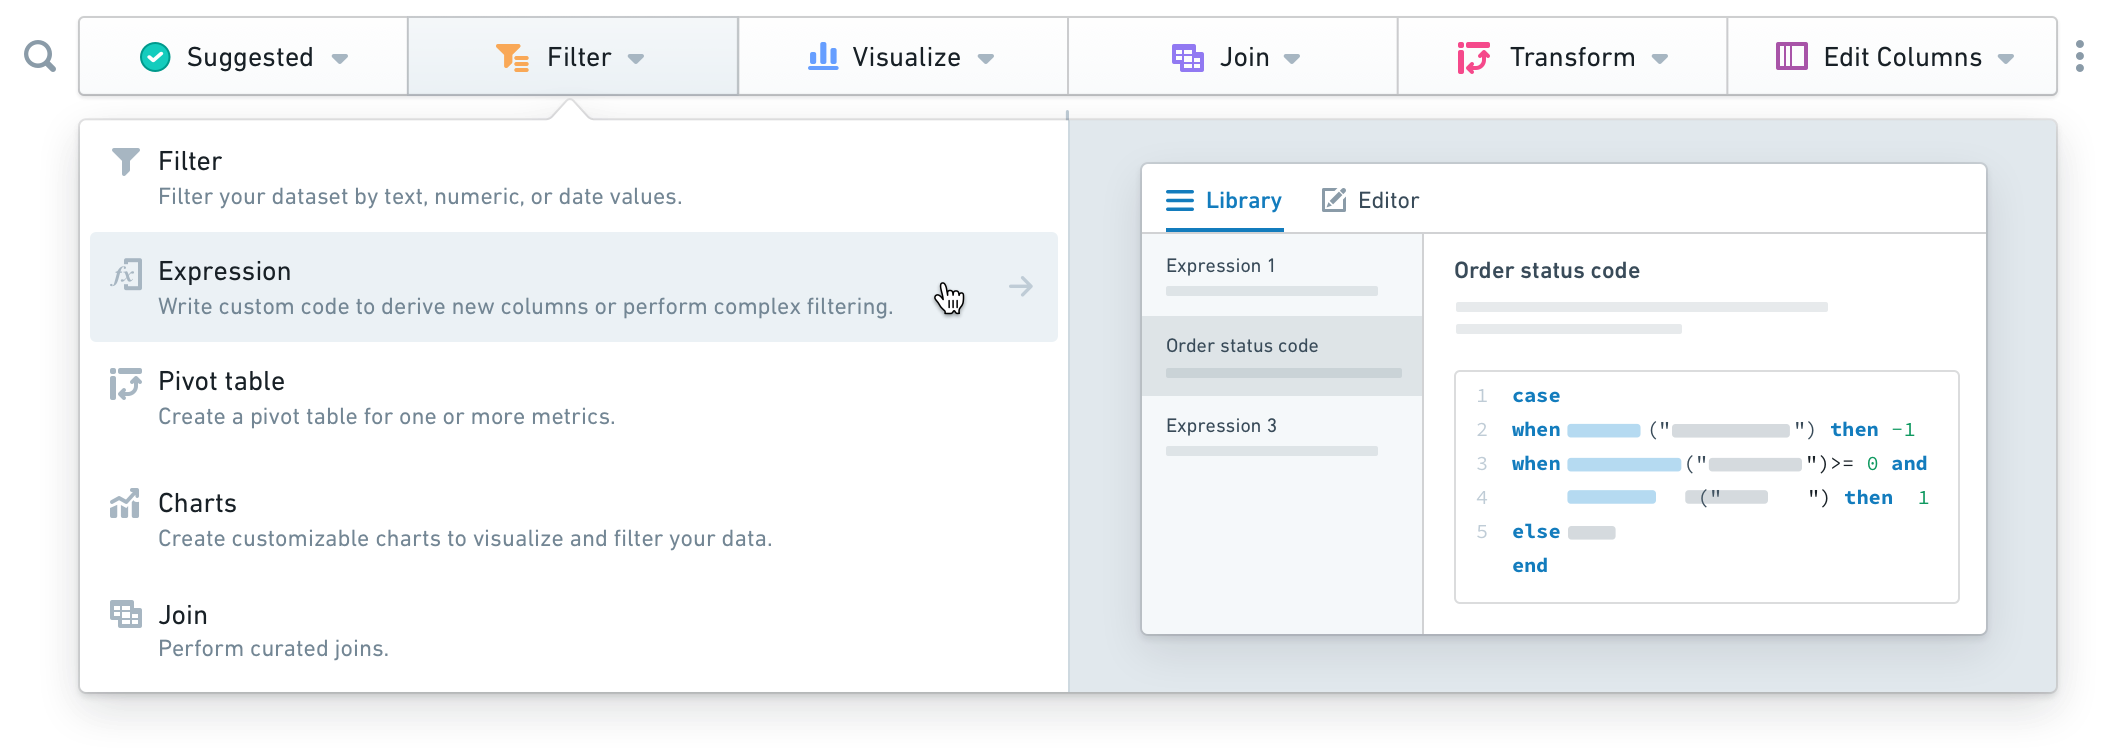
- Filter: Filter columns, make selections in visualizations or write more complex filter expressions.
- Visualize: Display your data in different visual forms (such as a histogram, a heatmap with geographic data, a pie chart, or a pivot table).
- Join: Join to bring in more data or alter your dataset based on another set.
- Transform: Change the schema of your data, find and replace or obfuscate text, derive new columns, or perform other transformations.
- Edit Columns: Combine, duplicate, remove, rename, or split columns in your dataset.
Search mode
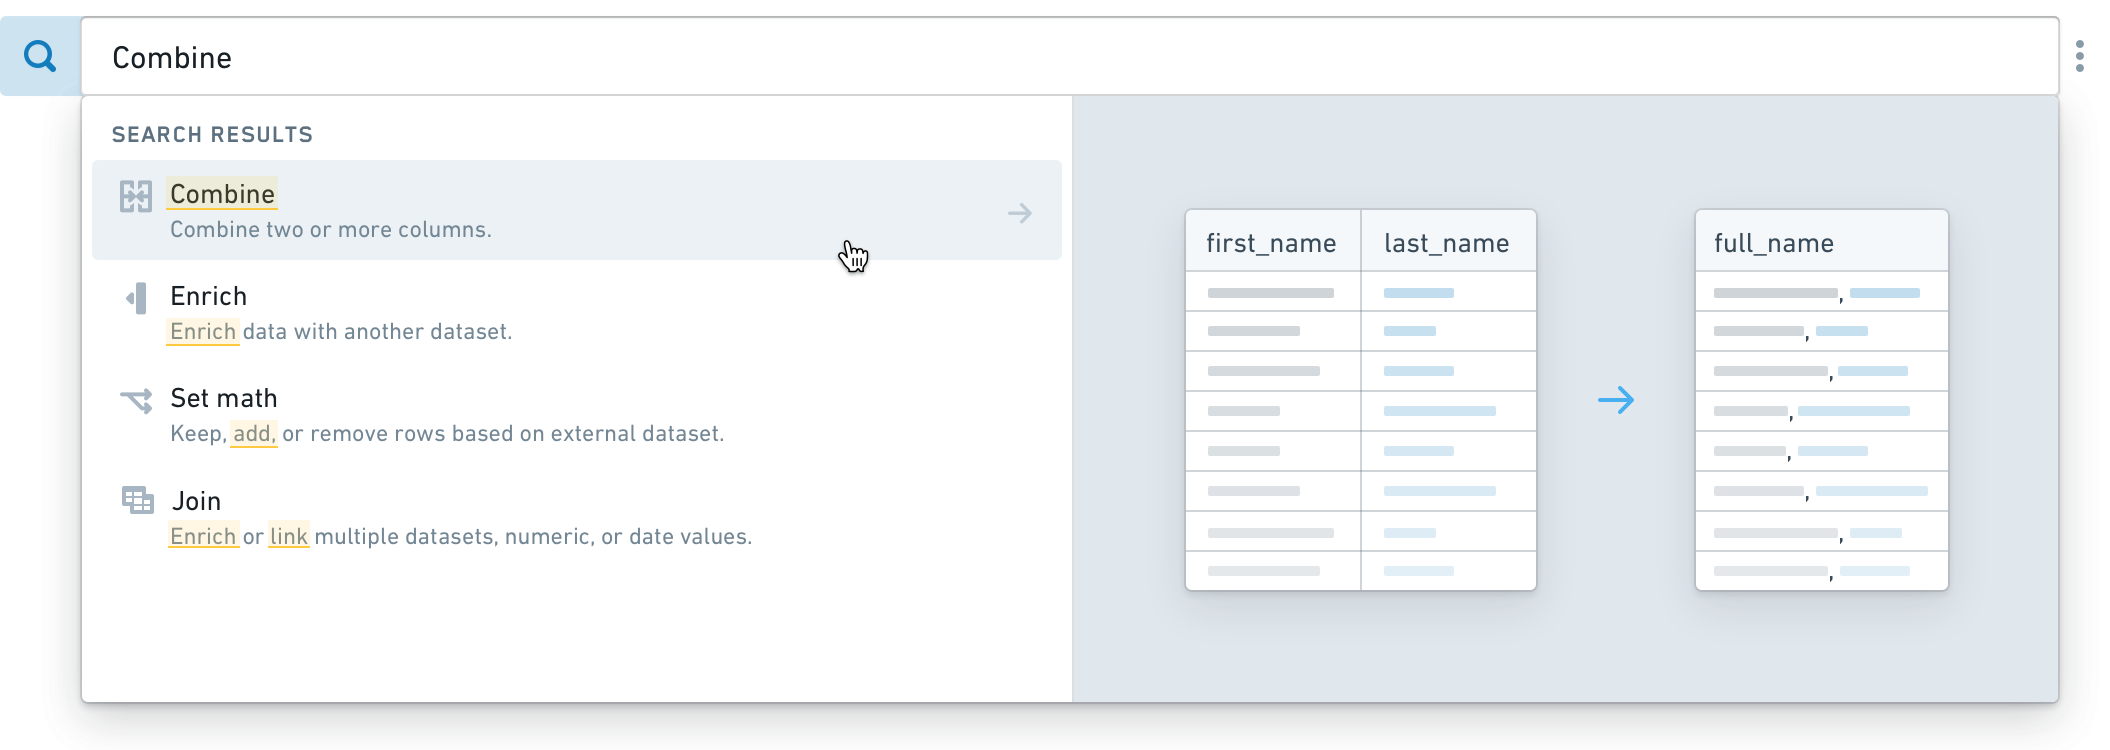
Search mode allows you to search for a desired board based on its functionality or a keyword. To turn on search mode, click on the magnifying glass icon ( ). Alternatively, you can use keyboard shortcuts to enter the search mode (Ctrl+Enter on Windows or Cmd+Enter on macOS). The matching results will appear in the dropdown, with the keyword or a related word highlighted.
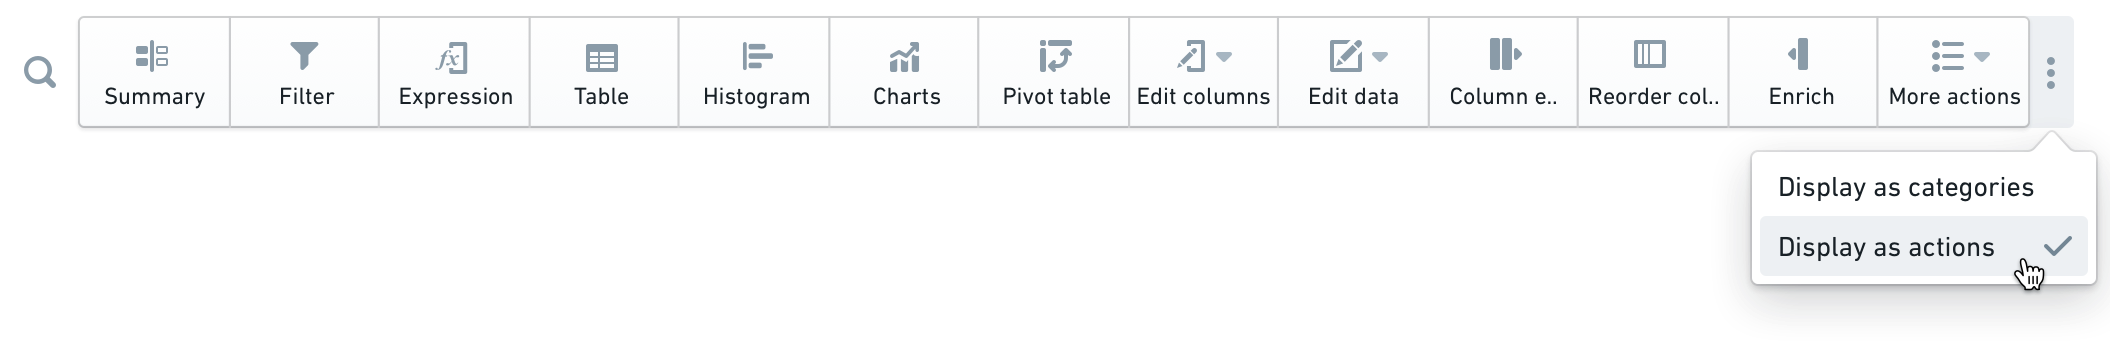
Actions mode
You also have an option to switch the toolbar to Actions Mode by clicking on the More button (...) on the right side of the toolbar. In this mode, the toolbar displays all boards at once, rather than nested in categories.
Inserting boards
If you would like to add a board elsewhere in the analysis, hover on the desired position and click. A menu with all the available boards will appear where you can search for a board by name or click to select a board from the list.
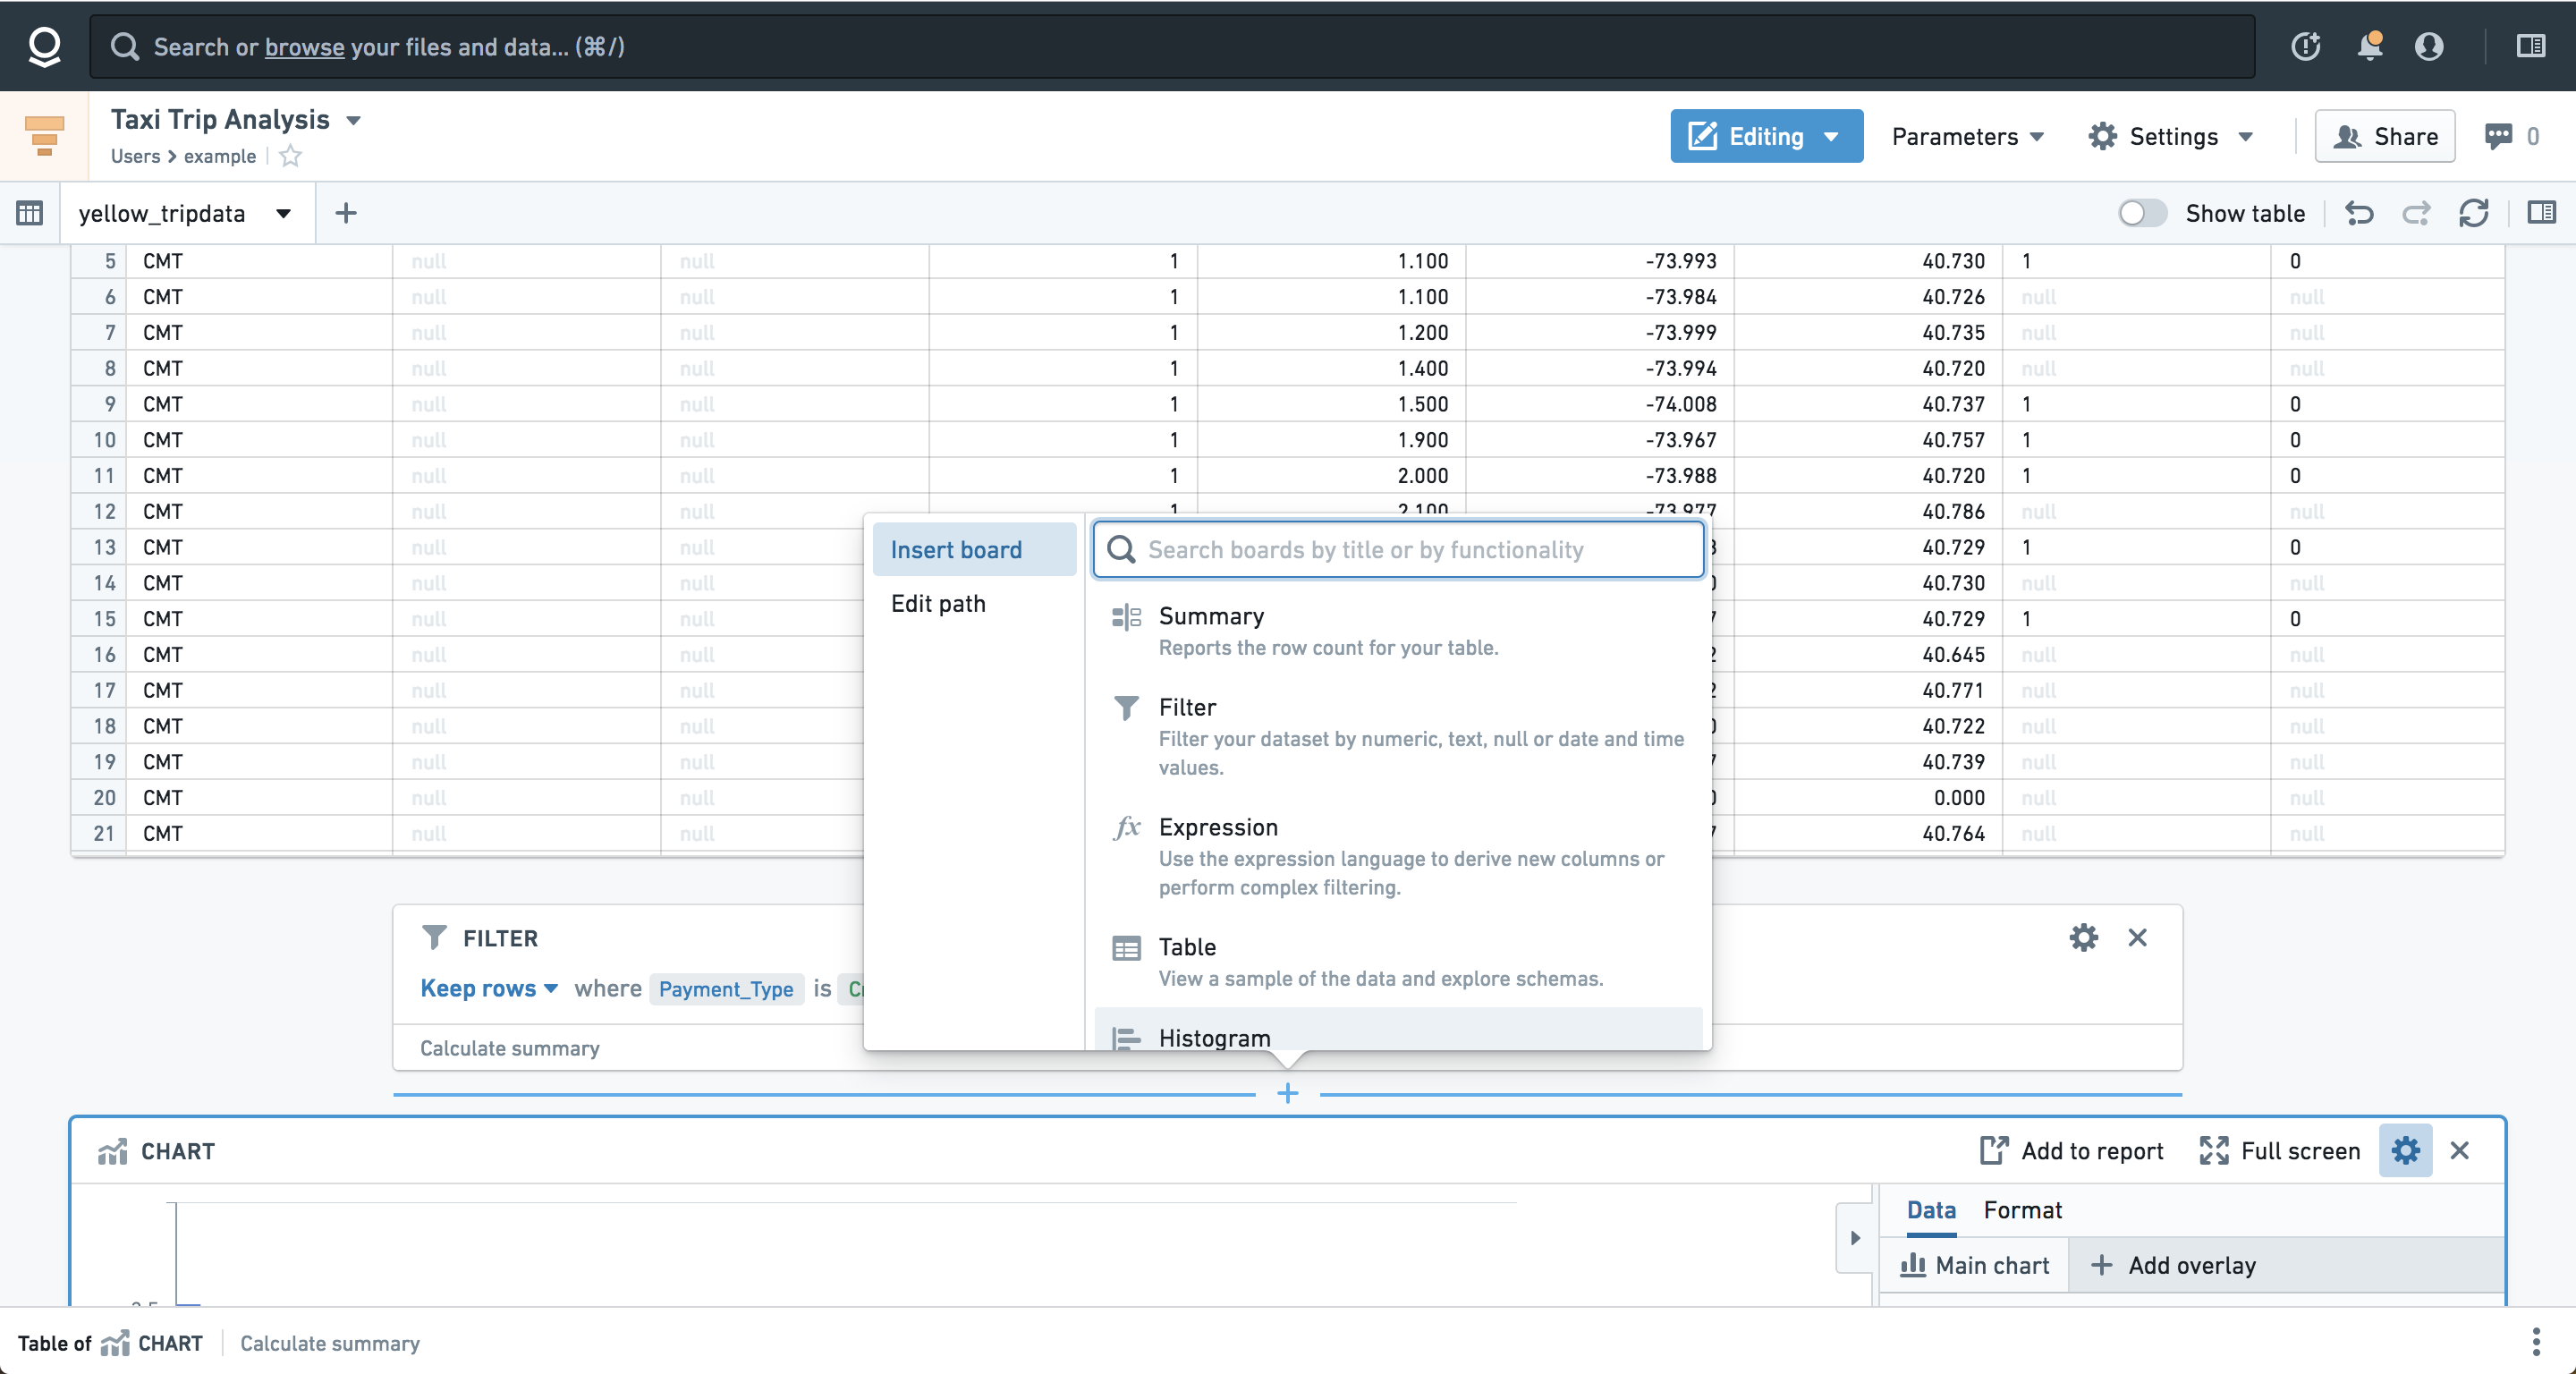
These screenshots use open source data from the NYC Taxi & Limousine Commission ↗.
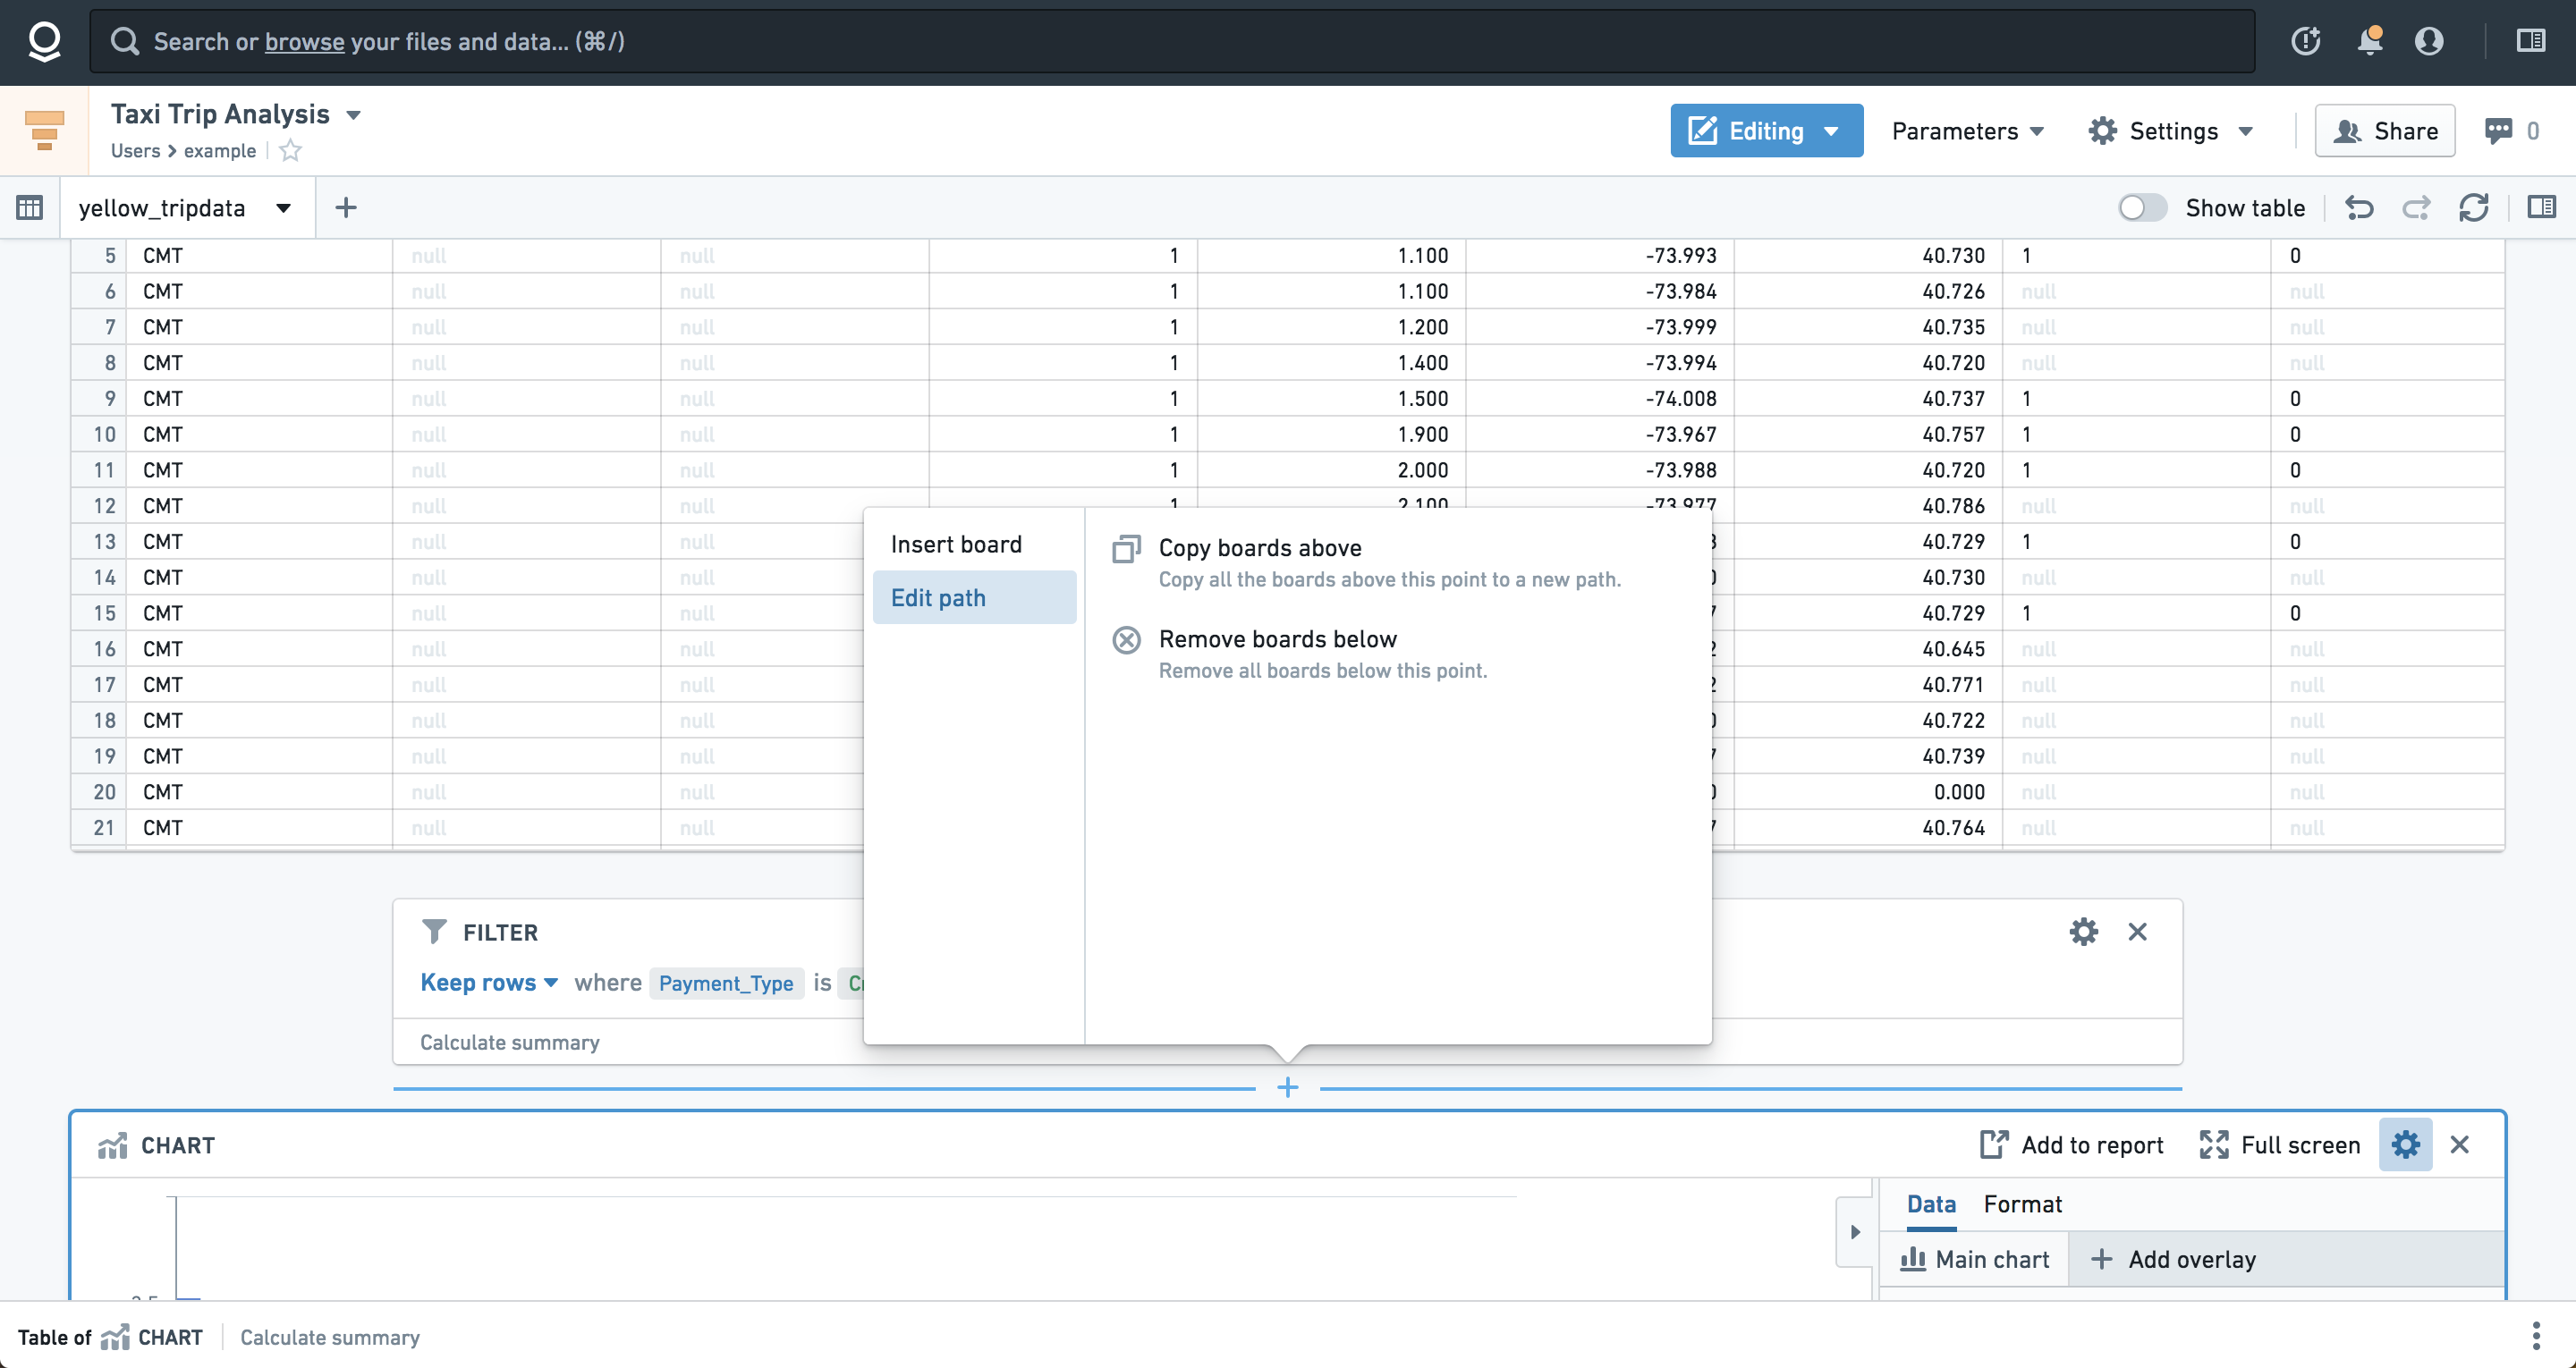
Remove or copy boards in bulk
If you'd like to remove or recreate a set of boards in bulk, hover over and click the space between two boards, and then select Edit path. A menu will appear with options to copy the boards above to a new path within the analysis or remove the boards below.
中文翻译
添加面板
Contour 的工具栏始终位于分析路径的底部,允许您选择要应用于数据集的面板(Board)。点击工具栏中的某个面板,即可将其添加到您的分析路径中。
分类模式(Category Mode)
分类模式是工具栏的默认模式,所有可用面板按功能分组,便于查找。您可能会注意到某些面板出现在多个分类中,因为它们具有多种功能。 分类包括:
- 建议(Suggested): Contour 中最常用的面板。如果您不确定从何处开始分析,可以参考建议面板。
- 筛选(Filter): 筛选列、在可视化中进行选择或编写更复杂的筛选表达式。
- 可视化(Visualize): 以不同的视觉形式展示数据(如直方图、地理数据热力图、饼图或透视表)。
- 连接(Join): 连接以引入更多数据,或基于另一数据集修改当前数据集。
- 转换(Transform): 更改数据模式、查找替换或混淆文本、派生新列,或执行其他转换操作。
- 编辑列(Edit Columns): 合并、复制、删除、重命名或拆分数据集中的列。
搜索模式(Search Mode)
搜索模式允许您根据功能或关键词搜索所需面板。要开启搜索模式,请点击放大镜图标()。或者,您也可以使用键盘快捷键进入搜索模式(Windows 系统按 Ctrl+Enter,macOS 系统按 Cmd+Enter)。匹配结果将显示在下拉菜单中,关键词或相关词汇会高亮显示。
操作模式(Actions Mode)
您还可以通过点击工具栏右侧的更多按钮(...),将工具栏切换为操作模式。在此模式下,工具栏会一次性显示所有面板,而非按分类嵌套展示。
插入面板
如果您想在分析路径的其他位置添加面板,请将鼠标悬停在目标位置并点击。此时会弹出一个菜单,显示所有可用面板,您可以通过名称搜索面板,或从列表中点击选择。
这些截图使用了来自纽约市出租车与豪华轿车委员会 ↗ 的开源数据。
批量移除或复制面板
如果您想批量移除或重新创建一组面板,请将鼠标悬停在两个面板之间的空白区域并点击,然后选择编辑路径(Edit path)。此时会弹出一个菜单,提供将上方面板复制到分析路径中的新位置,或移除下方面板的选项。