Filter data(筛选数据)
You can use many of Contour's visualization boards to filter as well as visualize data. This document explores how to use the histogram, filter, and chart boards to do so. Advanced users may want to look at Contour’s expression language for more powerful filtering options. The screenshots on this page use open source aviation data.
Histogram board
The histogram is one of the simplest ways to filter, and is recommended for visually exploring an unfamiliar dataset.
After creating a histogram, simply click on the bars to filter on them:
After selecting bars in the histogram, the bottom of the histogram will say Keep rows where column_name is value. This tells you that your working dataset has been filtered down to just the rows that have that value in that particular column. (You can use the dropdown selector to change Keep to Remove if you want to keep only rows that do not have that value.)
You can use multiple histograms in sequence to perform more complex filtering:

Filter board
The filter board works best when you already know what you’re looking for. The filter board is very flexible and lets you input exactly what you want to filter.
Add a filter board by choosing Filter from the action ribbon:
Click Add filter and select the name of the column on which you want to filter (you can start typing the column name to find it more quickly). Enter the values you want to filter to and add each value with the Enter key. Then click Save when you’re finished adding filters.
Use Keep if you want to filter down to only data that meet the set criteria, as shown below:
Use Remove if you want to exclude only data that meet the set criteria, as shown below:
Advanced comparisons
The above examples simply check whether a column value contains a word or phrase. However, there are many other comparisons available. Click where it says contains to see the full list, divided by category (click the heading names to change categories)
If you choose a column of a particular type (like a date or a number), Contour will automatically select the appropriate category for you:

Multiple data filters
- Use AND MATCHING if you want to filter to data that meet multiple conditions at the same time.
- Use OR MATCHING if you want to filter to data that meet multiple conditions but not necessarily at the same time/within the same row of data.
Adjusting filters
When someone creates a new analysis for a specific filter (e.g. carrier_code = DL), other people can easily replicate their analysis by changing the filter to their use case (e.g. carrier_code = UA) or removing the filter all-together to perform a global analysis.
:::callout{theme="neutral"} In Foundry, analytical operations are applied to an entire column by default, in order to facilitate analysis of large datasets. If you would like to run an analysis on a smaller selection of rows (similar to selecting a specific cell range in Excel), filter the data down to the desired rows before applying the operations. :::
Wildcards in string filters
Some string filter types support the use of ? and * as wildcards. ? represents exactly one arbitrary character, while * represents a sequence of any number of arbitrary characters (that number can be 0).
The filters that support the use of wildcards are the following:
containscontains (with wildcards)is (with wildcards)
Despite the unintuitive naming, both contains and contains (with wildcards) support wildcards. The difference between these two filters is that contains allows wildcard characters to be escaped with two forward slash characters (\\), while contains (with wildcards) does not allow wildcard characters to be escaped. For example, a contains filter with value apples\\*pears will match the string apples*pears but not the string apples_pears. Conversely, there is no way to construct a filter that matches apples*pears but not apples_pears using a contains (with wildcards) filter, because the contains (with wildcards) filter will always treat * as a wildcard.
Because this difference in behavior between contains and contains (with wildcards) may not be obvious, Contour analyses with filter logic that depend upon this behavior can be difficult to understand and maintain. If you need to express a complex string match condition, we suggest using a matches (regular expression) filter instead of a contains filter with wildcard escaping.
Chart board
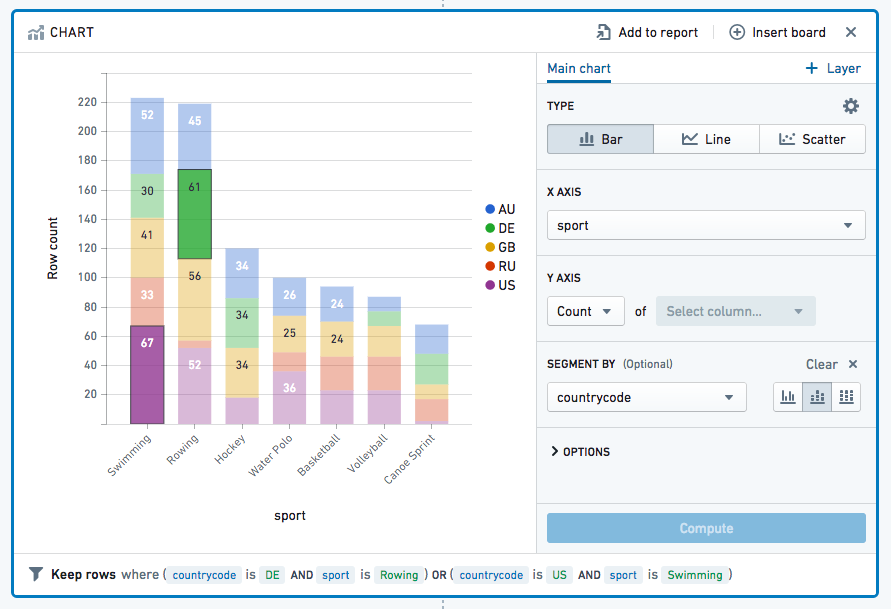
You can filter data on the chart by clicking on the chart area you'd like to filter; hold Ctrl on Windows or Cmd on macOS and click to select multiple segments. This will filter your working dataset down to your selection (similar to the behavior of histograms).
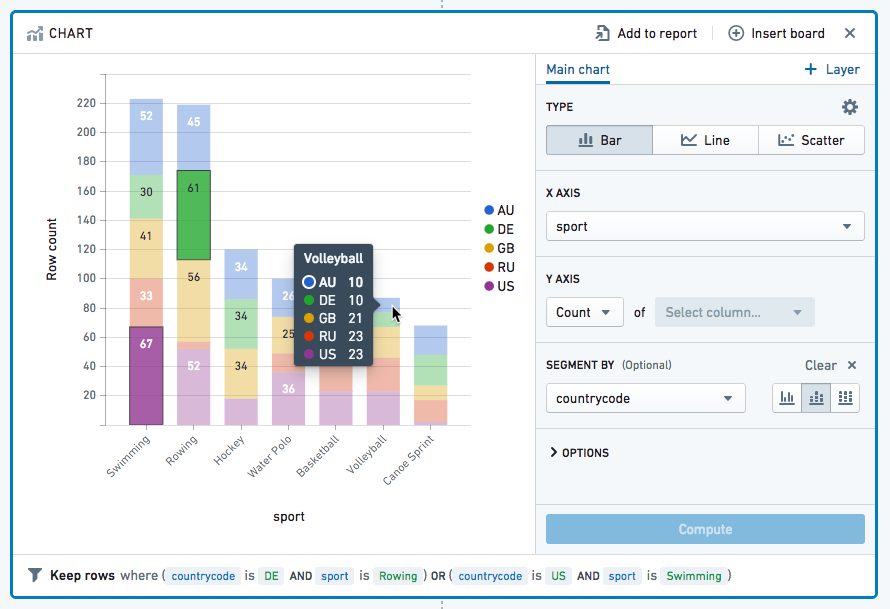
Hover the mouse cursor over a piece of data to see a key with the exact figure:
中文翻译
筛选数据
您可以使用 Contour 的许多可视化面板(visualization board)来筛选和可视化数据。本文将介绍如何使用直方图(histogram)、筛选器(filter)和图表(chart)面板来实现这一目的。高级用户可参考 Contour 的表达式语言,以获取更强大的筛选选项。本页截图均使用开源航空数据。
直方图面板
直方图是最简单的筛选方式之一,建议用于直观探索不熟悉的数据集。
创建直方图后,只需点击条形即可进行筛选:
在直方图中选中条形后,直方图底部会显示保留 column_name 为 value 的行。这表示您的工作数据集已筛选为仅包含该列中具有该值的行。(您可以使用下拉菜单将保留改为移除,以仅保留不包含该值的行。)
您可以依次使用多个直方图进行更复杂的筛选:
筛选器面板
当您已明确要查找的内容时,筛选器面板最为适用。该面板非常灵活,可让您精确输入筛选条件。
通过操作栏(action ribbon)选择筛选器来添加筛选器面板:
点击添加筛选器,选择要筛选的列名称(可输入列名快速查找)。输入要筛选的值,并按 Enter 键添加每个值。完成筛选条件添加后,点击保存。
使用保留可仅保留符合设定条件的数据,如下所示:
使用移除可排除符合设定条件的数据,如下所示:
高级比较
上述示例仅检查列值是否包含某个单词或短语。但 Contour 还提供许多其他比较方式。点击包含可查看完整列表,并按类别分组(点击类别名称可切换类别):
如果选择特定类型的列(如日期或数字),Contour 会自动为您选择相应的类别:
多重数据筛选
- 使用AND MATCHING可筛选同时满足多个条件的数据。
- 使用OR MATCHING可筛选满足多个条件但不必同时满足(即不必在同一行数据中)的数据。
调整筛选条件
当某人为特定筛选条件(例如 carrier_code = DL)创建新分析时,其他人可通过将筛选条件改为自己的用例(例如 carrier_code = UA)或完全移除筛选条件以进行全局分析,轻松复现该分析。
:::callout{theme="neutral"} 在 Foundry 中,分析操作默认应用于整个列,以便于分析大型数据集。如果希望对较小的行范围进行分析(类似于在 Excel 中选择特定单元格区域),请先筛选数据至所需行,再应用操作。 :::
字符串筛选中的通配符
部分字符串筛选类型支持使用 ? 和 * 作为通配符。? 代表恰好一个任意字符,而 * 代表任意数量的任意字符序列(数量可为 0)。
支持通配符的筛选器如下:
包含包含(带通配符)等于(带通配符)
尽管命名可能不够直观,但 包含 和 包含(带通配符) 均支持通配符。两者的区别在于:包含 允许使用两个正斜杠字符(\\)对通配符进行转义,而 包含(带通配符) 不允许转义通配符。例如,值为 apples\\*pears 的 包含 筛选器会匹配字符串 apples*pears,但不会匹配 apples_pears。相反,使用 包含(带通配符) 筛选器无法构造出匹配 apples*pears 但不匹配 apples_pears 的筛选条件,因为该筛选器始终将 * 视为通配符。
由于 包含 和 包含(带通配符) 之间的这种行为差异可能不明显,依赖此行为的 Contour 分析筛选逻辑可能难以理解和维护。如需表达复杂的字符串匹配条件,建议使用 匹配(正则表达式) 筛选器,而非带通配符转义的 包含 筛选器。
图表面板
您可以通过点击图表中要筛选的区域来筛选数据;在 Windows 上按住 Ctrl 键,或在 macOS 上按住 Cmd 键并点击可选择多个区域。这将把您的工作数据集筛选为所选区域(与直方图的行为类似)。
将鼠标悬停在数据点上可查看包含精确数值的图例: