Boards(看板(Boards))
Boards are the key element of Contour's functionality, allowing the user to perform analysis and filters on the input dataset or perform joins with another dataset. The fundamental analytical action in Contour is the application of one or more boards to your data. Each board provides a different possible visualization and/or data manipulation action. Data flows down through the applied boards from the top of a Contour path to the bottom.
Common operations that can be performed on small datasets with spreadsheets can be accomplished at scale in Contour using boards, including but not limited to filtering data, creating pivot tables, creating charts, performing lookups, and creating custom formulas.
Capabilities of Contour boards include:
- Visualize: Display your data in different forms (a histogram, a heatmap with geographic data).
- Filter rows: Filter your dataset using regular expressions or with built-in date, number, and null comparisons.
- Aggregate: Calculate aggregate metrics about your data (for example, calculate the mean value of data in a particular column).
- Manipulate columns: Add columns from other datasets, derive new columns or remove unneeded columns.
- Remove duplicates: Remove duplicate rows from your dataset. Duplicate rows may exist in the source dataset or result from operations like removing columns or joining to another set.
- Combine with other datasets: Join to or perform set math operations with other datasets.
- Transform data: Obfuscate sensitive values or find and replace text.
Next steps:
- For a guided tutorial to several boards, see Getting started.
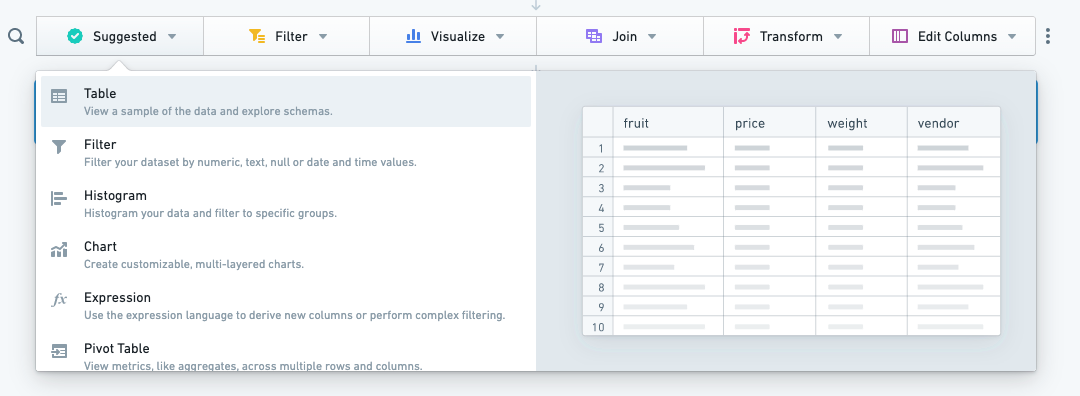
- Learn more about how to add boards from the toolbar.
- See the board descriptions for details on all Contour boards.
中文翻译
看板(Boards)
看板是 Contour 功能的核心要素,用户可通过看板对输入数据集执行分析和筛选,或与其他数据集进行连接。Contour 中的基本分析操作是对数据应用一个或多个看板。每个看板提供不同的可视化效果和/或数据操作功能。数据从 Contour 路径的顶部向下流经所应用的看板,直至底部。
在电子表格中对小型数据集执行的常见操作,可通过 Contour 中的看板实现规模化处理,包括但不限于数据筛选、创建数据透视表、生成图表、执行查找以及创建自定义公式。
Contour 看板的功能包括:
- 可视化(Visualize): 以不同形式展示数据(如直方图、带地理数据的热力图)。
- 筛选行(Filter rows): 使用正则表达式或内置的日期、数字和空值比较功能筛选数据集。
- 聚合(Aggregate): 计算数据的聚合指标(例如,计算特定列中数据的平均值)。
- 操作列(Manipulate columns): 从其他数据集添加列、派生新列或移除不需要的列。
- 去重(Remove duplicates): 移除数据集中的重复行。重复行可能存在于源数据集中,也可能由删除列或与其他数据集连接等操作产生。
- 与其他数据集合并(Combine with other datasets): 与其他数据集进行连接或执行集合运算。
- 数据转换(Transform data): 混淆敏感值,或执行查找与替换文本操作。
后续步骤:
- 如需多个看板的引导式教程,请参阅入门指南。
- 了解如何从工具栏添加看板。
- 查看看板说明,了解所有 Contour 看板的详细信息。