Verify results(验证结果)
In Contour, you can use various boards to check the dataset produced by your analysis. Some of the simplest ways to check results are:
Using the Table board
By inserting a Table board after an analysis, you can quickly check to see if any new columns are correct or if the logic of a previous board resulted in the intended outcome.
Using the Table panel
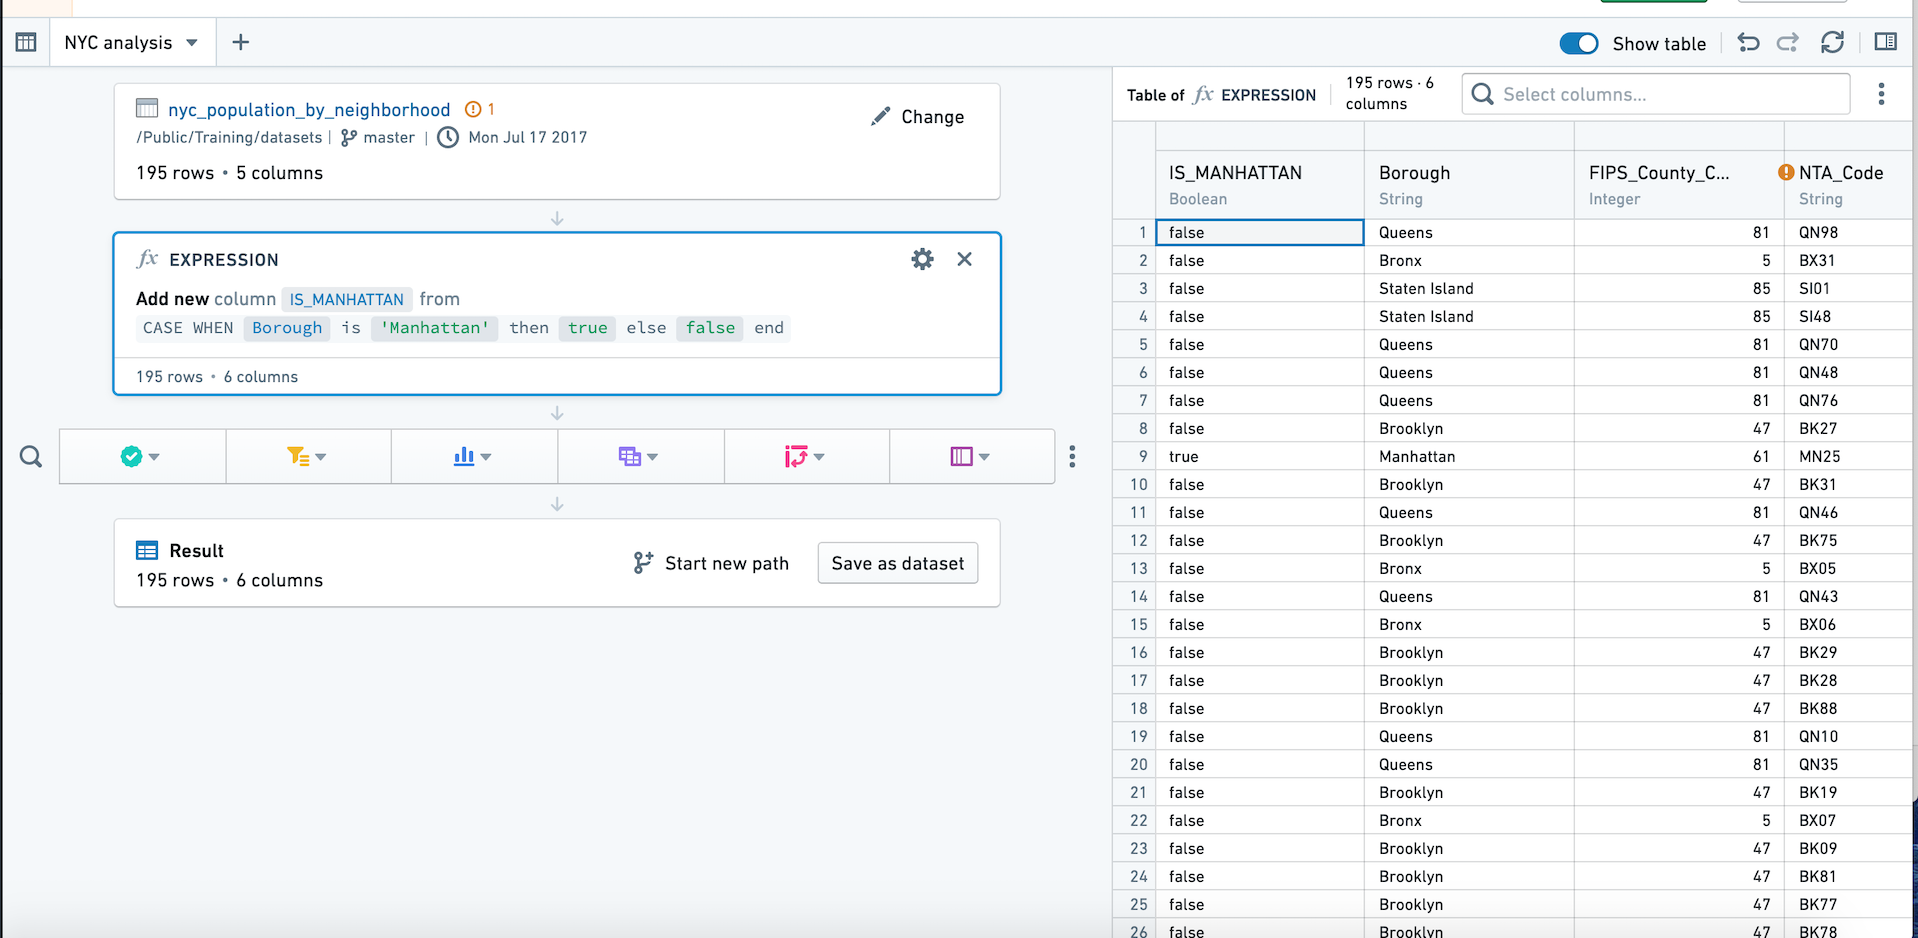
In addition to the path view, which lists the boards you’ve applied to your dataset, Contour also offers a table panel. Using the table panel enables you to see the underlying data in a table as you apply each board.
The table panel makes the table (not boards) the focus, so you can see how the data changes as you add each board. This can be especially helpful when writing expressions.
You can switch to the table panel by clicking Show table in the upper right. Click the button again or click Hide table to return to path view.
Using the Histogram board
Inserting a Histogram board after an analysis provides a quick overview of the different data categories, which can be used for general assessment of the data or to check that the filtered categories are correct.
中文翻译
验证结果
在 Contour 中,您可以使用多种面板(board)来检查分析生成的数据集。以下是一些最简便的结果检查方法:
使用表格面板
在分析步骤后插入一个表格面板,您可以快速检查新增列是否正确,或确认前面面板的逻辑是否产生了预期结果。
使用表格侧栏
除了列出已应用于数据集的面板的路径视图(path view)外,Contour 还提供了表格侧栏。使用表格侧栏,您可以在应用每个面板时,以表格形式查看底层数据。
表格侧栏将表格(而非面板)作为焦点,因此您可以直观地看到数据随每个面板的添加而发生的变化。这在编写表达式时尤其有用。
您可以通过点击右上角的显示表格切换到表格侧栏。再次点击该按钮或点击隐藏表格可返回路径视图。
使用直方图面板
在分析步骤后插入一个直方图面板,可以快速概览不同数据类别,这既可用于对数据进行整体评估,也可用于检查筛选后的类别是否正确。