Getting started(入门指南)
Creating a dashboard
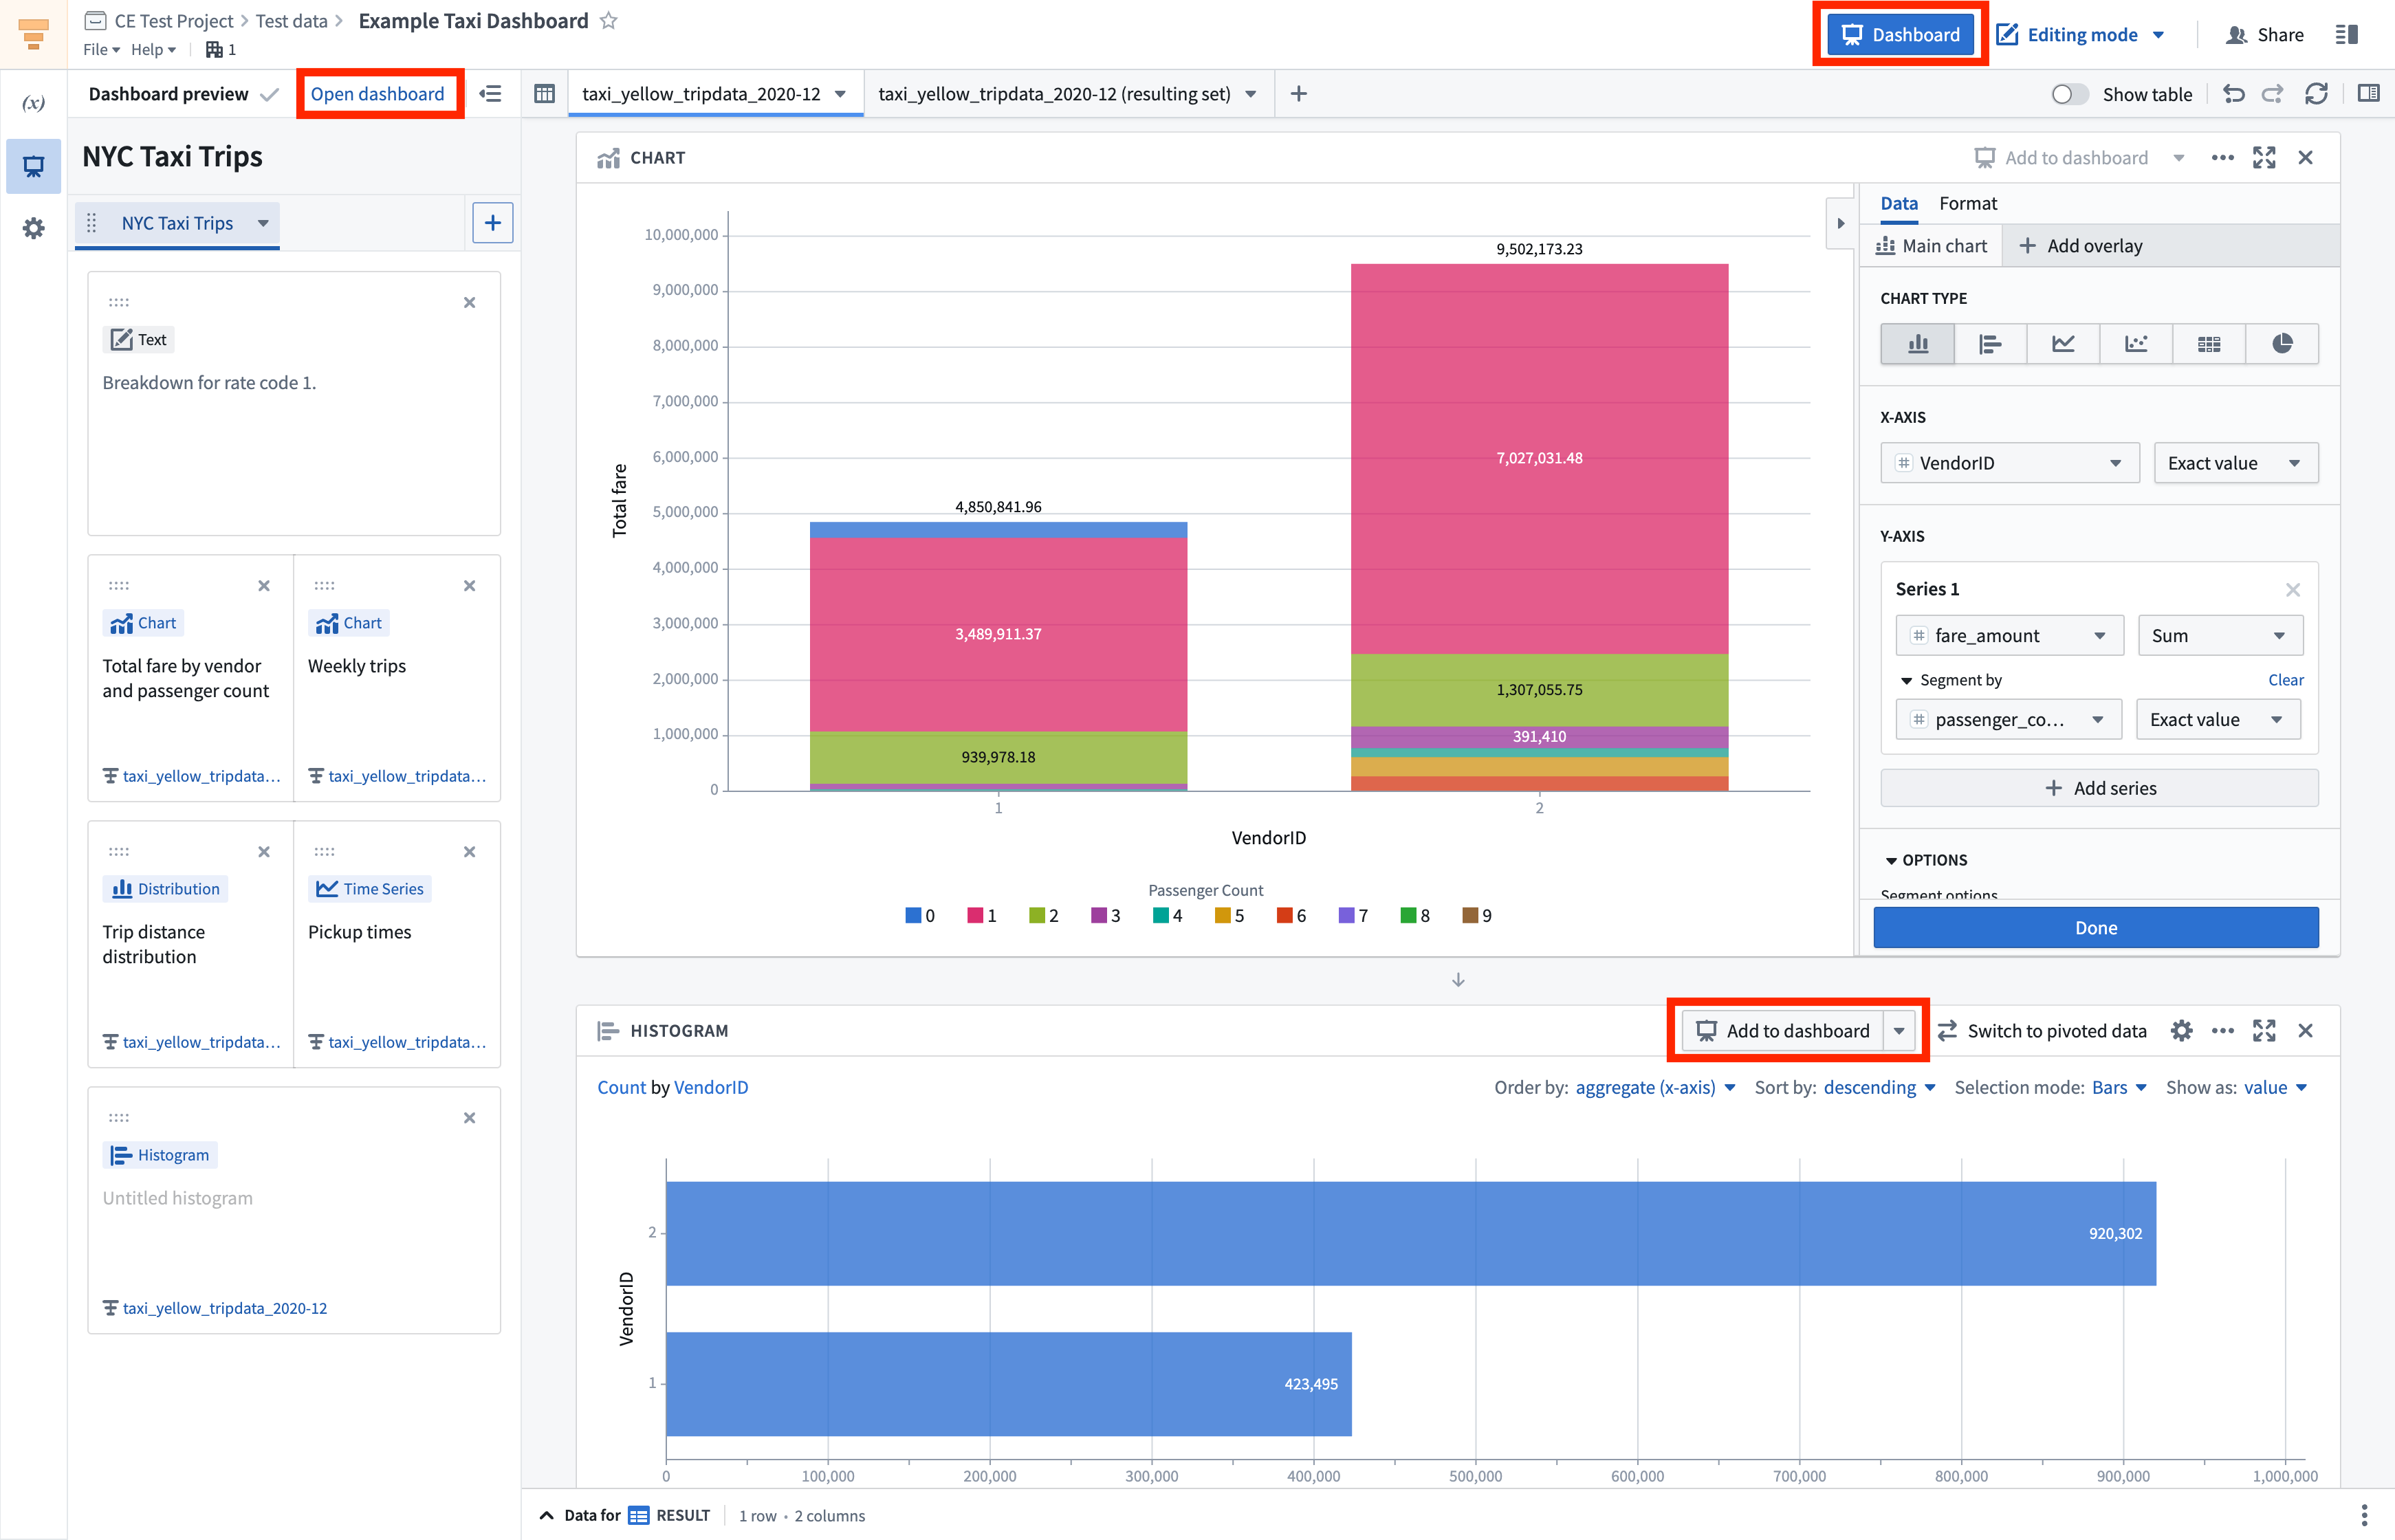
Each Contour analysis is associated with one Contour dashboard. To add a board to the dashboard, click the Add to dashboard button on the top right of the board. The dashboard preview in the left-hand panel will open and from there, you can add board titles, reorder boards using drag and drop, and name the dashboard. You can add all Visualize boards to a dashboard, excluding the Text and Map boards. See Adding text for information on how to add text descriptions directly to a dashboard.
To open the dashboard, select Open dashboard at the top of the dashboard preview panel, or click the blue Dashboard button on the top right of the analysis.
To ensure dashboard viewers always see the latest data when they open the dashboard, enable Refresh analysis data on open in the data setting for an analysis, as shown below.

Editing a dashboard
In edit mode, you can customize the dashboard by:
- Naming tabs, boards, and parameters
- Reordering boards and tabs
- Adding text
- Resizing boards and text
Tabs
You can organize your dashboard into tabs. Tabs can be renamed or dragged into a different order. Boards and text can be dragged from one tab to another.
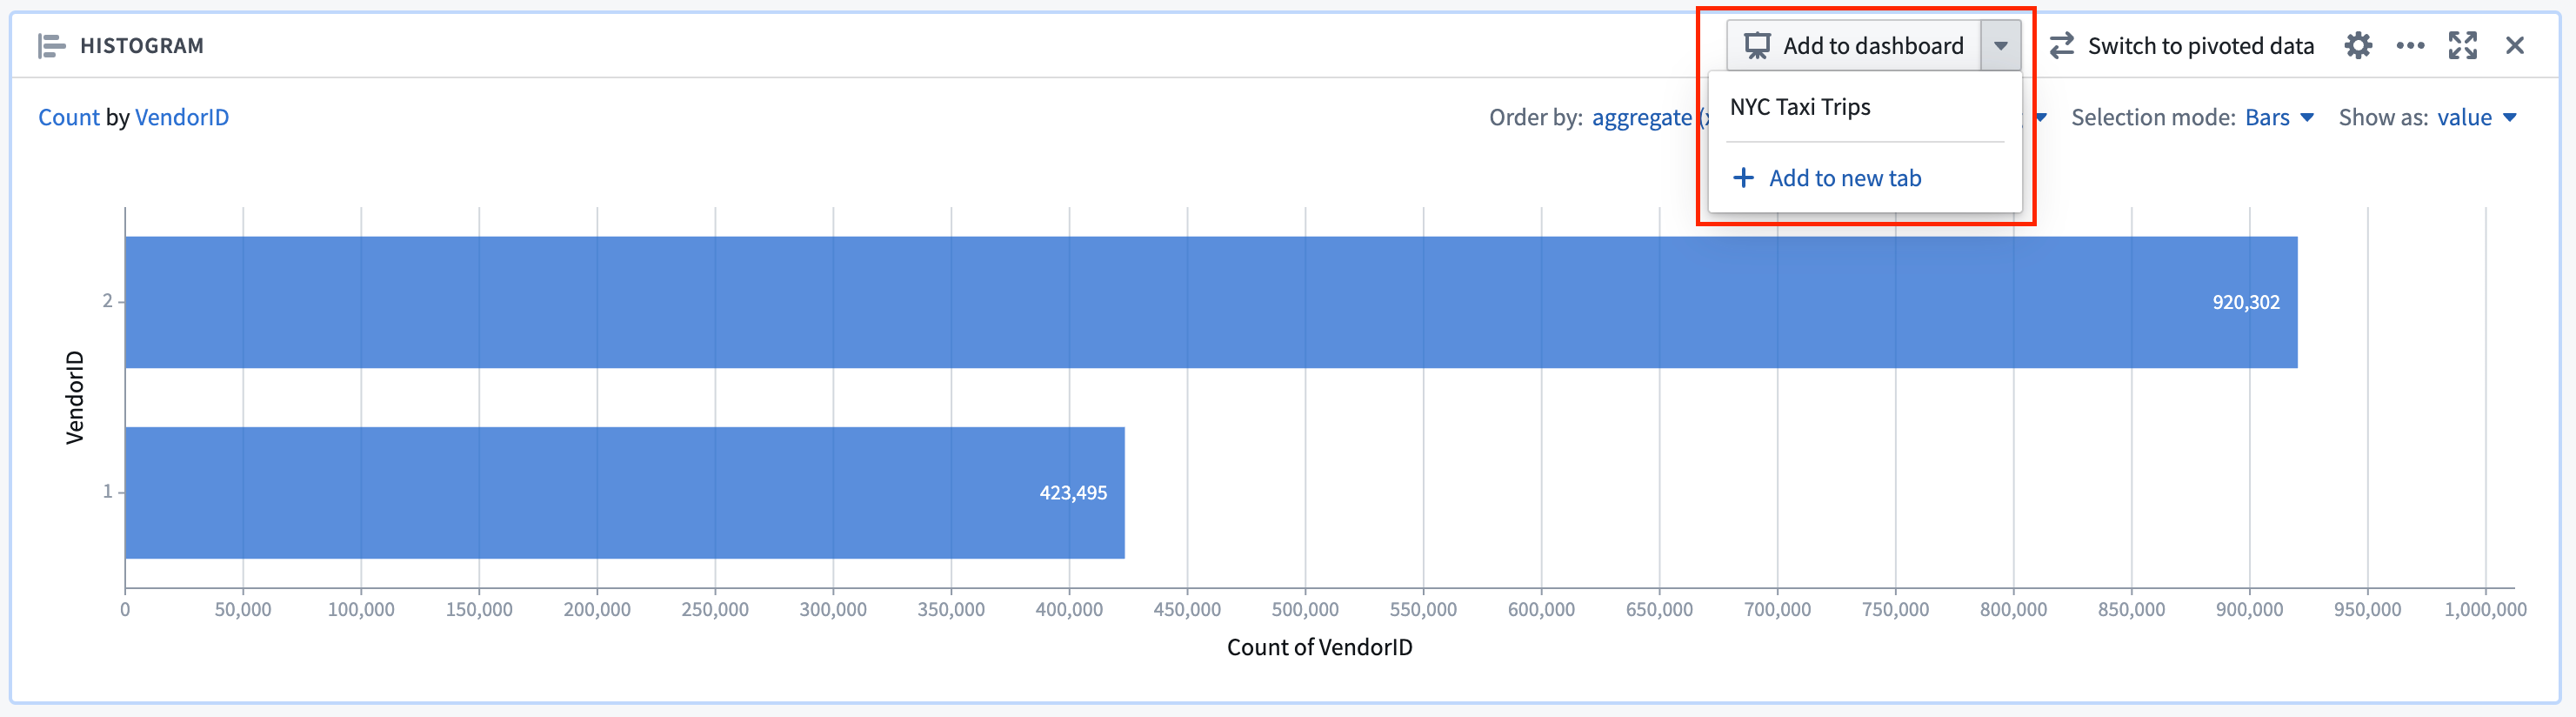
When adding a board to the dashboard, click Add to dashboard to add it to the first available tab. Click the dropdown arrow next to the same button to add the board to a specific tab, or to create a new tab and add the board there.
Board reordering
Board reordering in a dashboard is purely cosmetic and will not impact your underlying analysis. For example, moving a Chart board above a Time series board in a dashboard will not move the corresponding Chart board above the corresponding Time series board in that dashboard’s source analysis. To reorder boards, drag by clicking and holding the leftmost button in the top right button menu for any board, as per below. You can add up to three boards per row.

Adding text
To add text to your dashboard, hover over the area you would like to place the text and click the blue + (plus) sign.
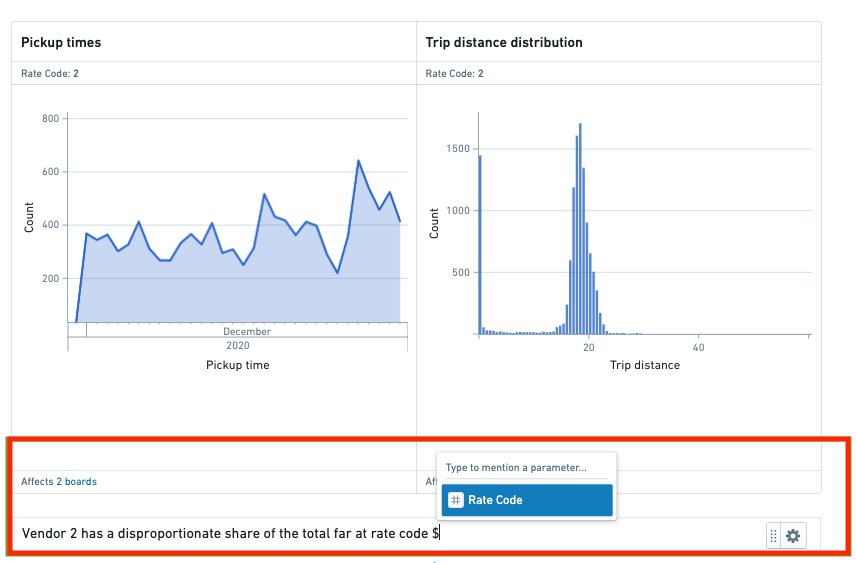
You can use parameters inline in text widgets, board titles, tab titles, and dashboard titles. To access the parameter list, type $ and choose a parameter name. As dashboard editors and viewers make parameter selections in the left panel, inline parameter values in text will update.
Resizing boards and text
When there are multiple boards or text boxes in a row, you can select Expand in the item's settings menu to increase its width. For rows with two items, this will result in a 2/3 - 1/3 layout, and for rows with three items, this will result in a 1/2 - 1/4 - 1/4 layout. To restore an item to its original size, select Collapse in the settings menu. Note that rows can only consist of a single item type - you cannot have a row with both boards and text boxes.
Viewing a dashboard
Dashboard viewers can make temporary dashboard overrides as they explore, such as choosing parameter values and making board selections. These temporary overrides do not persist after the dashboard is reloaded, and will not impact what other viewers see.
Parameter overrides
Dashboard viewers can change parameter values in the left sidebar. Viewers can see which parameters affect a given board in the board header.
Chart to chart filtering
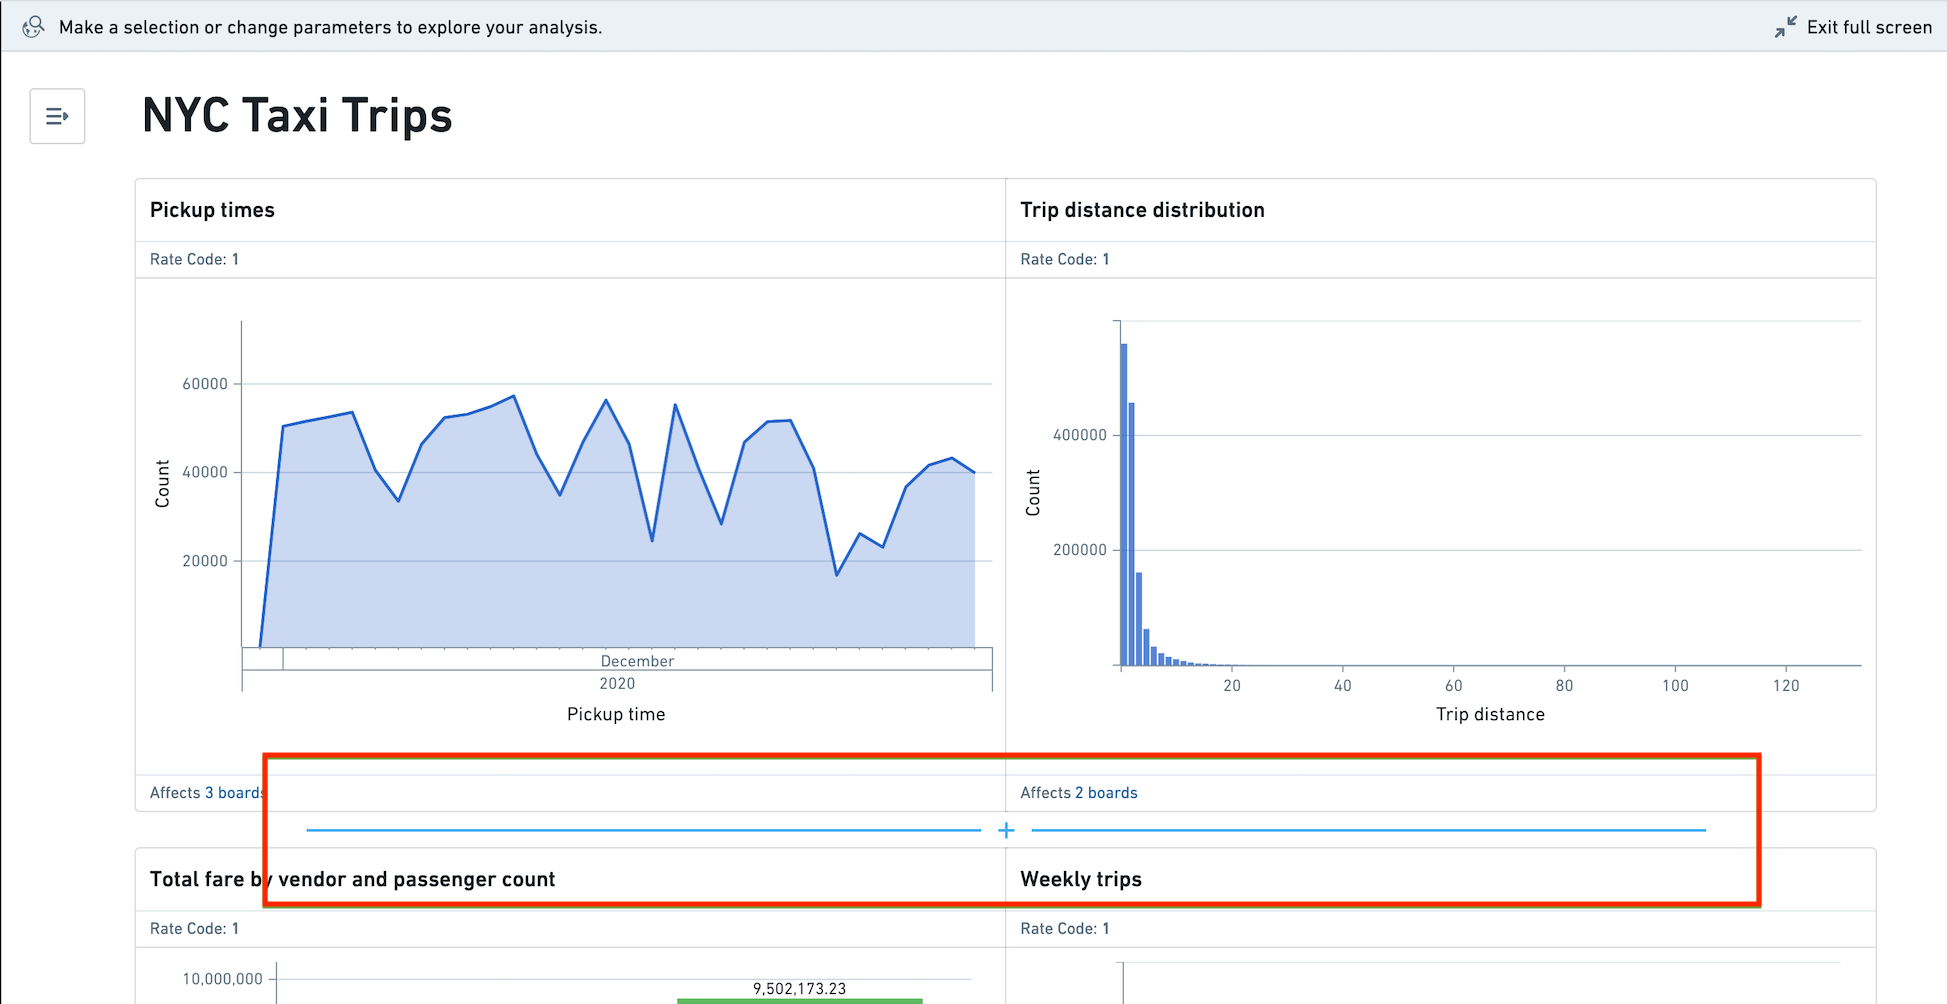
Dashboard viewers can make board selections that will propagate to any boards that are downstream within the analysis. This allows viewers to interrogate the data and drill into segments of interest. For a given board, the board footer displays which other boards would be affected by a selection.
In the video below, the user makes a selection on the board Total fare by vendor and passenger count, thereby affecting the downstream board Weekly Trips.
Share links
To create a share link with the current parameter values, click the link icon in the top right of the parameters panel. This will generate and copy your share link.
Boards fullscreen
Viewers can also view each board in a fullscreen presentation mode. To enter full screen, select the  (expand) icon in the top right corner of any board. You can navigate through all boards in fullscreen mode using the arrow keys or arrow buttons.
Exporting a dashboard
Finally, viewers can export dashboards to PDF in either portrait or landscape orientation. Exported dashboards reflect the current state of the dashboard, including parameter overrides and chart to chart filtering. To export your dashboard, select a page orientation from the menu on the right side of the application header.
Foundry administrators can require users to provide justification before exporting a dashboard by configuring the Contour dashboard export checkpoint.
中文翻译
入门指南
创建仪表盘
每个 Contour 分析都与一个 Contour 仪表盘(dashboard)相关联。要向仪表盘添加面板,请点击面板右上角的 添加到仪表盘 按钮。左侧面板中的仪表盘预览将打开,您可以在其中添加面板标题、通过拖放重新排序面板以及为仪表盘命名。您可以将所有 Visualize 面板(文本和地图面板除外)添加到仪表盘。有关如何直接将文本描述添加到仪表盘的信息,请参阅添加文本。
要打开仪表盘,请选择仪表盘预览面板顶部的 打开仪表盘,或点击分析右上角的蓝色仪表盘按钮。
为确保仪表盘查看者在打开仪表盘时始终看到最新数据,请在分析的数据设置中启用"打开时刷新分析数据",如下所示。
编辑仪表盘
在编辑模式下,您可以通过以下方式自定义仪表盘:
- 命名标签页、面板和参数
- 重新排序面板和标签页
- 添加文本
- 调整面板和文本的大小
标签页
您可以将仪表盘组织成多个标签页。标签页可以重命名或拖拽以调整顺序。面板和文本可以在不同标签页之间拖拽移动。
当向仪表盘添加面板时,点击 添加到仪表盘 将其添加到第一个可用标签页。点击同一按钮旁的下拉箭头,可将面板添加到特定标签页,或创建新标签页并将面板添加其中。
面板重新排序
仪表盘中的面板重新排序仅影响外观,不会影响底层分析。例如,将图表面板移动到仪表盘中时间序列面板的上方,不会将相应图表面板移动到该仪表盘源分析中对应时间序列面板的上方。要重新排序面板,请按住任意面板右上角按钮菜单中最左侧的按钮进行拖拽,如下所示。每行最多可添加三个面板。
添加文本
要向仪表盘添加文本,请将鼠标悬停在您希望放置文本的区域,然后点击蓝色的 +(加号)按钮。
您可以在文本组件、面板标题、标签页标题和仪表盘标题中内联使用参数。要访问参数列表,请键入 $ 并选择参数名称。当仪表盘编辑者和查看者在左侧面板中选择参数时,文本中的内联参数值将随之更新。
调整面板和文本的大小
当一行中有多个面板或文本框时,您可以在项目的设置菜单中选择"展开"以增加其宽度。对于包含两个项目的行,这将形成 2/3 - 1/3 的布局;对于包含三个项目的行,这将形成 1/2 - 1/4 - 1/4 的布局。要将项目恢复为原始大小,请在设置菜单中选择"折叠"。请注意,每行只能包含单一项目类型——不能同时包含面板和文本框。
查看仪表盘
仪表盘查看者在探索时可以临时覆盖仪表盘设置,例如选择参数值和进行面板选择。这些临时覆盖在仪表盘重新加载后不会保留,也不会影响其他查看者看到的内容。
参数覆盖
仪表盘查看者可以更改左侧边栏中的参数值。查看者可以在面板标题中看到哪些参数影响特定面板。
图表间筛选
仪表盘查看者可以进行面板选择,这些选择将传播到分析中下游的任何面板。这使得查看者能够深入分析数据并钻取感兴趣的数据段。对于特定面板,面板底部会显示哪些其他面板会受到选择的影响。
在下面的视频中,用户对面板 按供应商和乘客数量统计的总费用 进行了选择,从而影响了下游面板 每周行程。
分享链接
要创建包含当前参数值的分享链接,请点击参数面板右上角的链接图标。这将生成并复制您的分享链接。
面板全屏
查看者还可以在全屏演示模式下查看每个面板。要进入全屏模式,请选择任意面板右上角的 (展开)图标。您可以使用箭头键或箭头按钮在全屏模式下浏览所有面板。
导出仪表盘
最后,查看者可以将仪表盘导出为 PDF,支持纵向或横向布局。导出的仪表盘反映仪表盘的当前状态,包括参数覆盖和图表间筛选。要导出仪表盘,请从应用程序标题右侧的菜单中选择页面方向。
Foundry 管理员可以通过配置 Contour 仪表盘导出 检查点,要求用户在导出仪表盘前提供理由。