Derive relative dates(推导相对日期)
This guide will show you how to use Contour’s expression language to derive relative dates from your dataset.
In this case, we want to look at dates grouped by calendar week, and see rows that fall within the eight preceding weeks (i.e. not including the current calendar week).
To get there, we will derive a few intermediate columns:
- departure_week: determine the calendar week — which week of the year (1-52) this date falls on
- departure_year_week_as_integer: create an integer that is the year plus the calendar week (for example, “201501” is the first week of 2015)
- latest_calendar_week: find the most recent week in your dataset
And finally get to the column of interest:
- within_last_8_weeks: compare each date to latest_calendar_week to determine whether it falls within the eight preceding weeks (return true or false)
We’ll also derive a label column that can be used in charts to display the year and calendar week nicely: departure_week_label.
:::callout{theme="neutral"} There are simpler ways to calculate a straightforward “falls within the last eight weeks,” but this guide is intended to give as many examples as possible (and to show how you might use Contour to conform to explicit requirements). :::
Deriving relative dates
Start with a dataset that has a date column. Here we’re using a column called departure_date_time in the original dataset. You can change the column names as appropriate to your dataset.
You may want to filter down to a range of a few months for faster loading. Then, click Table to open the table view. In the table editing view, click Expression to derive each new column.
:::callout{theme="success" title="Tip"} Alternatively, you can add expression boards directly from the path, without navigating to the table view. :::
departure_week
Name the first column departure_week.
We will use the week_of_year function to determine the week of the year for each date in the departure_date_time column. For weeks 1-9, we’ll use case statements to format the numbers with a 0 in front. The final column expression should look like this:
CASE week_of_year("departure_date_time")
WHEN 1 THEN '01'
WHEN 2 THEN '02'
WHEN 3 THEN '03'
WHEN 4 THEN '04'
WHEN 5 THEN '05'
WHEN 6 THEN '06'
WHEN 7 THEN '07'
WHEN 8 THEN '08'
WHEN 9 THEN '09'
ELSE CAST (week_of_year("departure_date_time") AS STRING)
END
:::callout{theme="success" title="Tip"}
You can also simplify the above by using the left padding (lpad) function instead of case statements: lpad(week_of_year("departure_date_time"), 2, '0'). This will add a zero to the left of any value that needs it to ensure that every value has a total of two digits.
:::
departure_year_week_as_integer
In this column we’ll concatenate the year to the value in the departure_week column we just derived.
We will use the year function to extract the year from each date in the departure_date_time column. Then we’ll add the departure_week column to the result, using || characters to concatenate them. Finally, we’ll cast the resulting value as an integer. The final column expression should look like this:
CAST (year("departure_date_time")||"departure_week" AS INTEGER)
latest_calendar_week
Now we’ll find the maximum value in the column we just created — the maximum value should be the latest week in the data. (We’ll assume that the data is updated regularly, so “latest week in the data” is roughly equivalent to the current week.)
The syntax is a window function. If you’re interested in learning more about window functions, you can read the SQL documentation ↗ or see the Window Functions documentation; otherwise, simply copy the function:
max("departure_year_week_as_integer") OVER ()
This will create a column that is simply the maximum value of the range, so it will be the same in every row.
within_last_8_weeks
To derive this column, we’ll use a couple comparison statements to check whether the date falls within the eight weeks before the latest week of data. If it does, use TRUE for the value of that row. Otherwise, FALSE.
CASE
    WHEN ("departure_year_week_as_integer" < "latest_calendar_week")
    AND ("departure_year_week_as_integer" > ("latest_calendar_week" - 9))
    THEN TRUE
    ELSE FALSE
END
departure_week_label
This column simply presents the year and calendar week nicely as a string, to use in labeling charts. We’ll use the year function to extract the year from each date, then add “.CW” and the calendar week.
year("departure_date_time") || '.CW' || "calendar_week"
Now that we have all the derived columns, click Table to exit the table view (or simply carry on in your analysis if you added expression boards directly to the path).
Using relative dates in charts
You can use a filter to keep only rows where within_last_8_weeks is true, then create a chart with the filtered dataset. In the following chart, we’ve used the departure_week_label to show the number of unique flights per week for the last eight weeks before the current date:
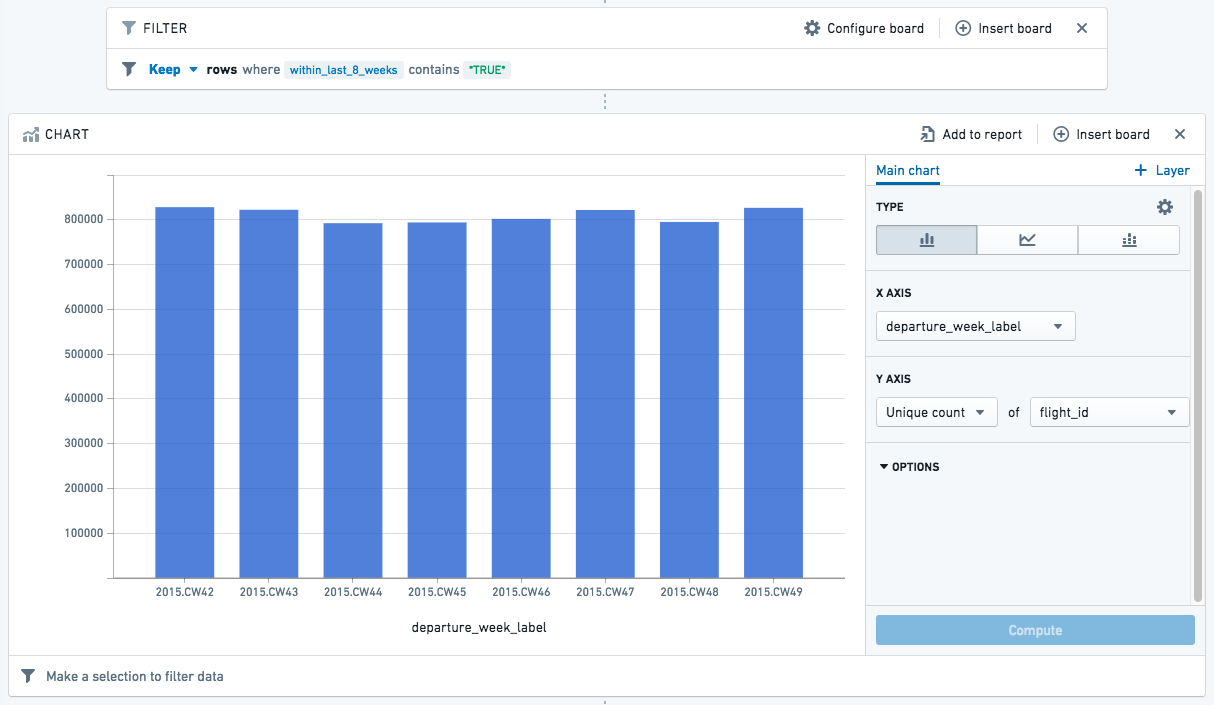
You can add this chart to a report, and refer to the chart regularly for an updated view of the past couple months.
中文翻译
推导相对日期
本指南将演示如何使用 Contour 的表达式语言从数据集中推导相对日期。
在此案例中,我们希望查看按日历周分组的日期,并找出落在前八周(即不包括当前日历周)内的行。
为此,我们将推导几个中间列:
- departure_week(出发周):确定日历周——该日期落在一年中的第几周(1-52)
- departure_year_week_as_integer(出发年周整数):创建一个由年份加日历周组成的整数(例如,"201501"表示2015年的第一周)
- latest_calendar_week(最新日历周):查找数据集中最近的周
最后得到目标列:
- within_last_8_weeks(是否在过去8周内):将每个日期与 latest_calendar_week 进行比较,判断是否落在前八周内(返回 true 或 false)
我们还将推导一个标签列,用于在图表中美观地显示年份和日历周:departure_week_label(出发周标签)。
:::callout{theme="neutral"} 计算简单的"是否在过去八周内"有更简便的方法,但本指南旨在提供尽可能多的示例(并展示如何使用 Contour 来满足明确的需求)。 :::
推导相对日期
从一个包含日期列的数据集开始。这里我们使用原始数据集中的 departure_date_time(出发日期时间) 列。您可以根据数据集情况更改列名。
您可以先筛选出几个月的范围以加快加载速度。然后,点击 Table(表格) 打开表格视图。 在表格编辑视图中,点击 Expression(表达式) 来推导每个新列。
:::callout{theme="success" title="提示"} 或者,您可以直接从路径中添加表达式面板,无需导航到表格视图。 :::
departure_week(出发周)
将第一个列命名为 departure_week。
我们将使用 week_of_year 函数来确定 departure_date_time 列中每个日期所在的年份周数。对于第1-9周,我们使用 case 语句将数字格式化为前面加0。最终的列表达式应如下所示:
CASE week_of_year("departure_date_time")
WHEN 1 THEN '01'
WHEN 2 THEN '02'
WHEN 3 THEN '03'
WHEN 4 THEN '04'
WHEN 5 THEN '05'
WHEN 6 THEN '06'
WHEN 7 THEN '07'
WHEN 8 THEN '08'
WHEN 9 THEN '09'
ELSE CAST (week_of_year("departure_date_time") AS STRING)
END
:::callout{theme="success" title="提示"}
您也可以使用左填充(lpad)函数来简化上述表达式,而无需使用 case 语句:lpad(week_of_year("departure_date_time"), 2, '0')。这将在任何需要补位的值左侧添加一个零,确保每个值都有两位数字。
:::
departure_year_week_as_integer(出发年周整数)
在这一列中,我们将年份与刚刚推导出的 departure_week 列的值进行拼接。
我们将使用 year 函数从 departure_date_time 列中的每个日期提取年份。然后,使用 || 字符将 departure_week 列添加到结果中。最后,将结果值转换为整数。 最终的列表达式应如下所示:
CAST (year("departure_date_time")||"departure_week" AS INTEGER)
latest_calendar_week(最新日历周)
现在,我们将查找刚刚创建的列中的最大值——最大值应为数据中的最新周。(我们假设数据会定期更新,因此"数据中的最新周"大致相当于当前周。)
语法是一个窗口函数(window function)。如果您想了解更多关于窗口函数的信息,可以阅读 SQL 文档 ↗ 或查看窗口函数文档;否则,直接复制以下函数即可:
max("departure_year_week_as_integer") OVER ()
这将创建一个列,其值就是该范围的最大值,因此每一行的值都相同。
within_last_8_weeks(是否在过去8周内)
为了推导这一列,我们将使用几个比较语句来检查日期是否落在数据最新周的前八周内。如果是,则该行的值为 TRUE。否则为 FALSE。
CASE
    WHEN ("departure_year_week_as_integer" < "latest_calendar_week")
    AND ("departure_year_week_as_integer" > ("latest_calendar_week" - 9))
    THEN TRUE
    ELSE FALSE
END
departure_week_label(出发周标签)
这一列只是将年份和日历周美观地呈现为字符串,用于图表标签。我们将使用 year 函数从每个日期中提取年份,然后添加".CW"和日历周。
year("departure_date_time") || '.CW' || "calendar_week"
现在我们已经得到了所有推导列,点击 Table(表格) 退出表格视图(或者如果您直接在路径中添加了表达式面板,则继续进行分析)。
在图表中使用相对日期
您可以使用筛选器仅保留 within_last_8_weeks 为 true 的行,然后使用筛选后的数据集创建图表。 在下面的图表中,我们使用了 departure_week_label 来显示当前日期前八周内每周的独特航班数量:
您可以将此图表添加到报告中,并定期查看以获取过去几个月的更新视图。