Use the expression board(使用表达式面板)
In addition to visual tools like the histogram and chart, Contour also offers an expression board that lets you work with Contour’s rich expression language to derive new columns from your data, perform complex filtering, or perform complex aggregations. Contour's expression language is a custom language that incorporates a number of functions from SparkSQL.
:::callout{theme="success" title="Tips"} * When using the expression editor, use the ? icon for a quick reference of the expression language. * As you type, suggested functions appear in a dropdown. Click or use the Enter key to select a function. :::
:::callout{theme="neutral"}
Column names are case-sensitive. Additionally, when selecting a column, you may write the column name with or without double quotes. For example, year("birthdate_col") is equivalent to year(birthdate_col). For consistency, column names in this documentation are written with double quotes.
:::
Adding an expression board
You can add an expression board to your Contour analysis from the toolbar as demonstrated in this overview:

This example uses the open source data from the U.S. Bureau of Transportation Statistics.
Configuring the expression board
The expression board has two modes: a library of saved expressions and an editor.
Library
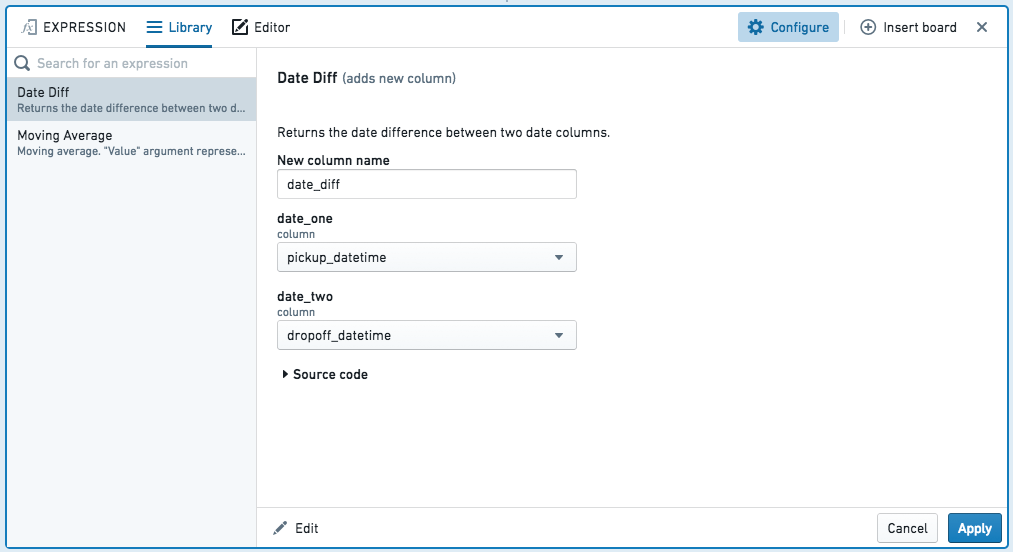
The library lets you re-use expressions written by you or others, with arguments:
Editor
Within the editor, there are four categories of expressions you can write:
- Add new column
- Replace column
- Filter
- Aggregate
Adding a new column
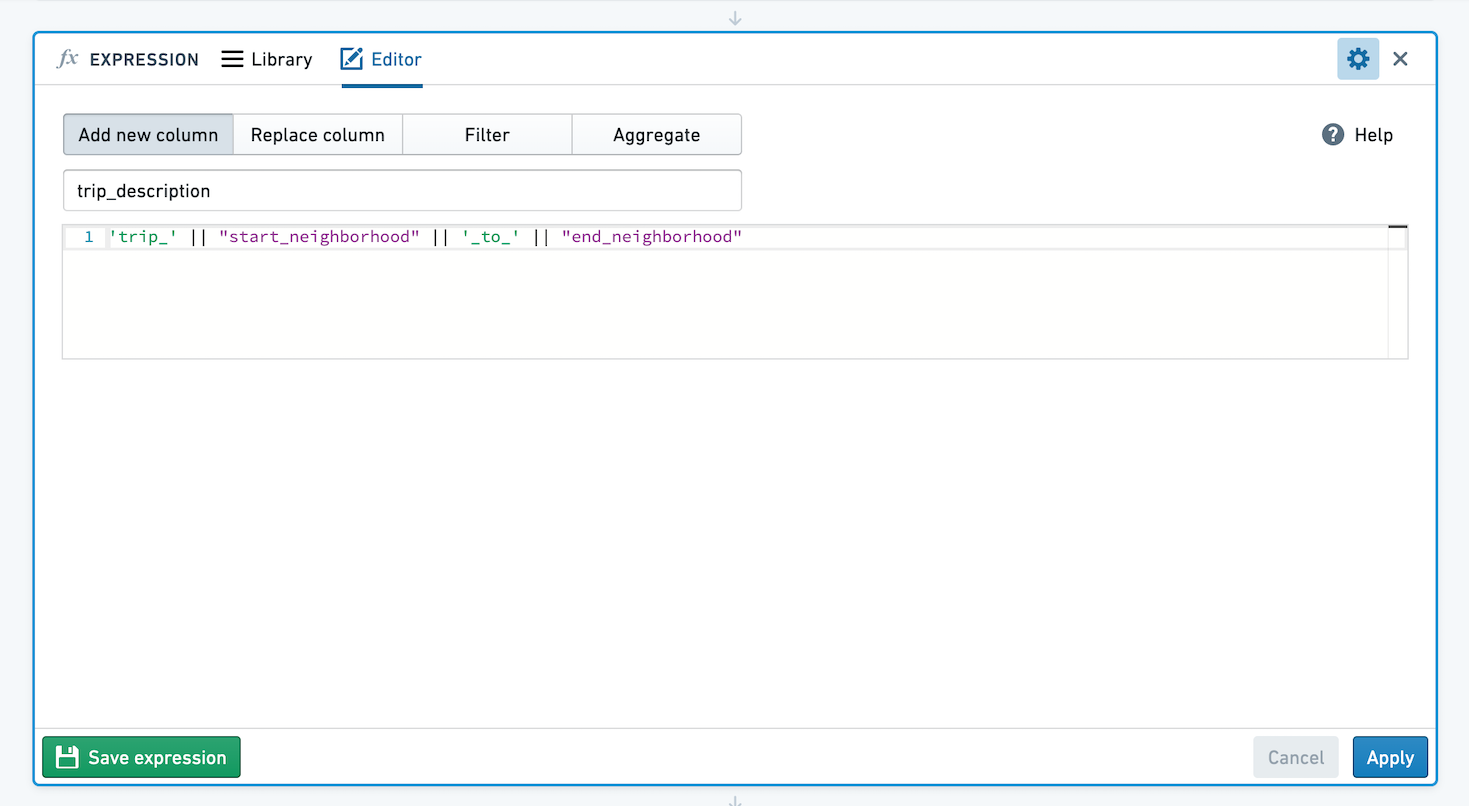
Enter the name for your new column, and the expression to build it. For example, create a new column by extracting the year from a birthday using year("birthdate_col"), or create a column with a taxi trip description string by concatenating values from other columns:
Replacing a column
Select which column you want to replace, and the expression with which to replace it.
Filtering data with expressions
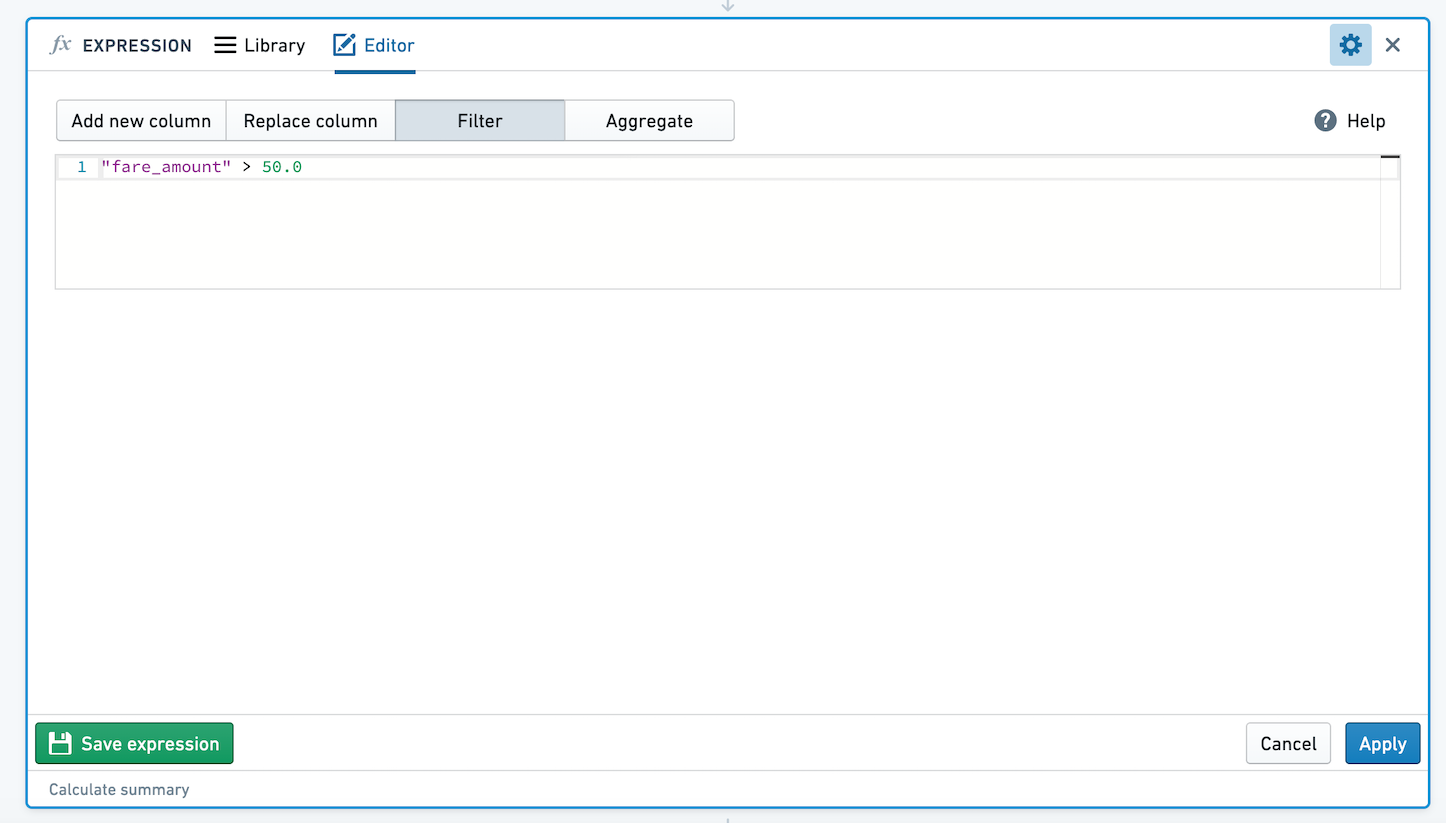
Define a filter condition by entering an expression that evaluates to a Boolean. Your data will be filtered to all rows in which the expression evaluates to true. For example, filter to only people born in 1981 using year("birthdate_col") == 1981, or filter a table of taxi trips to only trips with fares of more than $50:
:::callout{theme="neutral"}
You cannot use window functions (OVER syntax) in filter expressions, due to a limitation of SparkSQL. You can use them to create new columns, as demonstrated later.
:::
The following section contains examples of filter expressions you can use in Contour.
Common examples
Compare a column to a static value
"taxi_fare" < 25.0
"birth_date" == '1776-07-04'
:::callout{theme="neutral"}
In the expression board editor, null = null produces true. This is different from SparkSQL, where null = null resolves to null.
:::
Filter with a not-equal-to operator
Filter to all rows where league_id is not equal to ‘NHL’:
league_id != 'NHL'
Compare two columns
"age" < "average_age"
Filter to rows where tip percentage (tip divided by fare) is greater than or equal to average_tip_percentage:
("tip" / "fare") >= "average_tip_percentage"
Remove rows with nulls
Filter to all rows where category is not null:
not isnull("category")
Split a column using a special character
Split categories column by |. Since | is an example of a special character, it needs to be escaped in order to be treated as literal.
SPLIT("categories", '\|')
Search patterns using LIKE
Use the SQL LIKE operator ↗ to search for patterns in column values.
Match all country names that end in A:
"country_name" LIKE '%a'
Filter on multiple conditions
Combine two or more filter expressions with AND or OR:
("start_borough" == 'Queens') AND ("end_borough" == 'Queens')
"department" is 'sales' OR "department" is 'r&d'
Find row of MIN or MAX
A common task in data analysis is to find the row with the minimum or maximum value for some column within a partition. For example, you might have a dataset with patient records and want to find the earliest date that each patient visited the office. You can use two expressions to find these rows.
:::callout{theme="neutral"} You must derive a new column first and then use that to filter, rather than doing everything in the filter expression. This is because you cannot use window functions in filter expressions, due to a limitation of SparkSQL. :::
First, derive a new column to find the min or max value for the partition. In the following example, we determine the most recent taxi ride each cab (identified by medallion number) has given, creating a new column most_recent_ride:
max("pickup_datetime") OVER (PARTITION BY "medallion")
:::callout{theme="success" title="Tip"}
See Advanced expressions: Window functions if you need a refresher on using window functions (OVER).
:::
Then add a filter expression comparing each row’s pickup date value to the max value for its partition:
"pickup_datetime" == "most_recent_ride"
Aggregating data with expressions
This mode lets you aggregate your data using group by expressions and aggregate expressions. You can have zero, one, or many group by expressions, and you can have one or many aggregate expressions. Each group by and aggregate expression must be given a name, and the resulting table will have a new schema consisting of one column for each expression.
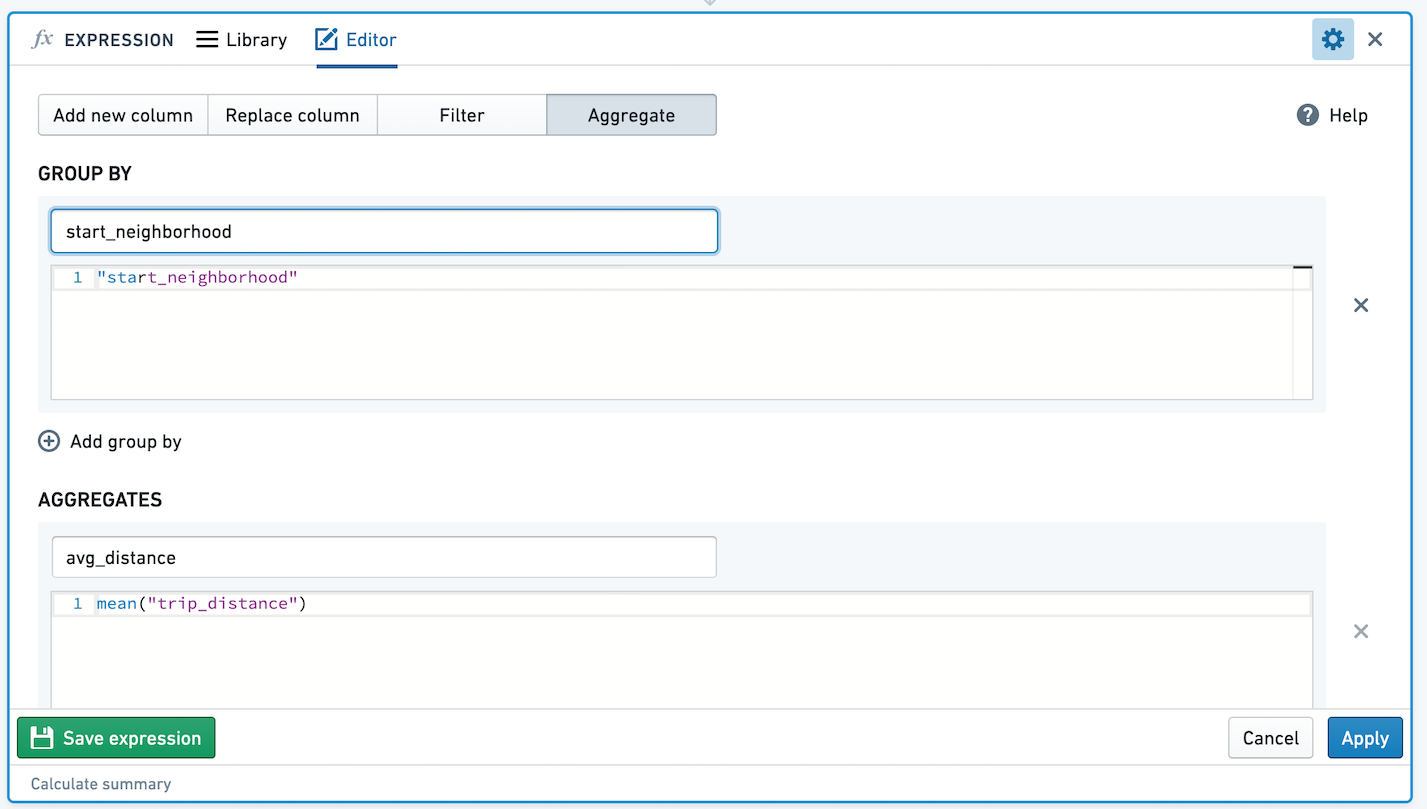
For example, given the following expression aggregating average taxi trip distance by start neighborhood:
The resulting table would look like this:
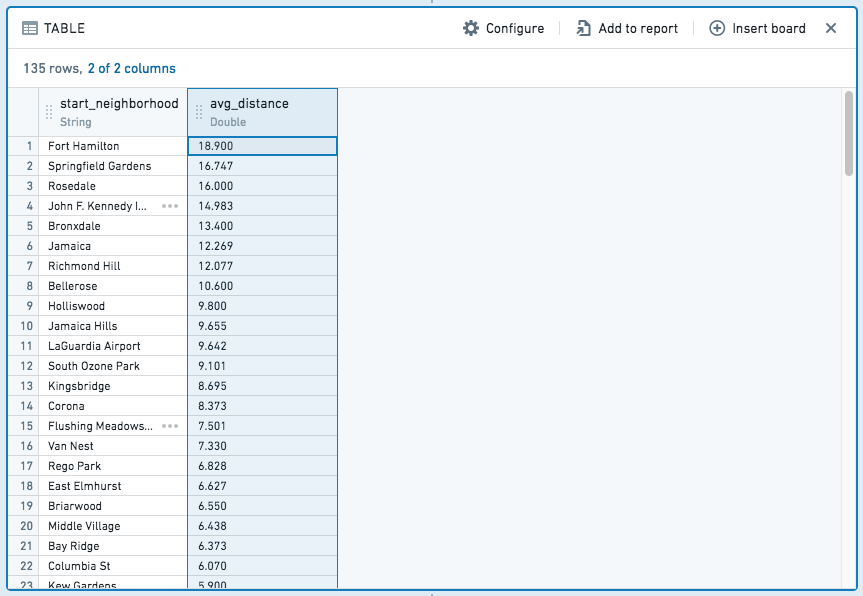
In contrast to add-column and filter expressions, aggregate expressions result in a completely new table, with columns for each aggregate and group by partition.
For example, given a notional dataset like the following:
| id | name | sport | birthday | number_of_gold_medals |
|---|---|---|---|---|
| 1 | Jane | Swimming | 6/29/1985 | 6 |
| 2 | John | Gymnastics | 2/19/1971 | 3 |
| 3 | Mike | Swimming | 3/23/1971 | 7 |
| 4 | Michelle | Gymnastics | 9/12/1971 | 5 |
If you want to know how many total gold medals were won, you would use:

which would give you the following table:
| sum |
|---|
| 21 |
If you want to know the total and average number of gold medals won by birth year and sport, you would use:

which would give you:
| birth_year | sport | sum | average |
|---|---|---|---|
| 1971 | Swimming | 7 | 7 |
| 1971 | Gymnastics | 8 | 4 |
| 1985 | Swimming | 6 | 6 |
If you would like to perform analysis on the new table resulting from the aggregation, you can switch to aggregated data.
Saved Expressions
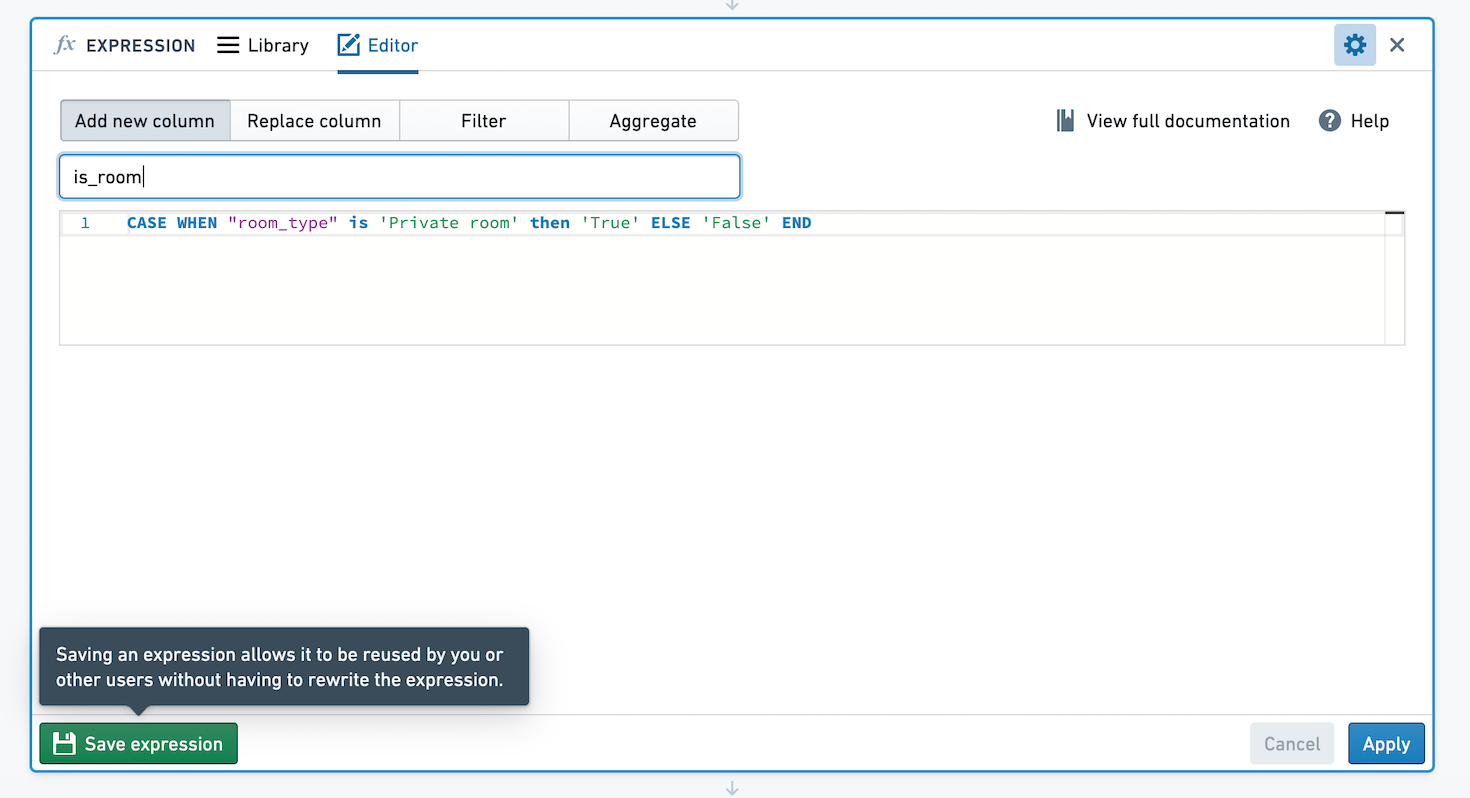
In Contour, you can save expressions to easily reuse logic across analyses and paths, and share logic with others. Let's imagine we've created an expression creating a new column, with value True if the column room_type has value Private room, and False otherwise. We want to save this expression so others can use this logic.
Click Save Expression in the bottom left hand corner of the Expression board.
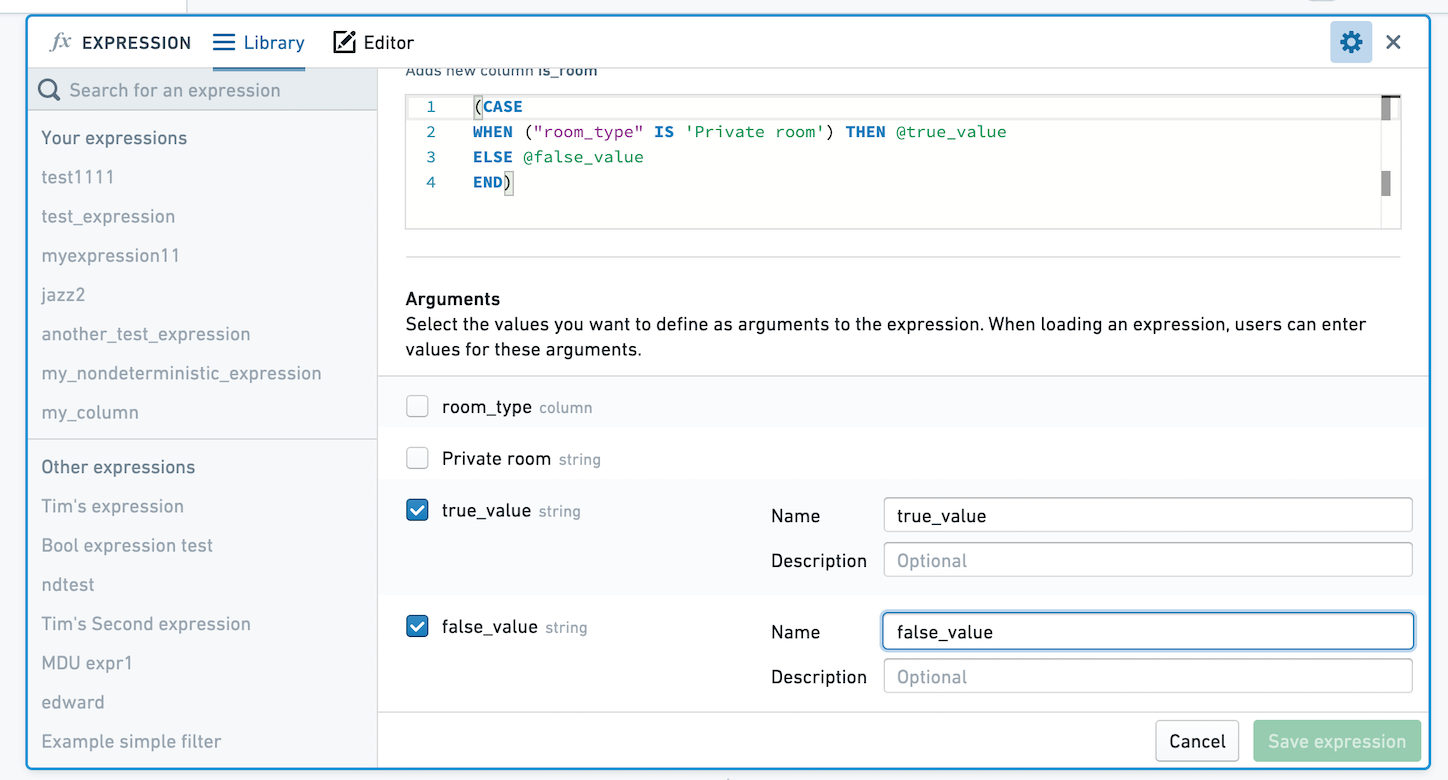
You can choose to save the expression with no arguments, or select values to define as arguments to the expression. If you save the expression with no arguments, when applied the expression's logic will remain exactly as you defined. If you choose to define arguments, users will be able to choose different values for the arguments. In the below image, we've made the True and False values parameterizable.
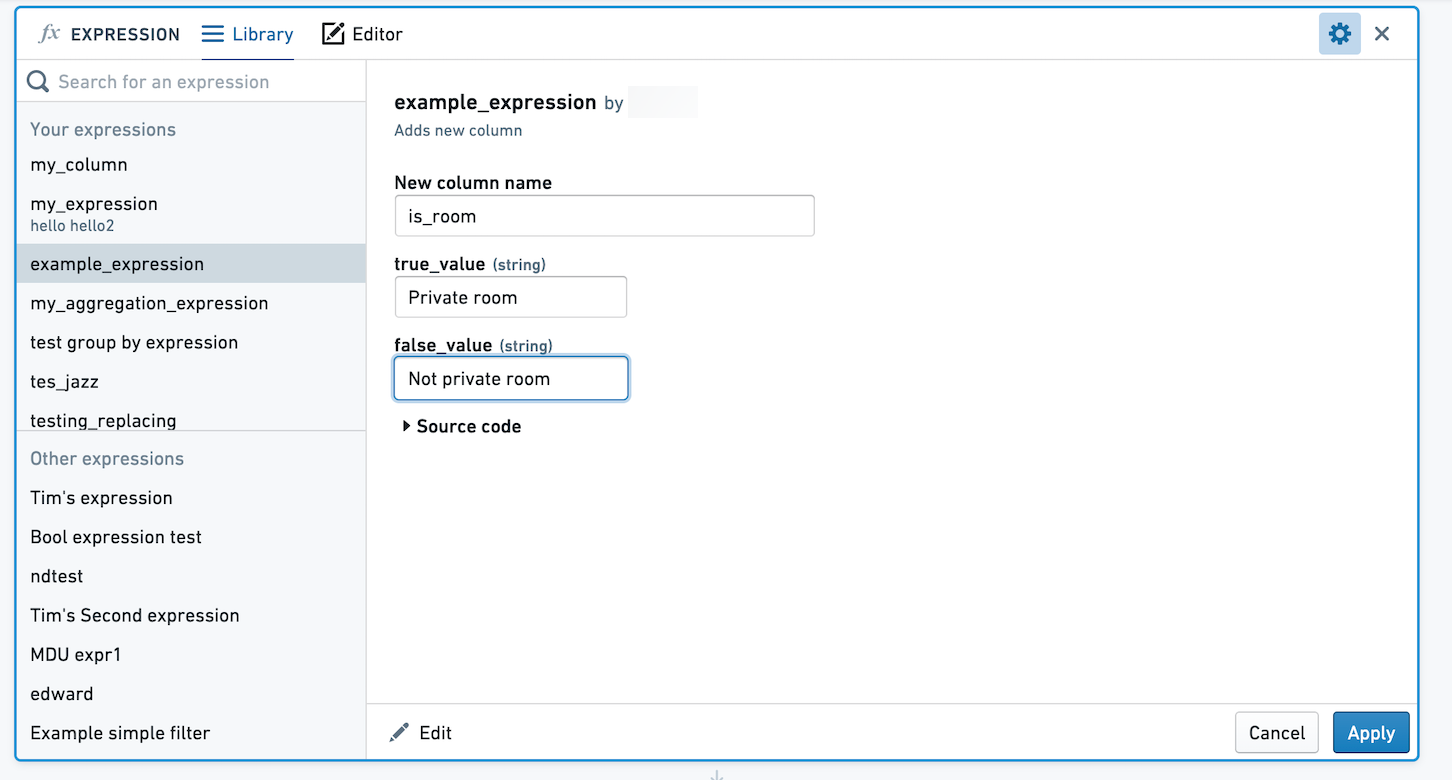
When you or another user selects this expression to apply, you'll be prompted to choose values for true_value and false_value. Here, these values are mapped to Private room and Not private room.
Saved Aggregate Expressions
Aggregate expressions are used to aggregate data based on zero or more group bys. If you save an Aggregate expression with zero group bys, users of the expression will be able to select an arbitrary number of column group bys.
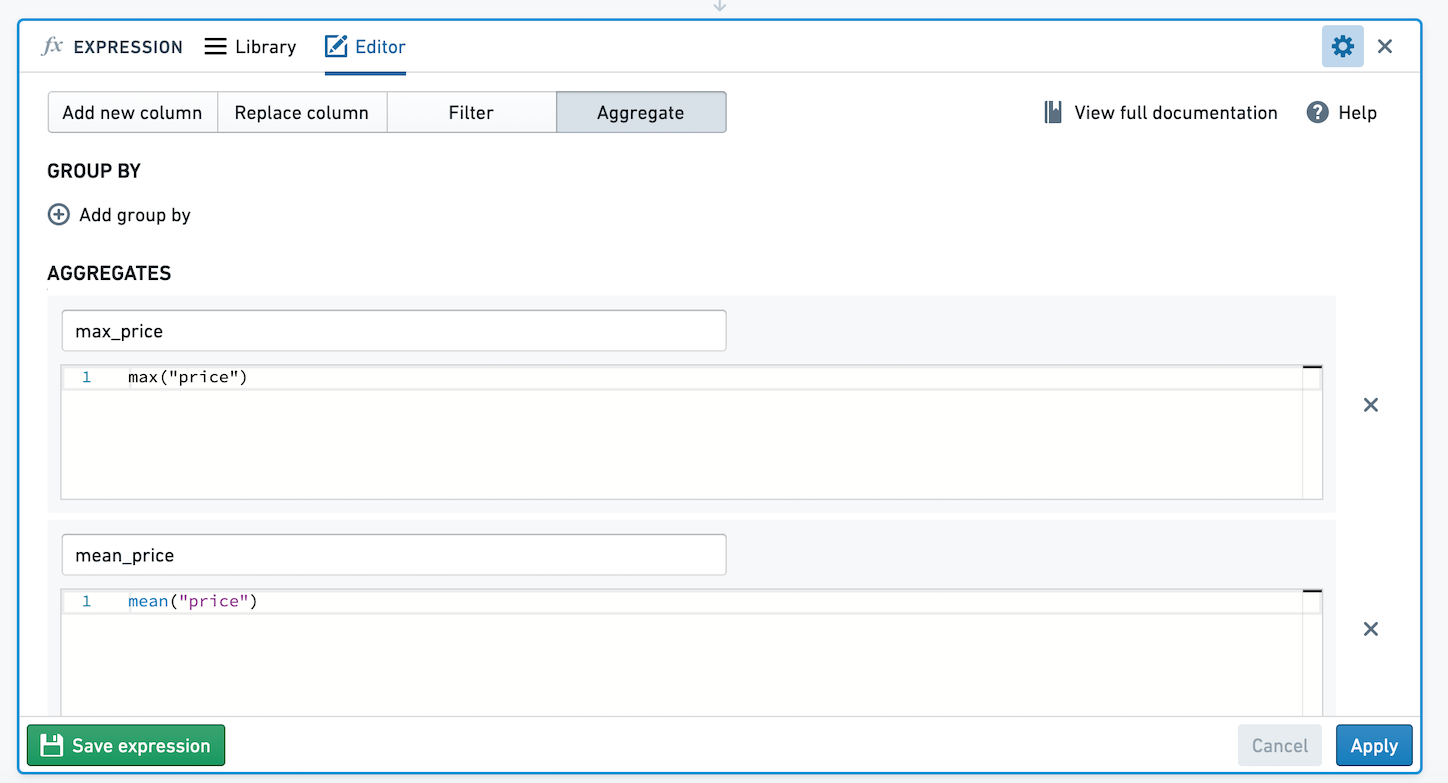
For example, below we have an aggregate expression with zero group bys and two aggregates using open source data from Inside Airbnb ↗. The aggregates calculate the mean and max of price. Let's save this aggregate expression.
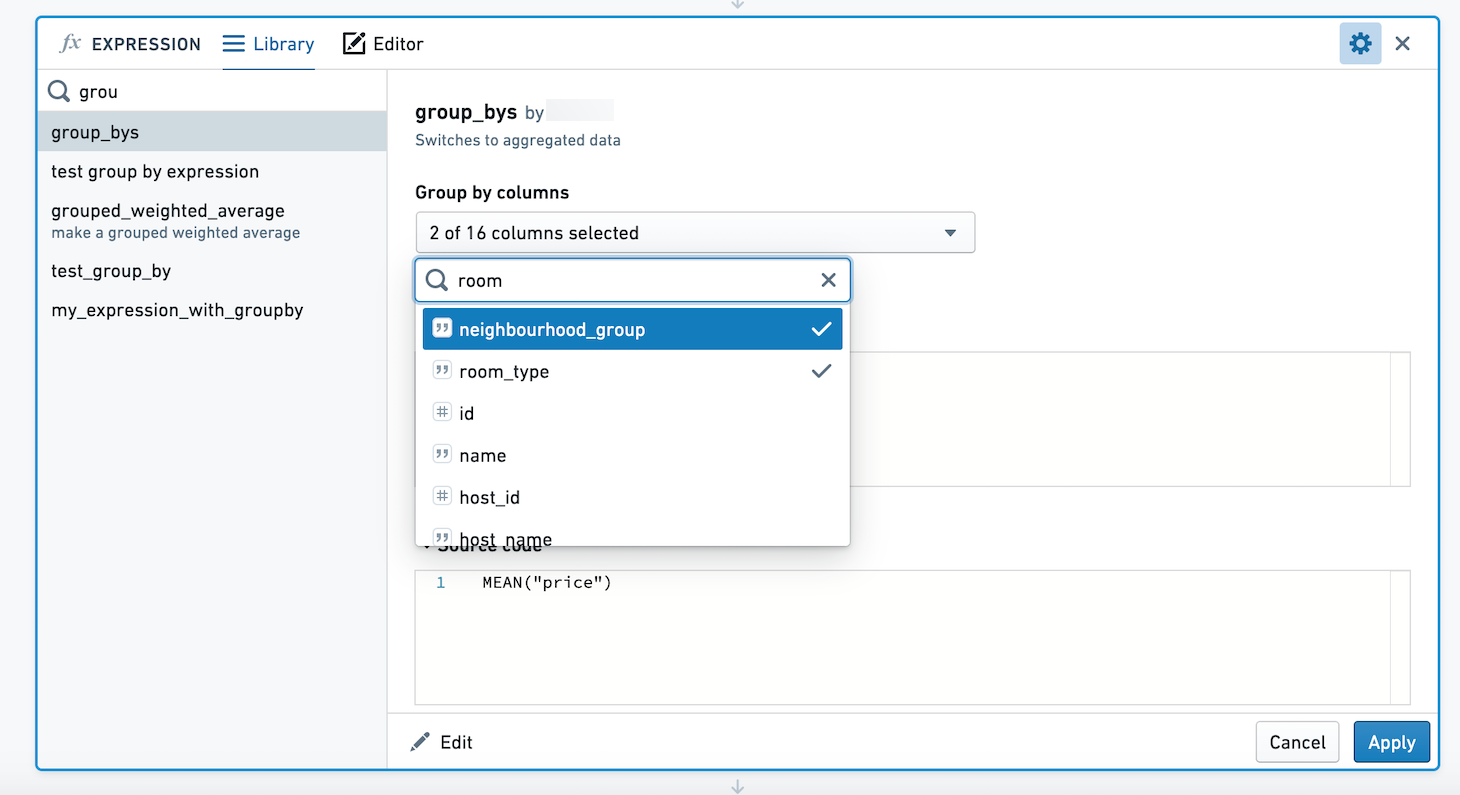
When using this expression, we're presented with a column selector. We can choose to group by multiple columns. Here, we will calculate the mean and max of price for each combination of neighbourhood_group and room_type.
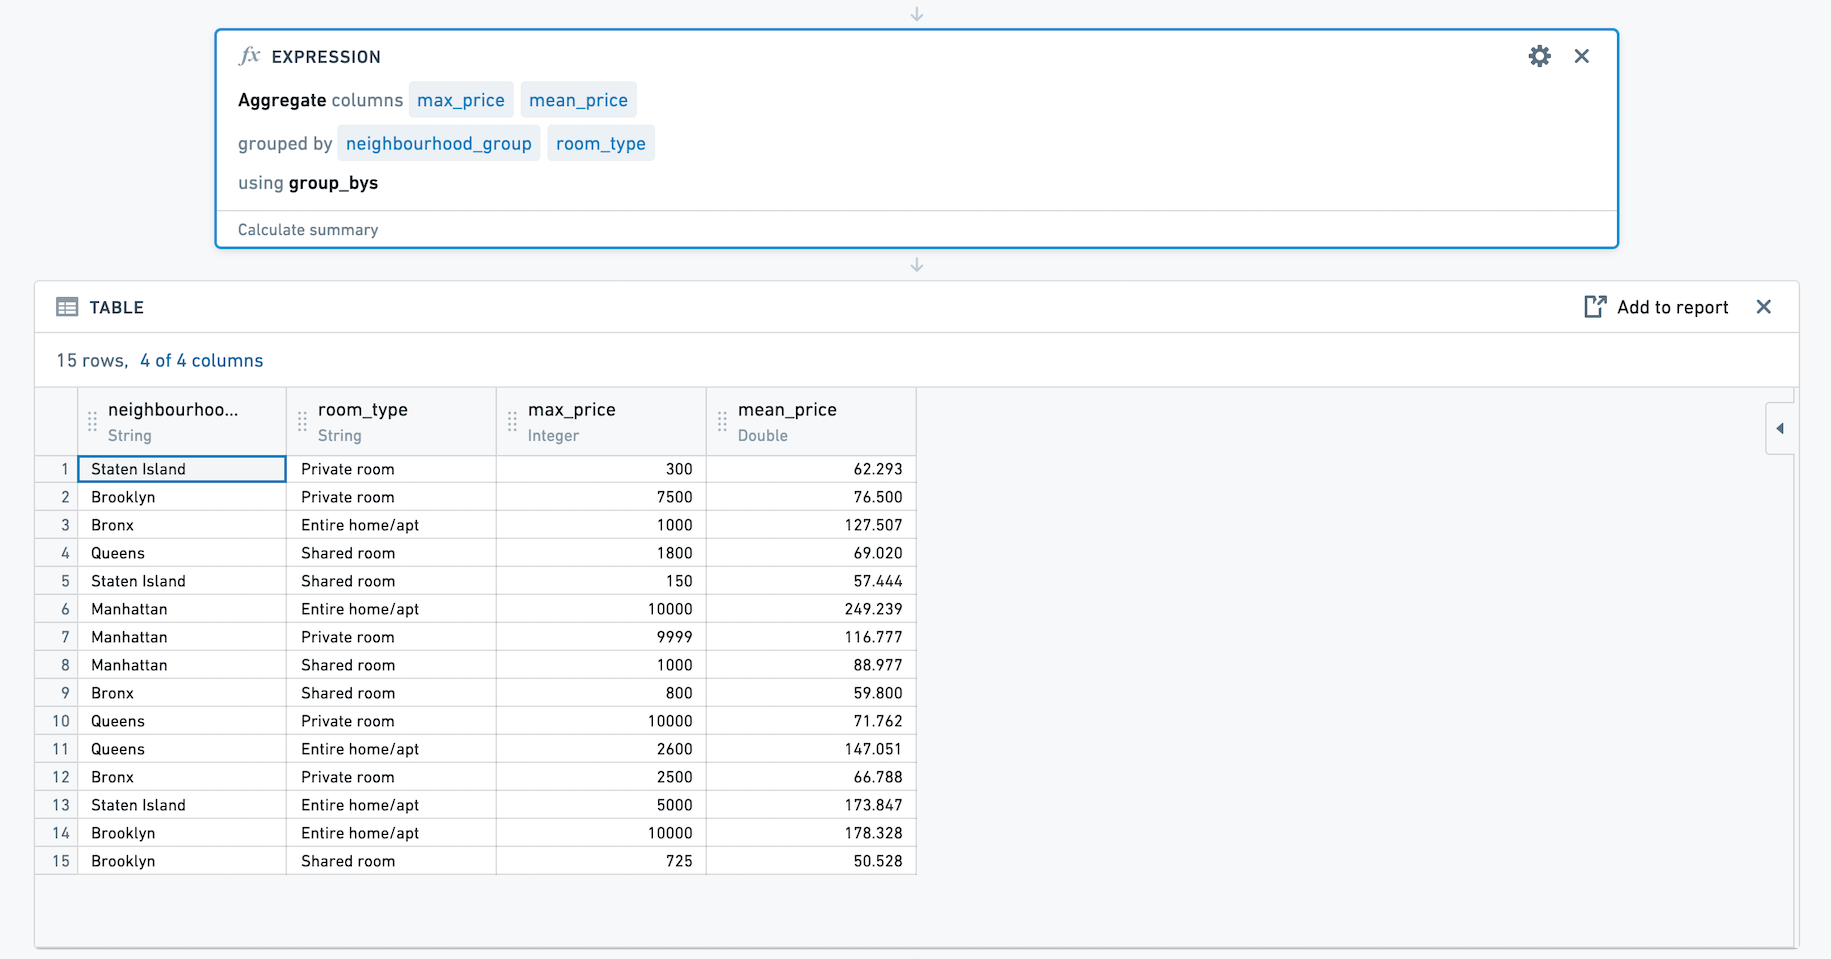
The resulting set has four columns, neighbourhood_group, room_type, max_price and mean_price.
中文翻译
使用表达式面板
除了直方图和图表等可视化工具外,Contour 还提供了表达式面板(Expression Board),让您能够使用 Contour 丰富的表达式语言从数据中派生新列、执行复杂过滤或进行复杂聚合。Contour 的表达式语言是一种自定义语言,融合了 SparkSQL 中的许多函数。
:::callout{theme="success" title="提示"} * 使用表达式编辑器时,点击 ? 图标可快速查阅表达式语言参考。 * 输入时,建议的函数会以下拉菜单形式显示。点击或按 Enter 键可选择函数。 :::
:::callout{theme="neutral"}
列名是区分大小写的。此外,选择列时,列名可以带双引号也可以不带。例如,year("birthdate_col") 等同于 year(birthdate_col)。为保持一致性,本文档中的列名均带双引号书写。
:::
添加表达式面板
您可以通过工具栏向 Contour 分析中添加表达式面板,如下所示:
此示例使用了美国运输统计局(Bureau of Transportation Statistics)的开源数据。
配置表达式面板
表达式面板有两种模式:已保存表达式库和编辑器。
库
库允许您重复使用自己或他人编写的带参数的表达式:
编辑器
在编辑器中,您可以编写四类表达式:
- 添加新列
- 替换列
- 过滤
- 聚合
添加新列
输入新列的名称以及构建该列的表达式。例如,使用 year("birthdate_col") 从生日中提取年份来创建新列,或通过拼接其他列的值来创建包含出租车行程描述字符串的列:
替换列
选择要替换的列,以及用于替换的表达式。
使用表达式过滤数据
通过输入一个计算结果为布尔值的表达式来定义过滤条件。数据将被过滤为表达式计算结果为 true 的所有行。例如,使用 year("birthdate_col") == 1981 仅过滤出 1981 年出生的人,或过滤出租车行程表,仅显示车费超过 50 美元的行程:
:::callout{theme="neutral"}
由于 SparkSQL 的限制,您不能在过滤表达式中使用窗口函数(OVER 语法)。但您可以使用它们来创建新列,后续会演示。
:::
以下部分包含可在 Contour 中使用的过滤表达式示例。
常见示例
将列与静态值比较
"taxi_fare" < 25.0
"birth_date" == '1776-07-04'
:::callout{theme="neutral"}
在表达式面板编辑器中,null = null 的结果为 true。这与 SparkSQL 不同,在 SparkSQL 中 null = null 的结果为 null。
:::
使用不等于运算符过滤
过滤出 league_id 不等于 'NHL' 的所有行:
league_id != 'NHL'
比较两列
"age" < "average_age"
过滤出小费百分比(小费除以车费)大于或等于 average_tip_percentage 的行:
("tip" / "fare") >= "average_tip_percentage"
移除包含空值的行
过滤出 category 不为空的所有行:
not isnull("category")
使用特殊字符拆分列
按 | 拆分 categories 列。由于 | 是特殊字符,需要转义才能被视为字面量。
SPLIT("categories", '\|')
使用 LIKE 进行模式搜索
使用 SQL LIKE 运算符 ↗ 在列值中搜索模式。
匹配所有以 A 结尾的国家名称:
"country_name" LIKE '%a'
多条件过滤
使用 AND 或 OR 组合两个或多个过滤表达式:
("start_borough" == 'Queens') AND ("end_borough" == 'Queens')
"department" is 'sales' OR "department" is 'r&d'
查找最小值或最大值所在行
数据分析中的常见任务是查找某个分区内某列的最小值或最大值所在行。例如,您可能有一个包含患者记录的数据集,想要找到每位患者最早的就诊日期。您可以使用两个表达式来查找这些行。
:::callout{theme="neutral"} 您必须先派生一个新列,然后使用该列进行过滤,而不是在过滤表达式中完成所有操作。这是因为 SparkSQL 的限制,您不能在过滤表达式中使用窗口函数。 :::
首先,派生一个新列来查找分区的最小值或最大值。在以下示例中,我们确定每辆出租车(由 medallion 编号标识)最近一次载客行程,创建一个新列 most_recent_ride:
max("pickup_datetime") OVER (PARTITION BY "medallion")
:::callout{theme="success" title="提示"}
如需复习窗口函数(OVER)的使用方法,请参阅高级表达式:窗口函数。
:::
然后添加一个过滤表达式,将每行的上车日期值与其分区的最大值进行比较:
"pickup_datetime" == "most_recent_ride"
使用表达式聚合数据
此模式允许您使用分组依据表达式和聚合表达式来聚合数据。您可以有零个、一个或多个分组依据表达式,以及一个或多个聚合表达式。每个分组依据和聚合表达式都必须指定名称,结果表将包含每个表达式对应一列的新模式。
例如,给定以下按起始社区聚合平均出租车行程距离的表达式:
结果表将如下所示:
与添加列和过滤表达式不同,聚合表达式会生成一个全新的表,其中包含每个聚合和分组依据分区的列。
例如,给定以下假设数据集:
| id | name | sport | birthday | number_of_gold_medals |
|---|---|---|---|---|
| 1 | Jane | Swimming | 6/29/1985 | 6 |
| 2 | John | Gymnastics | 2/19/1971 | 3 |
| 3 | Mike | Swimming | 3/23/1971 | 7 |
| 4 | Michelle | Gymnastics | 9/12/1971 | 5 |
如果您想知道总共获得了多少枚金牌,可以使用:
这将得到以下表格:
| sum |
|---|
| 21 |
如果您想按出生年份和运动项目了解获得金牌的总数和平均数,可以使用:
这将得到:
| birth_year | sport | sum | average |
|---|---|---|---|
| 1971 | Swimming | 7 | 7 |
| 1971 | Gymnastics | 8 | 4 |
| 1985 | Swimming | 6 | 6 |
如果您想对聚合产生的新表进行分析,可以切换到聚合数据。
已保存表达式
在 Contour 中,您可以保存表达式,以便在分析和路径中轻松重用逻辑,并与他人共享逻辑。假设我们创建了一个表达式,用于创建一个新列,如果 room_type 列的值为 Private room,则该列的值为 True,否则为 False。我们希望保存此表达式,以便其他人可以使用此逻辑。
点击表达式面板左下角的保存表达式(Save Expression)。
您可以选择保存不带参数的表达式,或选择将某些值定义为表达式的参数。如果保存不带参数的表达式,应用时表达式的逻辑将完全保持您定义的样子。如果选择定义参数,用户将能够为参数选择不同的值。在下图中,我们将 True 和 False 值设置为可参数化。
当您或其他用户选择应用此表达式时,系统会提示您为 true_value 和 false_value 选择值。在此示例中,这些值分别映射到 Private room 和 Not private room。
已保存的聚合表达式
聚合表达式用于基于零个或多个分组依据来聚合数据。如果您保存一个不带分组依据的聚合表达式,表达式的使用者将能够选择任意数量的列作为分组依据。
例如,下面我们有一个不带分组依据的聚合表达式,以及两个使用 Inside Airbnb ↗ 开源数据的聚合。这些聚合计算 price 的平均值和最大值。让我们保存这个聚合表达式。
使用此表达式时,会显示一个列选择器。我们可以选择按多个列进行分组。在此示例中,我们将计算每个 neighbourhood_group 和 room_type 组合的 price 平均值和最大值。
结果集包含四列:neighbourhood_group、room_type、max_price 和 mean_price。