Contour FAQ(Contour 常见问题解答)
The following are a few frequently asked questions about Contour. For general information, view our Contour documentation.
- How do I start a new analysis?
- How do I look for relevant data in the platform?
- How do I share an analysis with a coworker?
- How do I create an initial dataset on which to perform an analysis?
- How do I change the view of my analysis?
- How do I apply a calculation?
- What are common Microsoft Excel analysis equivalents in Foundry?
- How do I create a pivot table?
- How do I apply a function across an entire series of data?
- What are common Microsoft Excel aggregate equivalents in Foundry?
- What are some ways to check my analysis?
- What is the difference between saving a dataset in Contour and creating one in Code Repositories or Code Workbook?
- When I attempt to export it gives me a 100,000 row limit. Is this correct?
- Can I automatically update a Contour analysis path?
- Can I revert changes to my Contour analysis?
- When I try to duplicate my analysis, I just see a spinner and nothing happens. What do I do?
- Unable to build dataset from Contour
- Pivot Table not showing all data
- Duplicate column found in pivot table
- General performance issues
count_distinct()fails in a window function in the expression board
How do I start a new analysis?
In Foundry, every user has their own folder called Your files. This is a folder where users can prototype with data and share their results with other users. Inside the folder, users can create their first analysis:
- Navigate to the Files section on your workspace navigation bar.
- Navigate to the Your files tab.
- Create a new analysis by selecting +New and selecting Analysis from the dropdown menu.
- Select +Create a new path after your new analysis generates.
- Select the dataset that you would like to analyze in the corresponding folder.
How do I look for relevant data in the platform?
There are two primary methods for discovering data:
-
Search: Foundry has a platform-wide search tool located in the workspace sidebar on the left side of the page. This tool will search all resources in the platform and is an excellent method for finding data when you know the name of the dataset. Note that the search tool can be used to find any resource in the platform, including spreadsheets, Contour analyses, and code workbooks.
-
Data Catalog: The Foundry Data catalog contains cleaned, curated datasets, ready for consumption by business analysts and data scientists. The Data Catalog is an excellent starting point if you are curious about what data already exists in the platform and can be accessed directly from the homepage. You can come back to the homepage by selecting Home** in the workspace sidebar.
How do I share an analysis with a coworker?
Sharing a resource with a coworker means they must have access to the Project you are working in. Select Share and send a sharing URL or add your coworker directly to the resource to automatically notify them. If your coworker receives a Permission denied error, they will need to request access. Once your coworker's access to the Project has been approved, they will be able to see the analysis you shared with them over email.
How do I create an initial dataset on which to perform an analysis?
Given the data is often available in its raw form within the Foundry platform, it is important to know how to filter it before you begin creating your analysis. Data filtering will allow you to focus on the elements that are important for your analysis without getting distracted by irrelevant data.
- Sort and filter: Histogram data filtering:
- In Foundry, sort and filter is one of the most commonly-used features. You can view all the different options in a given column with a histogram board and then select the specific categories that you want to work with.
- Attribute data filtering:
- Use KEEP if you want to filter down to only data that meet the set criteria.
- Use REMOVE if you want to exclude only data that meet the set criteria.
- Multiple data filters:
- Use AND MATCHING if you want to filter to data that meet multiple conditions at the same time.
- Use OR MATCHING if you want to filter to data that meet multiple conditions but not necessarily at the same time/within the same row of data.
- Adjusting filters:
- When a user creates a new analysis for a specific filter (for example,
carrier_code=DL), other users can easily replicate their analysis by changing the filter to their use case (for example,carrier_code=UA) or removing the filter altogether to get a global analysis.
Analytical operations are applied to an entire column by default, to facilitate analysis of large datasets. If you would like to run an analysis on a smaller selection of rows (similar to selecting a specific cell range in Excel), filter the data down to the desired rows before applying the operations.
To see more filtering options, review our filter data documentation.
How do I change the view of my analysis?
There are four options available to change the view of your analysis. You can perform the following:
-
SORT columns by ascending or descending order
-
REORDER columns
-
REMOVE columns
-
ADD columns: See the VLOOKUP section in common Excel analysis equivalents in Foundry
-
Create an automated Notepad document: You have the option to add your Contour analysis outputs into an automated Notepad to present your data in executive summaries. This report will change based on the refreshed data in Foundry, removing any need to recreate the same report.
How do I apply a calculation?
To perform a new calculation in Contour you need to select Add a Column in an expression board. However, instead of cell-level operations, Foundry operates on column-level operations. Instead of a formula multiplying A1 * B1 to return to cell C1, Foundry will multiply column1 * column2 (multiplying every corresponding row-level entry in column1 and column2) to return column3.
What are common Microsoft Excel analysis equivalents in Foundry?
Below are some of the most common Microsoft Excel functions and their expression equivalents in Contour. You can apply these calculations in the same way as discussed in How do I apply a calculation?.
- Excel: IF(logical_test, value_if_true, [value_if_false])
- Foundry:
CASE WHEN logical_test THEN value_if_true ELSE value_if_false END -
Example: If I want to create a column that returns
yesif the flight starts inJFKandnoif otherwise, the expression will look like:CASE WHEN "origin" = 'JFK' THEN 'yes' ELSE 'no' END -
Excel: CONCAT(cell1, [cell2],…)
- Foundry:
CONCAT("col1", ["col2"],...) -
Example: If I want to create a column with a unique key for each order by concatenating
timestampandorder_ID_numbercolumns, the expression will look like:CONCAT("timestamp","order_ID_number")
-
Excel: VALUE(text)
- Foundry:
CAST("col1" AS DOUBLE) - Note: You can convert your column datatype to a
STRING,INTEGER,BOOLEAN,DATE,TIMESTAMP, orLONGby replacing theDOUBLEtype in the expression -
Example: If I want to be able to perform multiplication on some columns but one of the necessary columns
costis classified as a string, the expression will look like:CAST("cost" AS DOUBLE)
-
Excel: LEFT(text, [num_chars])
- Foundry:
SUBSTRING("col1", num2, num3) - Note:
num2is the start index andnum3is the length of the substring - Example: If I want to extract the letters in the brackets from a column of
airport_display_namesuch as[ALB] Albany International + Albany, NY,[AZA] Phoenix - Mesa Gateway + Phoenix, AZ,[CLT] Charlotte Douglas International + Charlotte, NC, the expression will look like:SUBSTRING("airport_display_name", 2, 3)and would return a column withALB,AZA, andCLT.
Read the expression board and support expression syntax documentation for more information.
- Excel: VLOOKUP(value, table, col_index, [range_lookup]) & ADD in columns from other datasets
- Foundry: JOIN board.
- The join board lets you join your current working dataset to another dataset and merge the matching results into your data.
Example: You are working with the dataset
flightsand you would like to add the columnmanufacturerandnumber_of_seatsfrom theaircraftdataset.
FLIGHTS DATASET EXAMPLE
| flight_id | date | origin | tail_num |
|---|---|---|---|
| 999 | 2018-04-01 | LAS | N227FR |
| --- | --- | --- | --- |
| 997 | 2018-07-27 | MIA | N303FR |
| … |
AIRCRAFT DATASET EXAMPLE
| tail_number | manufacturer | number_of_seats |
|---|---|---|
| N303FR | Airbus | 186 |
| --- | --- | --- |
| N227FR | Airbus | 180 |
| … |
You could use the join board to enrich your flights dataset with columns manufacturer and number_of_seats from the aircraft dataset. Since both datasets share a column referencing the tail number, we can use this column to join on. If your datasets have columns with the same name that are not join keys, Contour will prompt you to add a prefix to the column names. Then, fill out the following fields:
- Choose a join type to perform: left join (
Add columns), inner join (Intersection), right join (Switch to dataset) or full join. - Choose which columns from the other dataset to add to your current working set. By default, all columns from both sets are returned.
- Choose one or more keys from each set. If you use multiple join keys, you can choose to
Match AnyorMatch Allconditions.
Enriched dataset example
Your enriched dataset will look like this:
| flight_id | date | origin | tail_num | manufacturer | number_of_seats |
|---|---|---|---|---|---|
| 999 | 2018-04-01 | LAS | N227FR | Airbus | 186 |
| --- | --- | --- | --- | --- | --- |
| 997 | 2018-07-27 | MIA | N303FR | Airbus | 180 |
How do I create a pivot table?
You can quickly compute multiple aggregate values of your data across multiple dimensions through a pivot table board.
To interact with the entirety of pivoted data, use the Switch to pivoted data option on the board which will transition your Contour analysis to the fully-computed pivoted data for all boards beneath the pivot table board.
How do I apply a function across an entire series of data?
You can do this in Foundry with the Aggregate option in the expression board. Note that instead of range-level operations that you can select in another spreadsheet software, Foundry operates on column-level operations, so your columns will need to be properly filtered to the rows that you are interested in.
- Function:
- Result:
What are common Microsoft Excel aggregate equivalents in Foundry?
Below are some of the most common Excel aggregate functions and the Contour expression equivalents. You can apply these calculations in the same way as displayed in the How do I apply a function across an entire series of data? question.
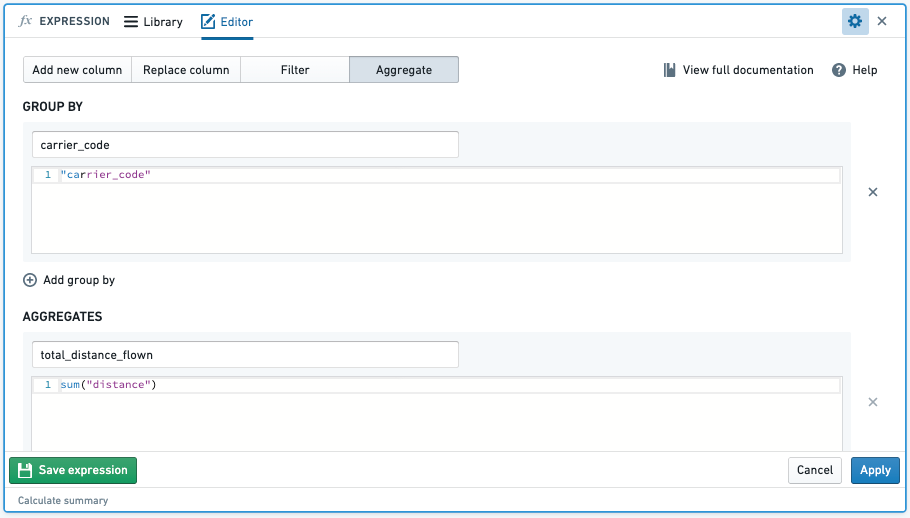
- SUM(): When you aggregate with the sum function, this will sum the values of an aggregate column across specified column groupings.
- Example: Find the
total_distance_flownof each airline (carrier_code)- Function:
- Function:
- Result:

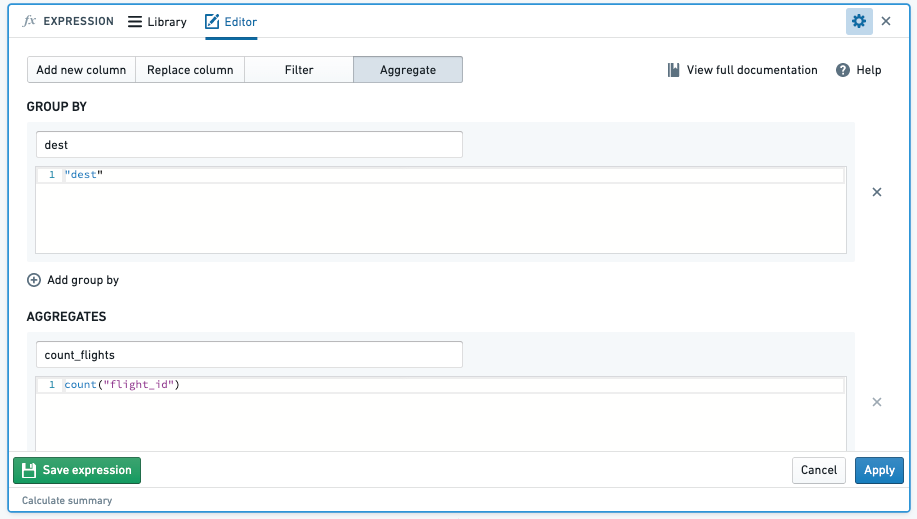
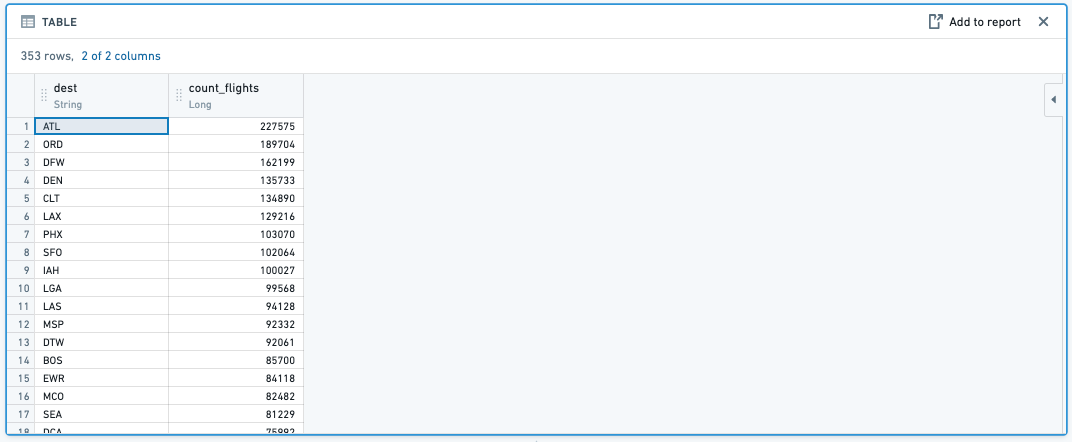
- COUNT(): When you aggregate with the count function, this will count the number of entries of an aggregate column across specified column groupings.
-
Example: Find the number of flights by
carrier_codeby aggregating the count of totalflight_id -
Function:
-
Result:
-
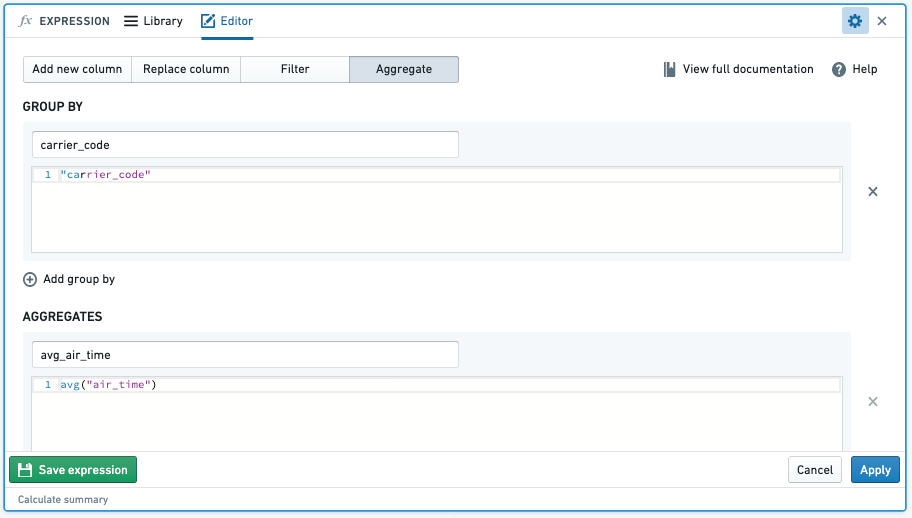
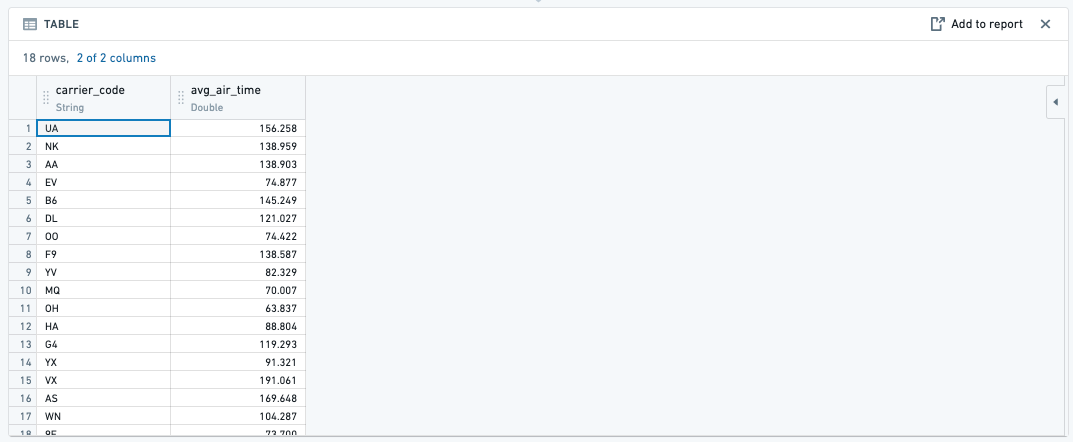
AVG(): When you aggregate with the avg function, this will average, for example, the
air_timeof eachcarrier_code. -
MAX(): When you aggregate with the max function, this will find the maximum, for example, of the
air_timeof eachcarrier_code. -
MIN(): When you aggregate with the min function, this will find the minimum, for example, of the
air_timeof eachcarrier_code.
What are some ways to check my analysis?
You can add another board to check your resulting dataset.
-
Table board: By inserting a table board after an analysis, you are able to quickly check to see if the new columns that you added were right or if the logic of a previous board resulted in the intended outcome.
-
Histogram board: By inserting a histogram board after an analysis, you are provided with a quick overview of the different data categories to give a general sense of the data or if the filtered categories are correct.
What is the difference between saving a dataset in Contour and creating one in Code Repositories or Code Workbook?
The process of saving a dataset from a Contour analysis is largely the same as creating a dataset from a code repository or Code Workbook - the logic is translated into a series of Spark transformations, executed across the cluster, and saved into a dataset that is stored in a distributed file system. There is no row limit restriction when saving an analysis as a new dataset. That said, the greater the scale of the data, the longer it will take to save, as underlying computation will be more computationally expensive. Note that there are, however, row limits when exporting data from Contour, which is distinct from saving a path as a dataset.
When I attempt to export it gives me a 100,000 row limit. Is this correct?
Yes, that is correct. There is a 100K row export limit from Contour. If you need to export more than that, you can save the result of Contour as a dataset, and then download it from the Actions dropdown on that Dataset preview page.
The limits for both Contour export and dataset downloads may differ between Foundry enrollments based on partner requirements.
Can I automatically update a Contour analysis path?
At this time, there is no way to automatically update a Contour analysis path; this must be completed manually. However, it is possible to set a schedule for the resulting dataset of the analysis. Once you have saved the dataset, you can then open the dataset preview and, from the Actions dropdown menu, choose Manage schedules. The resulting dataset will then build based on the way you have configured the schedule.
Can I revert changes to my Contour analysis?
Yes, you can revert changes by selecting Undo in the top right corner of your screen.

When I try to duplicate my analysis, I just see a spinner and nothing happens. What do I do?
This may happen when your analysis has too many paths. Try deleting unnecessary paths and duplicating again.
Review the section on general performance issues for more information.
Unable to build dataset from Contour
I am receiving an error message when building a dataset from Contour.
Refer to our guidance on builds and checks errors for more information.
Pivot table not showing all data
Pivot table previews do not show all the data within the table. The pivot table calculates aggregates over the entire dataset, and reduces the output to the first 100 columns or 10,000 values to prevent slow browser performance. To get the definitive answer for these large pivot tables, you will need to Switch to pivoted data. You can read more about this in the pivot table documentation.
To troubleshoot, perform the following steps:
- Try Switching to pivoted data, which will force Contour to compute the entirety of the dataset.
- View the data in a table board. Note that the pivot board will remain incomplete.
- If possible, insert a filter board above your pivot table to trim down the data you are passing through (this should also improve performance overall), but, again it does not change the fact that the pivot table board will only compute over the first 10,000 cells of the pivot table (for performance reasons).
- To get a complete export, select Switch to pivoted data, then use an export board or use the export option from the end of the current path.
Duplicate column found in pivot table
My pivot table fails to compute due to a duplicate column. This is generally because there are column names that are equivalent apart from casing.
To troubleshoot, perform the following steps:
- Check if any of the columns in the columns section of your pivot table contain values that are the same apart from casing (for example,
Testandtest). Foundry dataset column names are case-insensitive, so when the column is pivoted, the columnsTestandtestare considered duplicates. - Map any such values to a single casing so that when the column is pivoted there are no collisions.
General performance issues
Your Contour is slow, and you would like to figure out what is causing the decreased performance.
To troubleshoot, perform the following steps:
-
First, check to determine whether the input datasets used in your analysis are using Parquet or Avro files; if not, ensure that you are working on an appropriate, clean version of the dataset.
-
Check if you are using a raw, ingested version of a dataset that is stored as a CSV file, which is non-performant. This is the most frequent cause of this issue.
-
Check the partitions of your input dataset(s). If datasets used in your analysis are poorly partitioned, then this will result in slower performance.
-
To check the size of files in your input datasets go to Dataset → Details → Files → Dataset Files.
-
The files should be at least 128 MB each. If they are too small, or much too large, you will need to re-partition them.
-
If you have a very long path, then you should materialize intermediate datasets and create new paths that begin with these newly materialized datasets. This will reduce redundancy in logic execution as each board executes the full query path required to create the board (such as the transformation logic used, if any, in all previous boards).
-
Consider reducing the number of paths that you have in an analysis. This can slow down the browser performance specifically when using the path overview screen.
For further reading, review our Contour analysis performance optimization documentation.
count_distinct() fails in a window function in the expression board
The count_distinct() function is not available inside window functions due a limitation in Spark. Review official Spark documentation ↗.
You can potentially achieve the same thing (depending on the window logic you are looking to use) in the pivot table board, which offers a unique count aggregation option. You can define your "window" as the rows/column combinations and then generate a unique count for each intersection.
中文翻译
Contour 常见问题解答
以下是一些关于 Contour 的常见问题。 如需了解一般信息,请查看我们的 Contour 文档。
- 如何开始新的分析?
- 如何在平台中查找相关数据?
- 如何与同事分享分析?
- 如何创建用于分析的初始数据集?
- 如何更改分析的视图?
- 如何应用计算?
- Foundry 中常见的 Microsoft Excel 分析等效功能有哪些?
- 如何创建数据透视表?
- 如何对整个数据系列应用函数?
- Foundry 中常见的 Microsoft Excel 聚合等效功能有哪些?
- 有哪些方法可以检查我的分析?
- 在 Contour 中保存数据集与在代码仓库或代码工作簿中创建数据集有什么区别?
- 当我尝试导出时,提示有 100,000 行的限制。这是正确的吗?
- 我可以自动更新 Contour 分析路径吗?
- 我可以撤销对 Contour 分析的更改吗?
- 当我尝试复制分析时,只看到一个加载图标,没有任何反应。我该怎么办?
- 无法从 Contour 构建数据集
- 数据透视表未显示所有数据
- 数据透视表中发现重复列
- 一般性能问题
count_distinct()在表达式面板的窗口函数中失败
如何开始新的分析?
在 Foundry 中,每个用户都有自己的文件夹,称为 Your files(你的文件)。这是一个用户可以用数据进行原型设计并与他人分享结果的文件夹。在该文件夹中,用户可以创建他们的第一个分析:
- 导航到工作区导航栏上的 Files(文件)部分。
- 导航到 Your files(你的文件)选项卡。
- 选择 +New(+新建),然后从下拉菜单中选择 Analysis(分析),创建一个新的分析。
- 新分析生成后,选择 +Create a new path(+创建新路径)。
- 在相应文件夹中选择要分析的数据集。
如何在平台中查找相关数据?
发现数据主要有两种方法:
-
搜索(Search): Foundry 在页面左侧的工作区侧边栏中有一个平台范围的搜索工具。该工具将搜索平台中的所有资源,是当你知道数据集名称时查找数据的绝佳方法。请注意,搜索工具可用于查找平台中的任何资源,包括电子表格、Contour 分析和代码工作簿。
-
数据目录(Data Catalog): Foundry 的 Data catalog(数据目录)包含经过清理和整理的数据集,可供业务分析师和数据科学家直接使用。如果你对平台中已存在哪些数据感到好奇,Data Catalog(数据目录)是一个很好的起点,可以直接从主页访问。你可以通过选择工作区侧边栏中的 Home(主页)返回主页。
如何与同事分享分析?
与同事共享资源意味着他们必须有权访问你正在工作的项目。选择 Share(分享)并发送共享 URL,或直接将你的同事添加到资源中,以自动通知他们。如果你的同事收到 Permission denied(权限被拒绝)错误,他们将需要请求访问权限。一旦你的同事对项目的访问权限获得批准,他们将能够通过电子邮件看到你与他们分享的分析。
如何创建用于分析的初始数据集?
由于数据通常以原始形式存在于 Foundry 平台中,因此在开始创建分析之前,了解如何过滤数据非常重要。数据过滤将允许你专注于分析中重要的元素,而不会被不相关的数据分散注意力。
- 排序和过滤:直方图数据过滤:
- 在 Foundry 中,排序和过滤是最常用的功能之一。你可以通过直方图面板查看给定列中的所有不同选项,然后选择要处理的具体类别。
- 属性数据过滤:
- 使用 KEEP(保留)仅过滤出符合设定条件的数据。
- 使用 REMOVE(移除)排除仅符合设定条件的数据。
- 多重数据过滤:
- 使用 AND MATCHING(且匹配)过滤出同时满足多个条件的数据。
- 使用 OR MATCHING(或匹配)过滤出满足多个条件但不一定同时满足/在同一行数据中的数据。
- 调整过滤:
- 当用户为特定过滤器(例如,
carrier_code=DL)创建新分析时,其他用户可以轻松地通过将过滤器更改为他们的用例(例如,carrier_code=UA)或完全移除过滤器来获得全局分析,从而复制他们的分析。
默认情况下,分析操作应用于整个列,以便于分析大型数据集。如果要在较小的行选择上运行分析(类似于在 Excel 中选择特定单元格范围),请在应用操作之前将数据过滤到所需的行。
要查看更多过滤选项,请查看我们的过滤数据文档。
如何更改分析的视图?
有四个选项可用于更改分析的视图。你可以执行以下操作:
- 排序(SORT) 列:按升序或降序排列
- 重新排序(REORDER) 列
- 移除(REMOVE) 列
- 添加(ADD) 列:请参阅 Foundry 中常见的 Excel 分析等效功能 中的 VLOOKUP 部分
- 创建自动化的记事本文档:你可以选择将 Contour 分析输出添加到自动化的 Notepad(记事本)中,以在高层摘要中呈现数据。此报告将根据 Foundry 中刷新的数据而变化,无需重新创建相同的报告。
如何应用计算?
要在 Contour 中执行新的计算,你需要在表达式面板中选择 Add a Column(添加列)。但是,与单元格级操作不同,Foundry 执行的是列级操作。Foundry 不是用公式将 A1 * B1 返回到单元格 C1,而是将 column1 * column2(将 column1 和 column2 中每个对应的行级条目相乘)来返回 column3。
Foundry 中常见的 Microsoft Excel 分析等效功能有哪些?
以下是 Contour 中一些最常见的 Microsoft Excel 函数及其表达式等效功能。你可以按照如何应用计算?中讨论的方式应用这些计算。
- Excel: IF(logical_test, value_if_true, [value_if_false])
- Foundry:
CASE WHEN logical_test THEN value_if_true ELSE value_if_false END -
示例:如果我想创建一个列,当航班从
JFK出发时返回yes,否则返回no,表达式如下:CASE WHEN "origin" = 'JFK' THEN 'yes' ELSE 'no' END -
Excel: CONCAT(cell1, [cell2],…)
- Foundry:
CONCAT("col1", ["col2"],...) -
示例:如果我想通过连接
timestamp和order_ID_number列来创建一个包含每个订单唯一键的列,表达式如下:CONCAT("timestamp","order_ID_number")
-
Excel: VALUE(text)
- Foundry:
CAST("col1" AS DOUBLE) - 注意:你可以通过替换表达式中的
DOUBLE类型,将列数据类型转换为STRING、INTEGER、BOOLEAN、DATE、TIMESTAMP或LONG -
示例:如果我想对某些列执行乘法运算,但其中一个必要的列
cost被归类为字符串,表达式如下:CAST("cost" AS DOUBLE)
-
Excel: LEFT(text, [num_chars])
- Foundry:
SUBSTRING("col1", num2, num3) - 注意:
num2是起始索引,num3是子字符串的长度 - 示例:如果我想从
airport_display_name列中提取括号内的字母,例如[ALB] Albany International + Albany, NY、[AZA] Phoenix - Mesa Gateway + Phoenix, AZ、[CLT] Charlotte Douglas International + Charlotte, NC,表达式如下:SUBSTRING("airport_display_name", 2, 3)将返回包含ALB、AZA和CLT的列。
- Excel: VLOOKUP(value, table, col_index, [range_lookup]) & 从其他数据集添加列
- Foundry: JOIN(连接)面板。
- 连接面板允许你将当前工作数据集连接到另一个数据集,并将匹配的结果合并到你的数据中。
示例:你正在处理
flights数据集,并希望从aircraft数据集中添加manufacturer和number_of_seats列。
航班数据集示例
| flight_id | date | origin | tail_num |
|---|---|---|---|
| 999 | 2018-04-01 | LAS | N227FR |
| --- | --- | --- | --- |
| 997 | 2018-07-27 | MIA | N303FR |
| … |
飞机数据集示例
| tail_number | manufacturer | number_of_seats |
|---|---|---|
| N303FR | Airbus | 186 |
| --- | --- | --- |
| N227FR | Airbus | 180 |
| … |
你可以使用连接面板,用 aircraft 数据集中的 manufacturer 和 number_of_seats 列来丰富你的 flights 数据集。由于两个数据集共享一个引用尾号的列,我们可以使用此列进行连接。如果你的数据集有同名的列但不是连接键,Contour 将提示你为列名添加前缀。然后,填写以下字段:
- 选择要执行的连接类型:左连接(
Add columns添加列)、内连接(Intersection交集)、右连接(Switch to dataset切换到数据集)或全连接。 - 选择要从其他数据集添加到当前工作集中的列。默认情况下,返回两个数据集中的所有列。
- 从每个数据集中选择一个或多个键。如果使用多个连接键,你可以选择
Match Any(匹配任一)或Match All(匹配所有)条件。
丰富后的数据集示例
你的丰富数据集将如下所示:
| flight_id | date | origin | tail_num | manufacturer | number_of_seats |
|---|---|---|---|---|---|
| 999 | 2018-04-01 | LAS | N227FR | Airbus | 186 |
| --- | --- | --- | --- | --- | --- |
| 997 | 2018-07-27 | MIA | N303FR | Airbus | 180 |
如何创建数据透视表?
你可以通过 pivot table(数据透视表)面板快速计算数据在多个维度上的多个聚合值。
要与整个透视数据交互,请使用面板上的 Switch to pivoted data(切换到透视数据)选项,该选项会将你的 Contour 分析转换为数据透视表面板下方所有面板的完全计算的透视数据。
如何对整个数据系列应用函数?
你可以在 Foundry 中使用 表达式 面板中的 Aggregate(聚合)选项来执行此操作。请注意,与可以在其他电子表格软件中选择的范围级操作不同,Foundry 执行的是列级操作,因此你需要将列正确过滤到感兴趣的行。
- 函数:
- 结果:
Foundry 中常见的 Microsoft Excel 聚合等效功能有哪些?
以下是一些最常见的 Excel 聚合函数及其 Contour 表达式等效功能。你可以按照如何对整个数据系列应用函数?问题中显示的方式应用这些计算。
- SUM(): 当你使用 sum 函数进行聚合时,这将跨指定的列分组对聚合列的值求和。
- 示例:查找每个航空公司(
carrier_code)的total_distance_flown(总飞行距离)- 函数:
- 函数:
- 结果:
- COUNT(): 当你使用 count 函数进行聚合时,这将跨指定的列分组计算聚合列的条目数。
-
示例:通过聚合
flight_id的总数来查找按carrier_code划分的航班数量 -
函数:
-
结果:
-
AVG(): 当你使用 avg 函数进行聚合时,这将计算平均值,例如,每个
carrier_code的air_time(空中时间)。 -
MAX(): 当你使用 max 函数进行聚合时,这将找到最大值,例如,每个
carrier_code的air_time(空中时间)。 -
MIN(): 当你使用 min 函数进行聚合时,这将找到最小值,例如,每个
carrier_code的air_time(空中时间)。
有哪些方法可以检查我的分析?
你可以添加另一个面板来检查结果数据集。
-
表格面板: 通过在分析后插入一个 table(表格)面板,你可以快速检查添加的新列是否正确,或者前面面板的逻辑是否产生了预期的结果。
-
直方图面板: 通过在分析后插入一个 histogram(直方图)面板,你可以快速概览不同的数据类别,从而对数据有一个总体了解,或者检查过滤的类别是否正确。
在 Contour 中保存数据集与在代码仓库或代码工作簿中创建数据集有什么区别?
从 Contour 分析保存数据集的过程与从代码仓库或代码工作簿创建数据集基本相同——逻辑被转换为一系列 Spark 转换,在集群上执行,并保存到存储在分布式文件系统中的数据集中。将分析保存为新数据集时没有行数限制。也就是说,数据规模越大,保存所需的时间就越长,因为底层计算的计算成本会更高。请注意,从 Contour 导出数据时存在行数限制,这与将路径保存为数据集是不同的。
当我尝试导出时,提示有 100,000 行的限制。这是正确的吗?
是的,这是正确的。从 Contour 导出有 10 万行的限制。如果你需要导出更多行,可以将 Contour 的结果保存为数据集,然后从该 Dataset preview(数据集预览)页面的 Actions(操作)下拉菜单中下载。
Contour 导出和数据集下载的限制可能因 Foundry 部署环境的不同而有所差异,具体取决于合作伙伴的要求。
我可以自动更新 Contour 分析路径吗?
目前,还没有办法自动更新 Contour 分析路径;这必须手动完成。但是,可以为分析的最终结果数据集设置计划。保存数据集后,你可以打开数据集预览,然后从 Actions(操作)下拉菜单中选择 Manage schedules(管理计划)。结果数据集将根据你配置计划的方式构建。
我可以撤销对 Contour 分析的更改吗?
是的,你可以通过选择屏幕右上角的 Undo(撤销)来撤销更改。
当我尝试复制分析时,只看到一个加载图标,没有任何反应。我该怎么办?
当你的分析有太多路径时,可能会发生这种情况。尝试删除不必要的路径,然后再次复制。
请查看一般性能问题部分以获取更多信息。
无法从 Contour 构建数据集
我在从 Contour 构建数据集时收到一条错误消息。
请参考我们关于构建和检查错误的指南以获取更多信息。
数据透视表未显示所有数据
数据透视表预览不会显示表中的所有数据。数据透视表会计算整个数据集的聚合,并将输出减少到前 100 列或 10,000 个值,以防止浏览器性能下降。要获得这些大型数据透视表的确定答案,你需要 Switch to pivoted data(切换到透视数据)。你可以在数据透视表文档中阅读更多相关信息。
要解决此问题,请执行以下步骤:
- 尝试 Switching to pivoted data(切换到透视数据),这将强制 Contour 计算整个数据集。
- 在表格面板中查看数据。请注意,数据透视表面板将保持不完整状态。
- 如果可能,在数据透视表上方插入一个过滤面板,以修剪你传递的数据(这也应该能提高整体性能),但同样,这并不能改变数据透视表面板仅计算数据透视表前 10,000 个单元格的事实(出于性能原因)。
- 要获得完整的导出,请选择 Switch to pivoted data(切换到透视数据),然后使用导出面板或使用当前路径末尾的导出选项。
数据透视表中发现重复列
我的数据透视表由于重复列而无法计算。这通常是因为存在除大小写外相同的列名。
要解决此问题,请执行以下步骤:
- 检查数据透视表列部分中的任何列是否包含除大小写外相同的值(例如,
Test和test)。Foundry 数据集列名不区分大小写,因此当列被透视时,列Test和test被视为重复项。 - 将所有此类值映射为单一大小写,以便在透视列时不会发生冲突。
一般性能问题
你的 Contour 运行缓慢,你想找出导致性能下降的原因。
要解决此问题,请执行以下步骤:
-
首先,检查分析中使用的输入数据集是否使用 Parquet 或 Avro 文件;如果不是,请确保你正在处理适当、干净版本的数据集。
-
检查你是否正在使用以 CSV 文件形式存储的原始摄取版本的数据集,这种格式性能不佳。这是此问题最常见的原因。
-
检查输入数据集的分区。如果分析中使用的数据集分区不佳,则会导致性能下降。
-
要检查输入数据集中的文件大小,请转到 Dataset → Details → Files → Dataset Files(数据集 → 详情 → 文件 → 数据集文件)。
-
每个文件应至少为 128 MB。如果文件太小或太大,你将需要重新分区。
-
如果你的路径非常长,则应物化中间数据集,并创建以这些新物化数据集开头的新路径。这将减少逻辑执行中的冗余,因为每个面板都会执行创建该面板所需的完整查询路径(例如,所有前面面板中使用的转换逻辑,如果有的话)。
-
考虑减少分析中的路径数量。这可能会降低浏览器性能,尤其是在使用路径概览屏幕时。
如需进一步阅读,请查看我们的 Contour 分析性能优化文档。
count_distinct() 在表达式面板的窗口函数中失败
由于 Spark 的限制,count_distinct() 函数在窗口函数中不可用。请查看官方 Spark 文档 ↗。
你可以在数据透视表面板中实现相同的功能(取决于你想要使用的窗口逻辑),该面板提供了唯一计数聚合选项。你可以将"窗口"定义为行/列组合,然后为每个交集生成唯一计数。