Optimizing your analysis(优化分析)
Follow the suggestions below to improve the performance of your Contour Analysis and Dashboard.
Structuring your analysis
Minimizing duplicated logic
Should your analysis contain multiple paths applying largely duplicated logic to compute multiple outputs (e.g. applying the same filtering criteria across multiple paths, with only the final few paths used to compute a new metric), minimize the duplication of these paths. Instead, use a common input path and use that path’s result as an input for other paths.
Joining
Filter datasets as much as possible prior to joining. You can filter a dataset prior to joining by opening it in a new Contour path, adding filter conditions, and then joining to the result of that path instead of the dataset. This can lead to significant performance improvements.
Joining on multiple conditions with "any match"
Multi-condition joins with "any match" are particularly resource-intensive in Spark because of the distributed fashion of the data. Make sure to reduce the scale as much as possible before the operation, such as by pushing filters upstream. A multi-condition join can often be avoided by designing the analysis differently, for example by applying multiple separate joins and unioning the results.
Saving as a dataset
If the output of a board or series of boards is used by multiple downstream boards (in the same path or in different paths), then it can be very beneficial to save the output as a Foundry dataset and start all downstream computations from this newly saved dataset. This is especially true if the output involves complicated calculations (e.g. join, pivot table, or regex filter).
Using parameters
If a user changes the value of a parameter, all boards in your analysis will be recalculated. Imagine an analysis that has a starting dataset, many computations not using parameters, and then a filter using a parameter. If possible, save the output as a dataset after the computations not using parameters. This will ensure that recomputing charts and graphs in reports are quickly refreshed for new parameter entries.
Frontend performance
To ensure loading your analysis is quick and responsive, we recommend no more than 15 - 20 paths per analysis. Break out your analysis into multiple analyses if you go beyond this limit.
Using filters
Use specific filters as much as possible
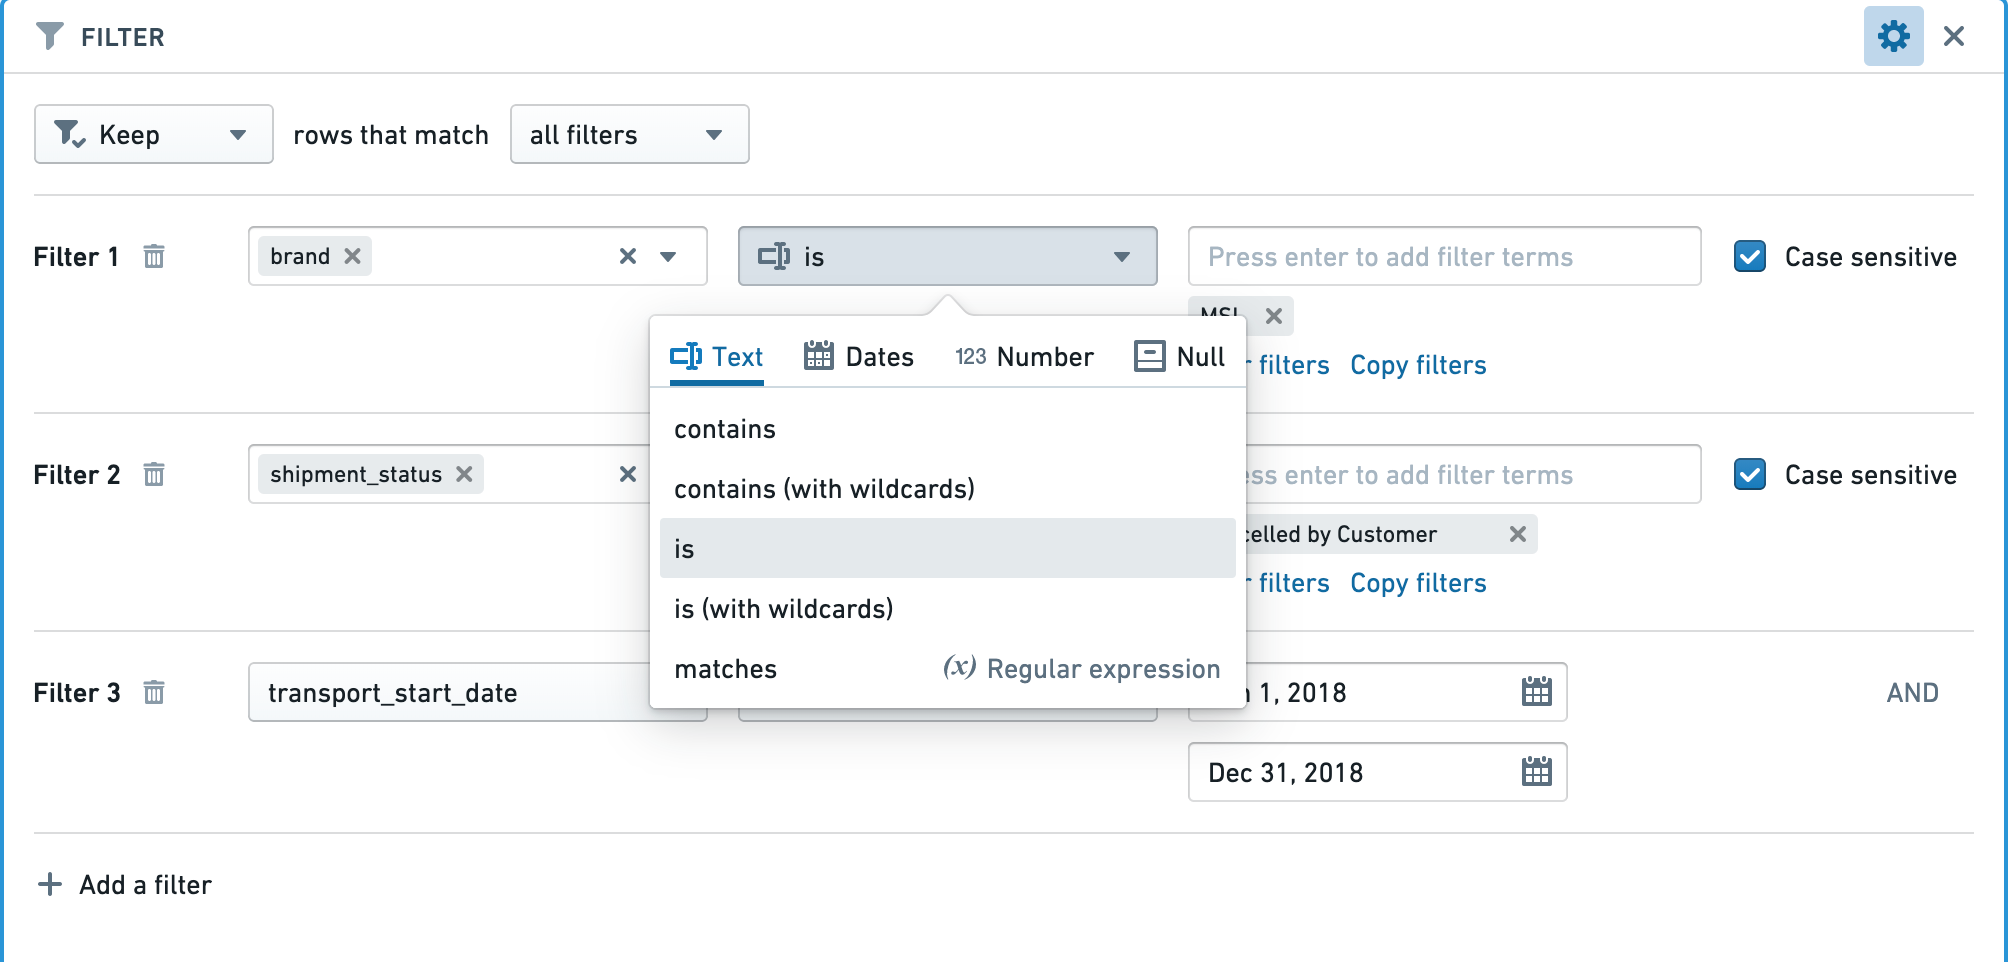
When applying filters, enable case sensitivity, bias towards "exact match" filters rather than "contains", or make the underlying data either all uppercase or all lowercase. In particular, use of regular expressions is computationally expensive.
For example, you might improve performance by ensuring that datasets are either all lowercase or all uppercase (to enable case sensitive filtering) and that the filtering criteria are as precise as possible and use an exact match (e.g. is instead of contains for text).
Apply the correct filters for the column types
Make sure the right type of filter is used for the type of column.
For example, when applying a filter for an exact number in an integer, long, or double type column, using a “Number equal to” filter will be significantly faster than a “String exact match” filter.

Input datasets
Partitioning
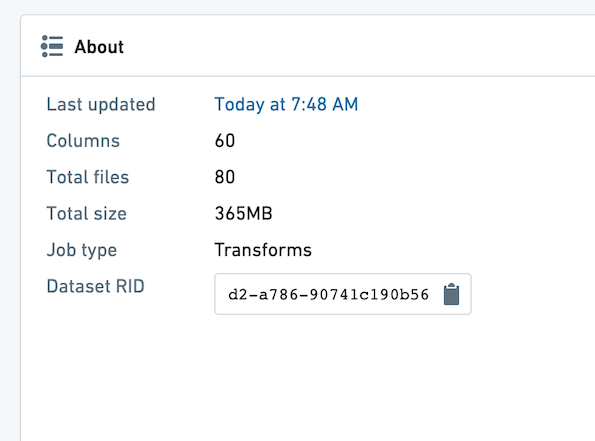
Make sure the datasets used in your Contour analysis are well partitioned. The average file size of the files within a dataset should be at least 128 MB. You can see the number of files and size of your dataset by opening the dataset and choosing the "About" tab.
In the example below, there are 80 files, and the dataset is 365 MB. This is poorly partitioned, as there should be at most three files.
If you find your input dataset is poorly partitioned, you can partition it in an upstream transform.
To partition an upstream Python transform, add this line of code:
# Repartition – df.repartition(num_output_partitions)
df = df.repartition(3)
For more information on Partitioning and its effects in Spark, review the Spark optimization concepts.
Projections
Dataset owners can configure projections on their datasets to improve the performance of various types of queries.
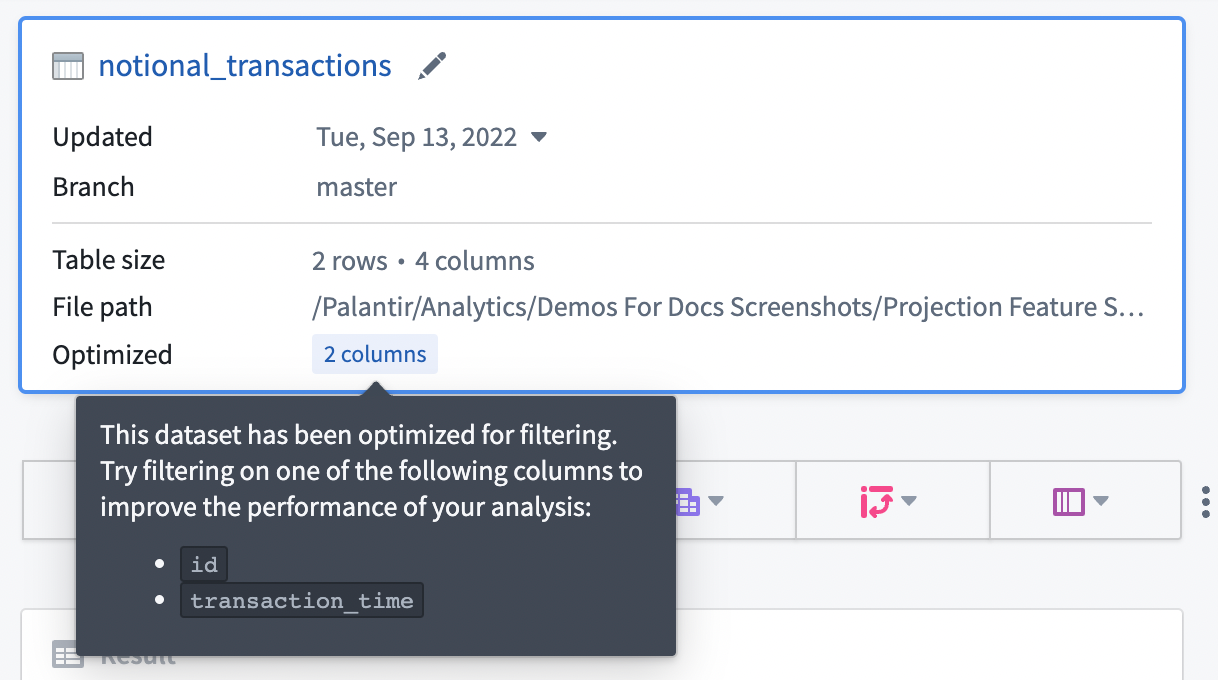
If your input dataset has projections configured, the projections will be listed under the Optimized section in the starting board, as shown below. You can take advantage of the projections by configuring an exact-match filter on one of the listed columns. Contour currently only exposes information about filter-optimized projections where the projection includes all columns of the input dataset.
In general, we recommend configuring projections on datasets with predictable query patterns to improve performance in Contour. As a means to reduce compute usage, we recommend setting up projections only when a dataset is used often (i.e. 10-100 reads of a specific pattern per write). Building and storing projections requires additional computation each time a dataset is written, so savings are realized only when that computation is consistently leveraged downstream.
Maintaining and sharing your analysis
All optimizations mentioned above will be especially important if your Contour analysis is consumed by a large audience.
Scheduling builds
When setting schedules for datasets built in Contour, plan adequately for the frequency. After setting the schedule, monitor builds to make sure that the schedules are surfacing data at the frequency you need without consuming resources by building unnecessarily. For example, if a dataset built in Contour takes in a dataset that is updated daily, it is unnecessary for the dataset to be built every hour.
Limiting parameters
If your Contour analysis is consumed in a Report by a large audience, it is best to limit the number of parameters to the minimum amount.
An ideal report widget performs some filtering based on the parameter values that the user enters and then an aggregation to show a relevant visualization to the user. Ideally, all other complicated logic (joins and pivots) is precomputed in a dataset in Foundry so each parameter change does not require recomputation.
中文翻译
优化分析
遵循以下建议可提升 Contour 分析与仪表板的性能。
分析结构优化
最小化重复逻辑
若分析中包含多条路径,对大量重复逻辑进行计算以生成多个输出(例如,在多条路径中应用相同的筛选条件,仅最后几条路径用于计算新指标),请尽量减少这些路径的重复。建议使用公共输入路径,并将该路径的结果作为其他路径的输入。
连接操作
在连接前尽可能对数据集进行筛选。您可以在新 Contour 路径中打开数据集,添加筛选条件,然后连接到该路径的结果而非原始数据集,从而在连接前完成筛选。这能显著提升性能。
多条件"任意匹配"连接
在 Spark 中,由于数据的分布式特性,使用"任意匹配"的多条件连接会消耗大量资源。请务必在操作前尽可能缩小数据规模,例如将筛选条件前移。通常可通过重新设计分析来避免多条件连接,例如分别执行多次连接后合并结果。
保存为数据集
若某个面板或系列面板的输出被多个下游面板(同一路径或不同路径)使用,将输出保存为 Foundry 数据集并让所有下游计算从此新数据集开始,将带来显著收益。当输出涉及复杂计算(如连接、透视表或正则表达式筛选)时尤其如此。
使用参数
用户更改参数值时,分析中的所有面板都将重新计算。假设分析包含起始数据集、大量未使用参数的计算,以及一个使用参数的筛选器。如有可能,请在未使用参数的计算完成后将输出保存为数据集。这可确保报告中的图表在输入新参数时快速刷新。
前端性能
为确保分析加载快速响应,建议每个分析不超过 15-20 条路径。若超出此限制,请将分析拆分为多个独立分析。
使用筛选器
尽可能使用精确筛选
应用筛选器时,启用大小写敏感,优先使用"精确匹配"而非"包含",或将底层数据统一转换为大写或小写。特别要注意,正则表达式的计算开销较大。
例如,可通过确保数据集全部为小写或大写(以启用大小写敏感筛选),并使筛选条件尽可能精确且使用精确匹配(如文本使用等于而非包含)来提升性能。
为列类型应用正确筛选器
确保为列类型使用正确的筛选器。
例如,在整数、长整数或双精度类型列中筛选精确数值时,使用"数字等于"筛选器将比"字符串精确匹配"筛选器快得多。
输入数据集
分区优化
确保 Contour 分析中使用的数据集分区合理。数据集内文件的平均大小应至少为 128 MB。您可通过打开数据集并选择"关于"选项卡查看文件数量和大小。
在以下示例中,共有 80 个文件,数据集大小为 365 MB。这属于分区不当,因为最多应只有三个文件。
若发现输入数据集分区不合理,可在上游转换中进行分区优化。
要对上游 Python 转换进行分区,请添加以下代码行:
# 重新分区 – df.repartition(num_output_partitions)
df = df.repartition(3)
有关分区及其在 Spark 中影响的更多信息,请参阅 Spark 优化概念。
投影优化
数据集所有者可为其数据集配置投影,以提升各类查询的性能。
若输入数据集已配置投影,这些投影将显示在起始面板的优化部分(如下所示)。您可通过在所列列上配置精确匹配筛选器来利用投影。Contour 目前仅显示筛选优化投影的信息,且要求投影包含输入数据集的所有列。
通常,我们建议在具有可预测查询模式的数据集上配置投影,以提升 Contour 性能。为减少计算资源消耗,建议仅在数据集被频繁使用时(即每次写入对应 10-100 次特定模式的读取)设置投影。构建和存储投影需要在每次写入数据集时进行额外计算,因此仅当下游持续利用该计算时才能实现资源节省。
维护与共享分析
若您的 Contour 分析被大量用户使用,上述所有优化将尤为重要。
调度构建
为 Contour 中构建的数据集设置调度时,请合理规划频率。设置调度后,需监控构建情况,确保调度以所需频率更新数据,同时避免不必要的资源消耗。例如,若 Contour 中构建的数据集依赖每日更新的数据集,则无需每小时构建一次。
限制参数
若您的 Contour 分析在报告中被大量用户使用,最好将参数数量控制在最小范围。
理想的报告组件应基于用户输入的参数值进行筛选,然后通过聚合向用户展示相关可视化内容。理想情况下,所有其他复杂逻辑(连接和透视)应在 Foundry 数据集中预先计算,这样每次参数更改时无需重新计算。