Canvas mode(画布模式(Canvas mode))
Quiver provides two view mode options for building your analysis; canvas mode and graph mode. You can see the active view mode and switch between modes with the toggle at the top right corner of the screen. You can optionally choose a default view mode so your analysis always opens to your preference.

A Quiver canvas is a page where you can display, rearrange, and resize the cards in your analysis. You can create multiple canvases and organize your cards across different canvases. Canvas mode is ideal for organizing a customized view of your analysis, as this mode offers the flexibility to choose which content to display or hide, and the ability to adjust the size and position of cards on the page. As an analysis gets large, organizing cards across multiple canvases can also help improve performance, as only cards on the active canvas are computed.
Unlike a Contour path, a Quiver canvas is used for display and organization only. Rearranging cards in your canvas will not affect the underlying sequence of data transformation. Similarly, removing a card from your canvas will only delete the card if the card is not referenced by any other cards.

Note that adding cards to your analysis on a canvas will also make them visible in the graph. However, cards added in graph mode are not automatically placed on a canvas. You can add or remove cards from a canvas at any time through a node's actions menu in graph mode, or by using the Analysis Contents panel.
Add cards to a canvas
When you add cards to your analysis, they will be displayed on the canvas. New cards are commonly added using the next actions menu that appears on hover below each card. Adding a card from the next actions menu will add the new card directly below the card that was used to open the next actions menu. You can also add new cards from the Search cards window, which can be accessed from the top menu bar. These cards will be placed at the bottom of the canvas. The ordering of the cards does not necessarily indicate dependencies between the cards.
In the example below, we use the next actions menu to add a numeric aggregation based on the object set. Notice that the card is added directly below the object set, and the object set input is already configured.
Next, we add the same numeric aggregation using the Search cards window. This gets added to the bottom of the canvas, and requires manual configuration of the object set input.
These two numeric aggregation cards were added in different ways and are on different parts of the canvas, but they represent the exact same calculation.
Create and rename a canvas
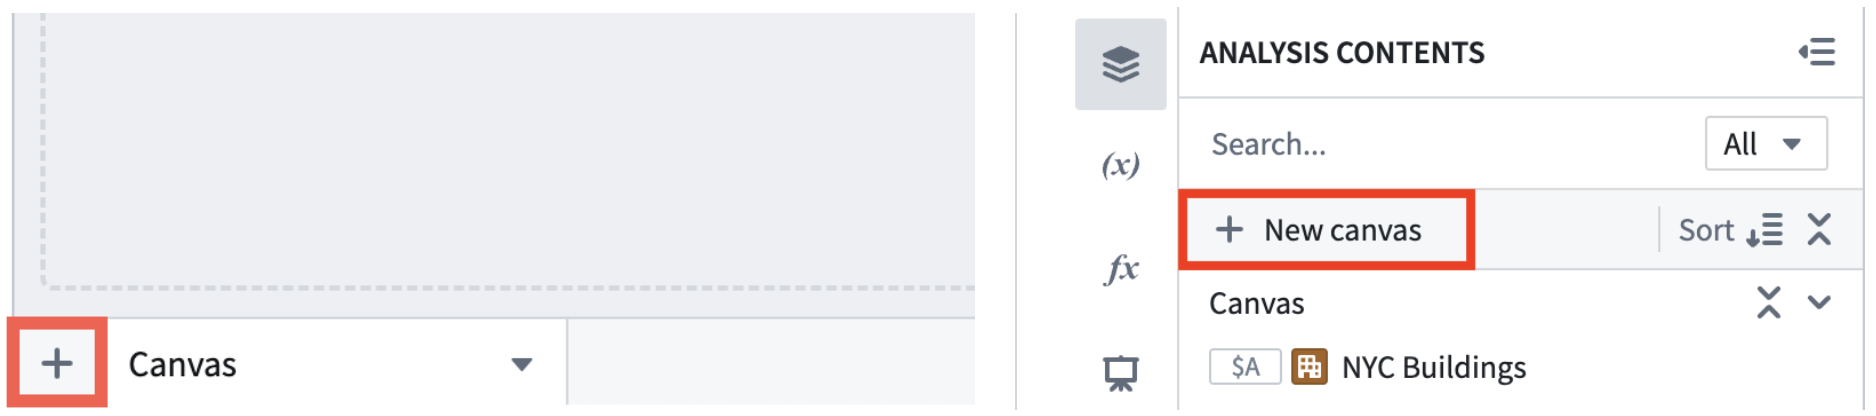
A single Quiver analysis can contain multiple canvases. To create a new canvas, select the + icon in the lower-left corner. You can also create a new canvas from the analysis content panel with the + New canvas option.
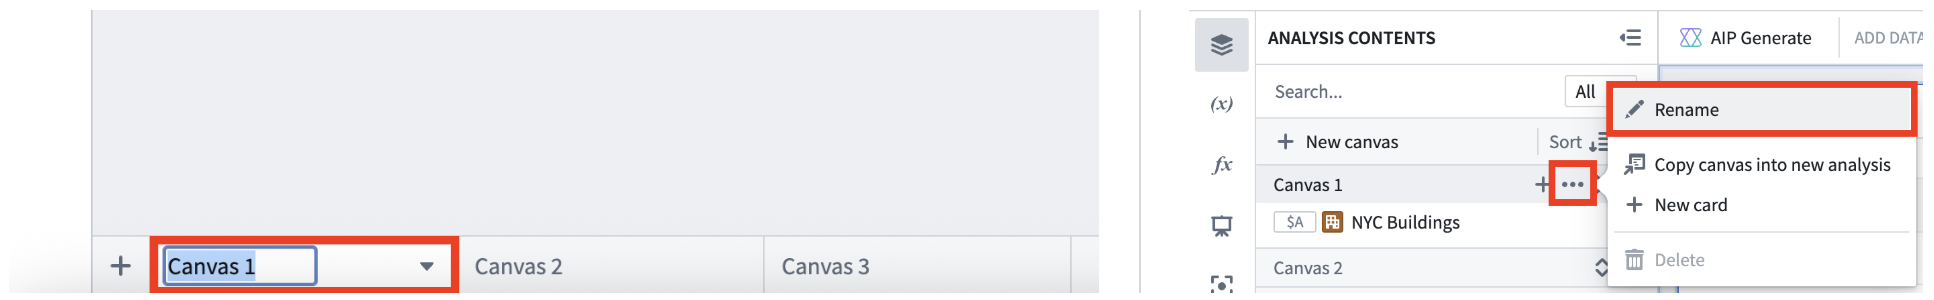
Once created, you can rename a canvas by double clicking the canvas name on the tab at the bottom of your workspace. You can also rename a canvas in the analysis content panel. Find the canvas you want to rename, select the More actions icon (...), and select Rename.
Resize and rearrange cards on the canvas
You can move cards on the canvas by using the drag handle on the upper-left corner of the card. Select and drag the handle to place the card in the desired location. Cards can also be resized by selecting and dragging the lower-right corner. In the example below, cards on a canvas are resized and rearranged to make the analysis more presentable.
Move cards between canvases
You can reorder and move cards between canvases by dragging and dropping content in the analysis contents panel. In the example below, the analysis is split up into three canvases; one for data, one for metrics, and one for charts. This is a common way to keep Quiver analyses organized as they grow.
Cards can also be moved between canvases using the Move to canvas option in a card's More actions menu. Simply select the canvas you would like to move the card to.
Hide cards
In some cases, you may want to hide cards that contain logic but are not relevant when displaying data. To do this, select the More actions menu icon (...) from the top right of a card and choose Hide. You can also hide and show cards from the Analysis Contents panel using the eye icon that appears on hover. Cards that are hidden from the canvas are still visible at the bottom of the Analysis Contents panel with a red eye slash icon ( ). Select the eye slash icon to make the card reappear at the bottom of the canvas.
Delete cards
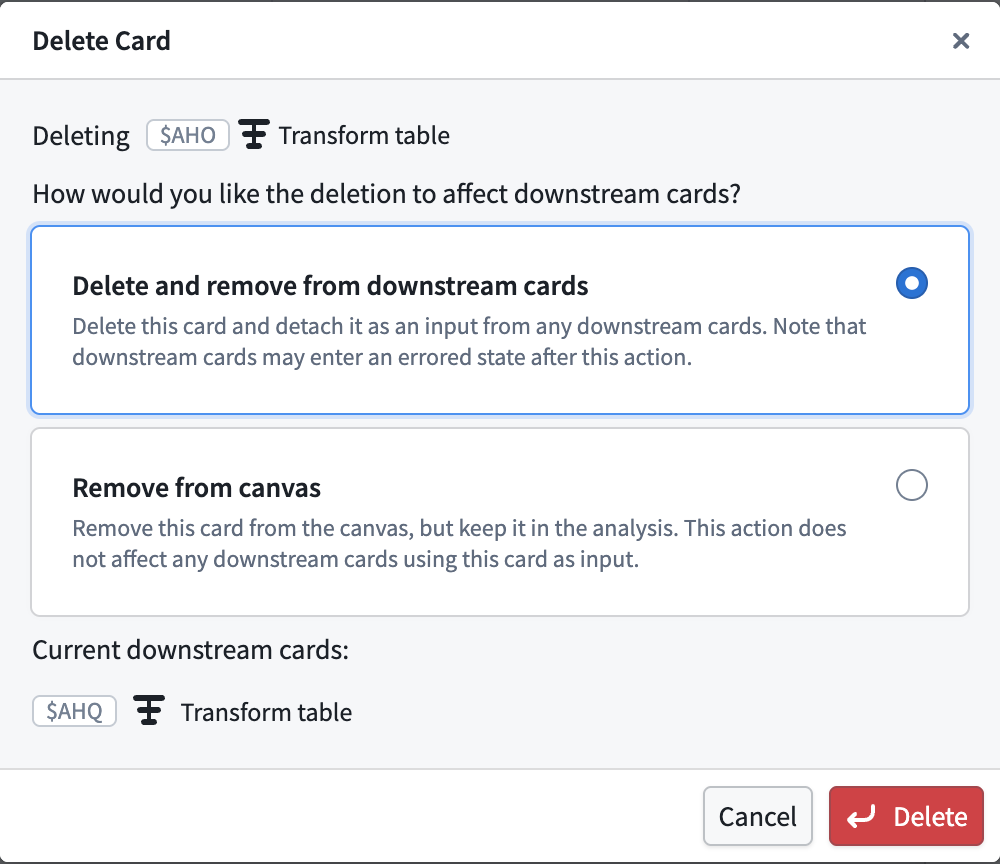
When you delete a card in canvas mode, a dialog appears with options for how to handle the deletion:
- Delete and remove from downstream cards: Removes the card from the analysis entirely. Any cards that use it as an input will have that input configuration set to empty, leaving them in a potentially errored state. If the card has no downstream dependencies, the option will be to Delete from analysis.
- Remove from canvas: Keeps the card in the analysis and keeps dependent cards unchanged. The card will appear in the Not in canvas section of the Analysis Contents panel, where it can be configured, added back to a canvas, or deleted.
Card dependencies
When using canvas mode, you can see all card dependencies (inputs and outputs) in the collapsible Dependencies panel at the bottom of the card's editor panel. Selecting an input or output card will open the card's editor panel and scroll to it, simplifying navigation on the canvas.
You can also view card dependencies by using graph mode. By default, the graph shows all cards in the analysis, but you can choose to View dependencies in graph to enter a dependency view, which shows only the ancestors and descendants of the selected card.
中文翻译
画布模式(Canvas mode)
Quiver 提供两种视图模式来构建分析:画布模式(canvas mode)和图谱模式(graph mode)。您可以通过屏幕右上角的切换按钮查看当前视图模式并在两种模式间切换。您也可以选择设置默认视图模式,以便分析始终按您的偏好打开。
Quiver 画布是一个页面,您可以在其中显示、重新排列和调整分析中卡片(cards)的大小。您可以创建多个画布,并将卡片组织到不同的画布上。画布模式非常适合组织自定义的分析视图,因为该模式提供了灵活的选择,可以决定显示或隐藏哪些内容,并能调整卡片在页面上的大小和位置。随着分析规模变大,将卡片组织到多个画布上还有助于提升性能,因为只有当前活动画布上的卡片才会被计算。
与 Contour 路径(path)不同,Quiver 画布仅用于显示和组织。在画布上重新排列卡片不会影响底层的数据转换顺序。同样,从画布中移除一张卡片,仅当该卡片未被其他任何卡片引用时,才会将其删除。
请注意,在画布上向分析中添加卡片也会使其在图谱中可见。但是,在图谱模式中添加的卡片不会自动放置在画布上。您可以随时通过图谱模式中节点的操作菜单,或使用分析内容(Analysis Contents)面板,将卡片添加至画布或从画布中移除。
向画布添加卡片
当您向分析中添加卡片时,它们会显示在画布上。新卡片通常通过悬停在每张卡片下方时出现的下一步操作菜单(next actions menu)来添加。从下一步操作菜单添加卡片时,新卡片会直接添加到用于打开该菜单的卡片下方。您也可以通过顶部菜单栏中的搜索卡片(Search cards)窗口添加新卡片,这些卡片将放置在画布底部。卡片的排列顺序并不一定表示卡片之间的依赖关系。
在下面的示例中,我们使用下一步操作菜单,基于对象集添加了一个数值聚合。请注意,该卡片直接添加到了对象集下方,并且对象集输入已经配置完成。
接下来,我们使用搜索卡片窗口添加相同的数值聚合。该卡片被添加到画布底部,并且需要手动配置对象集输入。
这两张数值聚合卡片以不同方式添加,位于画布的不同位置,但它们代表完全相同的计算。
创建和重命名画布
单个 Quiver 分析可以包含多个画布。要创建新画布,请选择左下角的 + 图标。您也可以从分析内容面板中选择 + 新建画布(+ New canvas)选项来创建新画布。
创建后,您可以通过双击工作区底部选项卡上的画布名称来重命名画布。您也可以在分析内容面板中重命名画布。找到要重命名的画布,选择更多操作(More actions)图标(...),然后选择重命名(Rename)。
调整画布上卡片的大小和位置
您可以通过卡片左上角的拖动手柄来移动卡片。选择并拖动手柄,将卡片放置在所需位置。您也可以通过选择并拖动卡片的右下角来调整其大小。在下面的示例中,画布上的卡片被调整大小和重新排列,以使分析更易于展示。
在画布之间移动卡片
您可以通过在分析内容面板中拖放内容来重新排序卡片或在画布之间移动卡片。在下面的示例中,分析被拆分为三个画布:一个用于数据,一个用于指标,一个用于图表。这是在 Quiver 分析规模增长时保持其组织有序的常见方式。
您也可以使用卡片更多操作菜单中的移动到画布(Move to canvas)选项,在画布之间移动卡片。只需选择您想要将卡片移动到的目标画布即可。
隐藏卡片
在某些情况下,您可能希望隐藏包含逻辑但与数据展示无关的卡片。为此,请选择卡片右上角的更多操作菜单图标(...),然后选择隐藏(Hide)。您也可以在分析内容面板中,通过悬停时出现的眼睛图标来隐藏或显示卡片。从画布中隐藏的卡片仍会显示在分析内容面板底部,并带有一个红色眼睛斜杠图标()。选择该眼睛斜杠图标可使卡片重新出现在画布底部。
删除卡片
在画布模式下删除卡片时,会弹出一个对话框,提供处理删除的选项:
- 删除并从下游卡片中移除(Delete and remove from downstream cards): 从分析中彻底移除该卡片。任何将其作为输入的卡片,其输入配置将变为空,可能导致这些卡片处于错误状态。如果该卡片没有下游依赖项,则选项将变为从分析中删除(Delete from analysis)。
- 从画布中移除(Remove from canvas): 将卡片保留在分析中,并保持依赖卡片不变。该卡片将出现在分析内容面板的不在画布中(Not in canvas)部分,您可以在那里对其进行配置、重新添加回画布或删除。
卡片依赖关系
使用画布模式时,您可以在卡片编辑器面板底部可折叠的依赖关系(Dependencies)面板中查看所有卡片依赖关系(输入和输出)。选择某个输入或输出卡片将打开该卡片的编辑器面板并滚动到该卡片,从而简化画布上的导航。
您也可以使用图谱模式查看卡片依赖关系。默认情况下,图谱显示分析中的所有卡片,但您可以选择在图谱中查看依赖关系(View dependencies in graph)以进入依赖视图(dependency view),该视图仅显示所选卡片的祖先和后代。