Graph mode(图形模式)
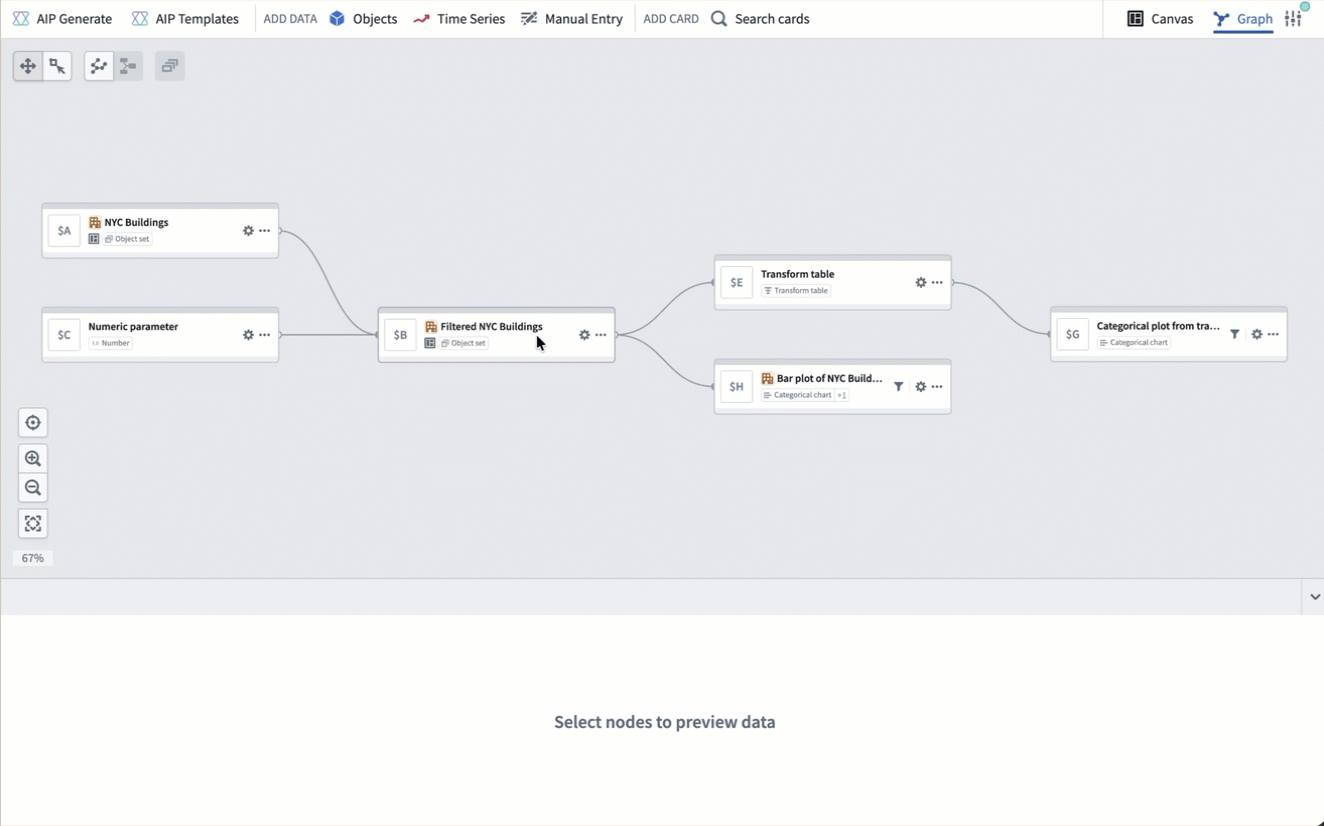
Quiver provides two view modes for building your analysis: canvas mode and graph mode. In graph mode, cards are represented as nodes on a graph, and inputs and outputs are represented by links. The graph uses a left-to-right layout, making it easy to follow the direction of your data.
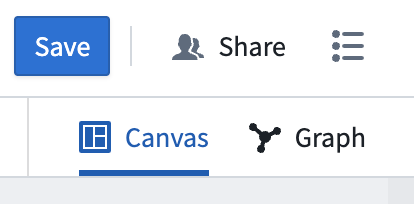
You can see the active view mode and switch between view modes by using the view mode toggle at the upper-right corner of the screen. You can select your preferred default view mode in view mode settings.
Compact node design
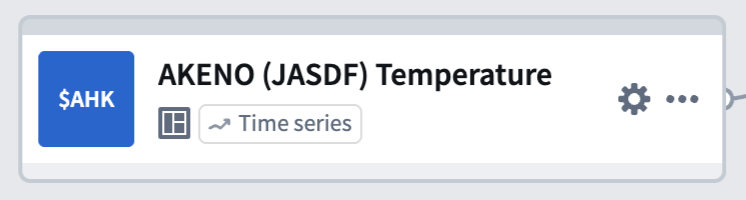
Each node on the graph displays a compact view of its title, identifier, and type. You can access common actions such as configuring inputs, adding the node to a canvas, or deleting the node from its More actions menu or by right-clicking on the node. This compact layout keeps the graph fast and responsive, even for large analyses with many cards.
Preview panel
Card outputs are displayed in a dedicated preview panel at the bottom of the screen. Select a node to see its preview. You can pin previews to keep them visible as you navigate the graph, or view two previews side by side in a split-screen layout. Pinned previews remain open even when you select a different node, making it easy to compare outputs across cards.
Graph and canvas isolation
Cards added in graph mode are not automatically placed on a canvas. You can add or remove nodes from a canvas at any time through a node's actions menu, so you can focus on building your analysis in the graph and manage canvas placement later.
In canvas mode, you can also remove a card from the canvas without deleting it from the analysis. For more details, review the delete cards section in the canvas mode documentation.
Card deletion
When you delete a card that is used as an input to other cards, a dialog appears with options for how to handle the deletion:
- Delete and remove from downstream cards: Removes the card from the analysis entirely and detaches it as an input from any downstream cards. The corresponding input configuration in dependent cards will be set to empty. Note that downstream cards may enter an errored state after this action.
- Delete this card and all descendants: Deletes the card along with all cards that depend on it. This is useful for removing an entire branch of the graph at once.
View cards on the graph
From the canvas, you can switch to graph mode to view card dependencies by choosing one of two options in the More actions menu at the top right of a card:
- View in graph switches the view to graph mode, centering on the selected card with the context of all other cards on the graph.
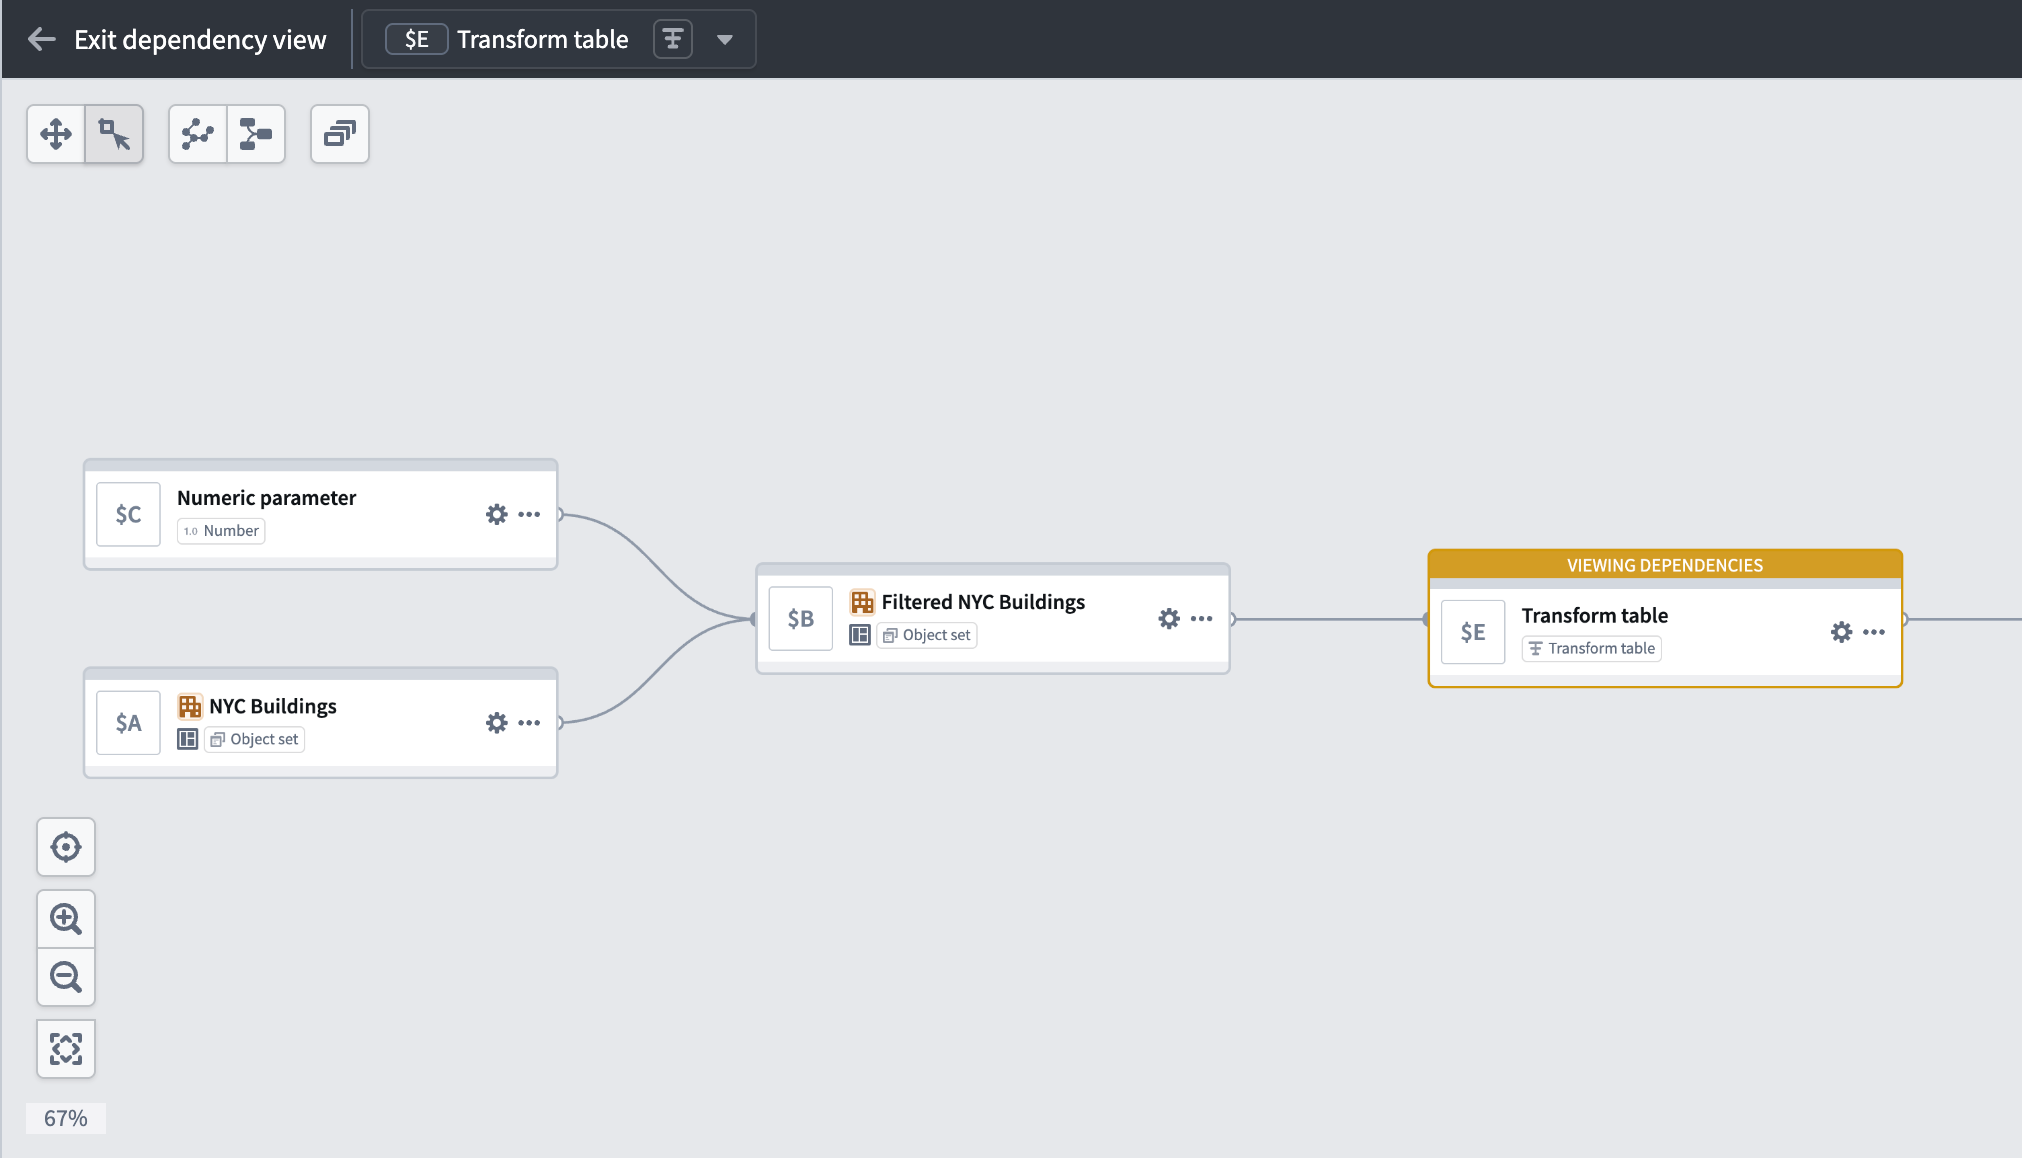
- View dependencies in graph switches the view to graph mode in a dependency view, which shows only the selected card and its dependencies. To see the entire graph again, select Exit dependency view.
Dependency view
In a large analysis, it can be difficult to trace how a specific card was created or which cards depend on it. A dependency view narrows the graph to show only the selected card and its upstream and downstream dependencies.
To enter a dependency view, right-click on a node and select View dependencies. You can also enter a dependency view from the canvas by selecting View dependencies in graph in a card's More actions menu.
To exit a dependency view and see the entire graph, select Exit dependency view in the top left of the graph.
Node interactions
You can interact with nodes on the graph in several ways:
- Select a node to highlight it. The card's preview appears in the preview panel.
- Double-click a node to zoom and center it on the screen and open the card editor on the right side. Where applicable, the next actions menu appears below the node.
- Right-click a node to open a context menu with actions such as viewing dependencies, hiding the node, managing canvas placement, and assigning color groups.
- Drag across the graph background while in Selection mode to select multiple nodes for bulk actions.
Select inputs from graph
When configuring a node in graph mode, you can select its inputs by picking nodes directly from the graph instead of searching through a list. Open the card editor for a node, then select the input field. Eligible nodes on the graph are highlighted, and you can select one to set it as the input. This is particularly useful in large analyses where scrolling through a dropdown would be slower than selecting a nearby node visually.
Bulk actions
While in Selection mode, you can select multiple nodes by dragging across the graph background. Once selected, a toolbar appears in the graph navigation toolbar with the following actions:
- Color nodes: Assign the selected nodes to a color group.
- Hide: Remove the selected nodes from view without deleting them from the analysis.
- Canvas organization: Add the selected nodes to a canvas, move them between canvases, or remove them from a canvas.
- Delete: Delete the selected nodes from the analysis.
Graph navigation
You can adjust the graph layout by selecting and dragging nodes to the desired location. If you want to clean up the layout and reset the nodes to their original position, select Layout nodes. You can also switch between Panning mode and Selection mode to control whether mouse interactions move the graph or select and deselect nodes.
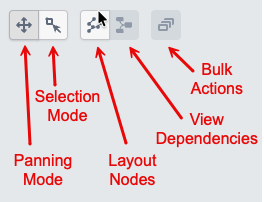
In the bottom left corner of the graph, navigation buttons allow you to zoom in and out, zoom to fit all nodes on the screen, and reset the layout of the graph.
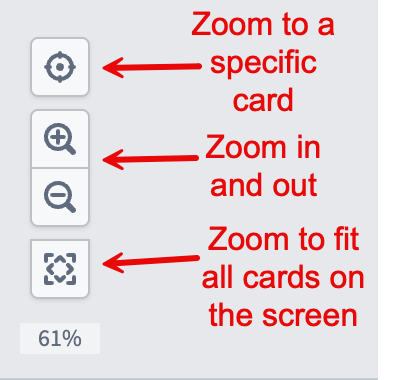
You can also zoom in and out by scrolling up and down on the graph background.
Organize your graph
As your analysis grows, you can use color groups to assign colors to related nodes and visually distinguish different sections of your graph. Color groups can be collapsed into a single node or hidden to reduce clutter. You can also hide individual nodes and filter the graph by node type, canvas, dashboard, or function.
中文翻译
图形模式
Quiver 提供两种视图模式来构建分析:画布模式和图形模式(graph mode)。在图形模式下,卡片以图形节点(node)的形式呈现,输入和输出则通过连线(link)表示。图形采用从左到右的布局,便于追踪数据流向。
您可以通过屏幕右上角的视图模式切换按钮查看当前视图模式并进行切换。您可以在视图模式设置中选择偏好的默认视图模式。
紧凑节点设计
图形上的每个节点以紧凑视图显示其标题、标识符和类型。您可以通过节点的更多操作菜单或右键单击节点,访问配置输入、将节点添加到画布或删除节点等常用操作。这种紧凑布局使图形保持快速响应,即使分析中包含大量卡片也能流畅运行。
预览面板
卡片输出显示在屏幕底部的专用预览面板(preview panel)中。选择节点即可查看其预览。您可以固定预览(pin previews),使其在浏览图形时保持可见,也可以分屏并排查看两个预览。固定后的预览在您选择其他节点时仍会保持打开状态,方便跨卡片比较输出结果。
图形与画布的隔离
在图形模式下添加的卡片不会自动放置到画布上。您可以随时通过节点的操作菜单将节点添加到画布或从画布中移除,从而专注于在图形中构建分析,稍后再管理画布布局。
在画布模式下,您也可以将卡片从画布中移除,而无需将其从分析中删除。更多详情,请参阅画布模式文档中的删除卡片部分。
卡片删除
当您删除用作其他卡片输入的卡片时,会弹出一个对话框,提供以下删除处理选项:
- 删除并从下游卡片中移除: 将卡片从分析中完全删除,并将其作为输入从所有下游卡片中解除关联。依赖卡片中对应的输入配置将设置为空。请注意,执行此操作后,下游卡片可能进入错误状态。
- 删除此卡片及其所有后代: 删除该卡片及其所有依赖卡片。此功能适用于一次性移除图形的整个分支。
在图形上查看卡片
从画布中,您可以通过选择卡片右上角更多操作菜单中的两个选项之一,切换到图形模式查看卡片依赖关系:
- 在图形中查看 将视图切换到图形模式,并以所选卡片为中心,同时显示图形上所有其他卡片的上下文。
- 在图形中查看依赖关系 将视图切换到依赖关系视图下的图形模式,仅显示所选卡片及其依赖关系。要查看完整图形,请选择退出依赖关系视图。
依赖关系视图
在大型分析中,追踪特定卡片的创建方式或哪些卡片依赖该卡片可能较为困难。依赖关系视图(dependency view)可将图形范围缩小,仅显示所选卡片及其上游和下游依赖关系。
要进入依赖关系视图,请右键单击节点并选择查看依赖关系。您也可以从画布中,通过卡片更多操作菜单中的在图形中查看依赖关系进入该视图。
要退出依赖关系视图并查看完整图形,请选择图形左上角的退出依赖关系视图。
节点交互
您可以通过多种方式与图形上的节点进行交互:
- 单击 节点可将其高亮显示。卡片的预览将显示在预览面板中。
- 双击 节点可将其放大并居中显示在屏幕上,同时在右侧打开卡片编辑器。在适用情况下,下一步操作菜单将显示在节点下方。
- 右键单击 节点可打开上下文菜单,提供查看依赖关系、隐藏节点、管理画布布局和分配颜色组等操作。
- 在选择模式下,拖拽图形背景可选中多个节点,以便执行批量操作。
从图形中选择输入
在图形模式下配置节点时,您可以直接从图形中选取节点作为输入,而无需在列表中搜索。打开节点的卡片编辑器,然后选择输入字段。图形上符合条件的节点会高亮显示,您可以选择其中一个作为输入。这在大型分析中尤为实用,因为通过下拉列表滚动查找可能比直观地选择附近节点更慢。
批量操作
在选择模式下,您可以通过拖拽图形背景选中多个节点。选中后,图形导航工具栏中会出现一个工具栏,提供以下操作:
- 为节点着色: 将选中的节点分配到颜色组。
- 隐藏: 将选中的节点从视图中移除,但不从分析中删除。
- 画布组织: 将选中的节点添加到画布、在画布之间移动或从画布中移除。
- 删除: 从分析中删除选中的节点。
图形导航
您可以通过选中并拖拽节点来调整图形布局。如需清理布局并将节点重置到原始位置,请选择布局节点。您还可以在平移模式和选择模式之间切换,以控制鼠标交互是移动图形还是选中/取消选中节点。
在图形左下角,导航按钮允许您放大和缩小、缩放以适配屏幕上的所有节点,以及重置图形布局。
您还可以通过在图形背景上向上或向下滚动来进行放大和缩小。
组织图形
随着分析的扩展,您可以使用颜色组为相关节点分配颜色,从而在视觉上区分图形的不同部分。颜色组可以折叠为单个节点或隐藏,以减少杂乱。您还可以按节点类型、画布、仪表板或函数隐藏单个节点和过滤图形。