Settings(设置)
Quiver has a range of settings to configure the display and format in your analysis. These apply to the current analysis, but not to other analyses that you create.
To open the settings panel, click the cog icon in the side panels bar.

Personal default settings
Quiver allows you to save your preferred analysis settings. These personal default settings will be automatically applied to any new analysis you create. You also have the option to apply your personal settings to existing analyses.
:::callout{theme="danger"} Applying your personal default settings to an existing analysis will overwrite existing analysis settings. This will affect other users who work in the analysis as well. :::
Global settings
- Allow settings to be controlled: When enabled, it is possible to toggle global settings on and off using a Boolean parameter configured in the analysis.
- Enable apply button: Enable an apply button that will globally track updates to cards in your analysis, and stop them from propagating to the rest of the analysis until the button is clicked. This can significantly improve performance for analyses/dashboards where many updates are expected before recomputing results (when changing multiple parameters, for example).
- Wait for first apply: If using the apply button, setting this option will prevent the analysis from initially loading until the apply button is clicked. This can help with performance when the default state of an analysis/dashboard operates on too large of a data scale, and users are expected to apply filters before viewing the analysis.
- Enable Marketplace linting: When enabled, Marketplace templating is turned on for all dashboards in the analysis, and Marketplace validation runs automatically as you interact with the analysis. Errors and warnings appear in a validation indicator next to the Save button. You can disable templating for an individual dashboard from its dashboard settings. Learn more about adding a Quiver dashboard to a Marketplace product.
- Display mode: Control whether canvases are displayed in Light mode or Dark mode. The selected mode will apply to all canvases, dashboards, and templates in your analysis. Note that when a dashboard or template is embedded in an application outside of Quiver (e.g. Workshop or Object View), the display mode will be inherited from the parent application.
- Load settings: Controls how cards in your canvas are loaded upon opening. Choosing the Visible setting can improve loading performance for large analyses.
- All: All items in the canvas will be loaded.
- Visible: Only the visible items in the canvas will be loaded. Remaining items will be loaded as they become visible (e.g. when scrolling down).
- Default: The current default setting is All.
Categorical charts overrides
- Override default plot colors/labels: These settings allow you to override colors and display names of segments and labels on object charts in your analysis. If changed, local chart display settings take priority over global settings.
By default, data from different object sets on the same chart will be in different colors; similarly, different segments in a segmented chart will also be colored differently. Without intervention, these colors will be assigned to ensure maximum contrast between categories. You can set global color overrides if desired, whether because of color preferences or because you would like certain segments to be colored the same on all charts throughout the analysis.
Note that to assign a specific color to each bar in a bar chart, you first need to segment your series by the same property that you grouped by.
Time series tooltips settings
- Show plot tooltips: When this is disabled, you will no longer get a tooltip showing time series name, timestamp, and value when you hover over a time series.
- Show tooltip values as Range/Min/Max/Average: By default, Quiver renders 1,000 buckets on each time series chart. This setting is used for high frequency cases where multiple underlying time series points are in a single bucket.
- Show time in tooltips: When this is disabled, you will not see the timestamp value when you hover over a time series.
- Show series titles in tooltips: When this is disabled, you will not see the time series name when you hover over a time series.
- Wrap long text in tooltips: When this is enabled, long text in tooltips will be broken across lines.
- Show time series hover markers: When this is enabled, the cursor's hovering crosshairs will also be shown on other charts. This is useful for tracking cursor position across multiple charts.
- Auto collapse chart selection menu: When this is enabled, the time series chart selection menu that is created by selecting or dragging a chart will be in a collapsed state by default, with the option to expand it.
Time series axes and legends
- Enable analysis wide streaming: Activates streaming on all axes, enabling cards downstream of time series to refresh their value every time the time series updates. Note that this may negatively impact performance. If your use case does not require downstream cards to reflect streaming updates, enabling the Stream individual axis setting in the time axis configuration will provide improved performance compared to this setting.
- Streaming refresh rate: Controls how often time series plots on streaming-enabled axes will poll new data.
- Initial default time axis range: When the default time axis is created, for example, when a time series property is first added to an analysis, it will use this value as its initial range. There are three ways to set this range:
- Full data range: The axis will initialize to the start and end dates of the time series plots on it. This may negatively impact performance for large time series. This is the default for analyses created before this global setting was added.
- Fixed range: The axis will initialize to a static start and end date, for example, from
2025-5-21to2025-06-04. - Relative range: Sets the view range to a range relative to today, for example, from
2 weeks agotoNow. By default, the range's end date is set toNow, but a specific time can be input by selecting the Set to relative time toggle on the top right. The default setting for new analyses is a relative range of2 weeks agotoNow. - Show interpolation line: When this is enabled, Quiver will display a dotted line (marking before and after) when external interpolation is set to anything other than NONE.
- Show hidden plots in legend: When this is enabled, hidden plots will be shown in their chart's legend in a grayed out state.
- Show values in legend: When this is enabled, the last point of the time series will be displayed under its name in the chart legend.
- Show time axis scrubber: When this is enabled, a "scrubber" is displayed on each chart's x-axis. A scrubber is used to independently control the start and end display of charts.
- Abbreviated numbers in axes: Controls whether numbers are abbreviated with letters or displayed in full (for example, 120.0k is an abbreviation of 120,000).
- Group plots by data: When this is enabled, time series plots with the same root object and data provider will be grouped together in the chart editor and legend. Additional utilities are shown based on the root object, making it easier to pivot between root objects.
- Overlay y-axes by default: When this is enabled, y-axes will overlay chart data by default. When this is disabled, y-axes will shift chart data to the side by default.
- Default y-axis position: Controls whether the y-axis is displayed on the left or right side of the chart.
- Default legend position: Controls whether the legend is displayed on the left or right side of the chart.
Time series date/number formatting
- Enable UTC time format: By default, Quiver displays timestamps using the timezone you're currently in (according to your browser). When this switch is toggled, timestamps will instead be displayed in UTC.
- Enable 24-hour format: By default, Quiver displays the time using AM/PM specifications. When this switch is toggled, time will be displayed in 24-hour format. Note that this only affects the time display on a chart’s x-axis, and not on the plot tooltip.
- Significant figures shown (1-15): Controls how many significant figures are shown in the plot hover tooltip (default of 6).
Additional settings
View mode settings
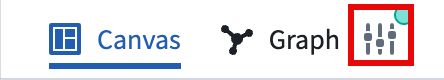
Choose your preferred view mode so your analysis always opens to your preference. Select the view mode settings toggle in the top right corner of your analysis to learn about new features in a given mode and compare between canvas and graph capabilities. Then select your preferred mode.
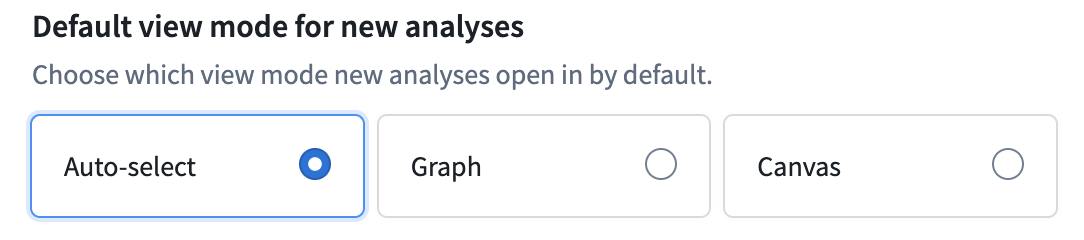
If you choose the Auto-select option, new analyses will default to canvas mode when the first data you add is related to time series. All other data types will default to graph mode.
中文翻译
设置
Quiver 提供了一系列设置选项,用于配置分析中的显示和格式。这些设置仅适用于当前分析,不会影响您创建的其他分析。
要打开设置面板,请点击侧面板栏中的齿轮图标。
个人默认设置
Quiver 允许您保存偏好的分析设置。这些个人默认设置将自动应用于您创建的任何新分析。您也可以选择将个人设置应用于现有分析。
:::callout{theme="danger"} 将个人默认设置应用于现有分析会覆盖该分析的现有设置。这也会影响在该分析中工作的其他用户。 :::
全局设置
- 允许控制设置: 启用后,可以使用分析中配置的布尔参数(Boolean parameter)来开启或关闭全局设置。
- 启用应用按钮: 启用一个应用按钮,该按钮将全局跟踪分析中卡片的更新,并在点击该按钮之前阻止这些更新传播到分析的其他部分。当预期在重新计算结果之前会有大量更新时(例如,更改多个参数时),这可以显著提高分析/仪表盘的性能。
- 等待首次应用: 如果使用应用按钮,设置此选项将阻止分析初始加载,直到点击应用按钮。当分析/仪表盘的默认状态处理的数据规模过大,并且期望用户在查看分析前应用过滤器时,这有助于提升性能。
- 启用 Marketplace 检查: 启用后,分析中所有仪表盘的 Marketplace 模板功能(Marketplace templating)将开启,并且在与分析交互时,Marketplace 验证会自动运行。错误和警告会显示在保存按钮旁边的验证指示器中。您可以在单个仪表盘的设置中为其禁用模板功能。了解如何将 Quiver 仪表盘添加到 Marketplace 产品中。
- 显示模式: 控制画布以浅色模式(Light mode)还是深色模式(Dark mode)显示。所选模式将应用于分析中的所有画布、仪表盘和模板。请注意,当仪表盘或模板嵌入到 Quiver 外部的应用程序中时(例如 Workshop 或 Object View),显示模式将继承自父应用程序。
- 加载设置: 控制打开画布时卡片的加载方式。选择"可见"可以改善大型分析的加载性能。
- 全部:将加载画布中的所有项目。
- 可见:仅加载画布中可见的项目。其余项目将在它们变为可见时加载(例如,向下滚动时)。
- 默认:当前默认设置为"全部"。
分类图表覆盖
- 覆盖默认绘图颜色/标签: 这些设置允许您覆盖分析中对象图表上分段和标签的颜色及显示名称。如果更改,本地图表显示设置将优先于全局设置。
默认情况下,同一图表上来自不同对象集的数据将显示为不同颜色;类似地,分段图表中的不同分段也会使用不同颜色。在没有干预的情况下,这些颜色将被分配以确保类别之间的最大对比度。您可以根据需要设置全局颜色覆盖,无论是出于颜色偏好,还是希望分析中所有图表上的某些分段颜色保持一致。
请注意,要为条形图中的每个条形分配特定颜色,您首先需要按与分组相同的属性对序列进行分段。
时间序列工具提示设置
- 显示绘图工具提示: 禁用后,当您悬停在时间序列上时,将不再显示包含时间序列名称、时间戳和数值的工具提示。
- 将工具提示值显示为范围/最小值/最大值/平均值: 默认情况下,Quiver 在每个时间序列图表上渲染 1,000 个数据桶。此设置用于多个底层时间序列点位于单个数据桶中的高频场景。
- 在工具提示中显示时间: 禁用后,当您悬停在时间序列上时,将不会看到时间戳值。
- 在工具提示中显示序列标题: 禁用后,当您悬停在时间序列上时,将不会看到时间序列名称。
- 在工具提示中自动换行长文本: 启用后,工具提示中的长文本将跨行显示。
- 显示时间序列悬停标记: 启用后,光标悬停的十字准线也会显示在其他图表上。这对于跨多个图表跟踪光标位置非常有用。
- 自动折叠图表选择菜单: 启用后,通过选择或拖动图表创建的时间序列图表选择菜单默认将处于折叠状态,并可以选择展开。
时间序列轴和图例
- 启用分析级流式传输: 激活所有轴上的流式传输,使时间序列下游的卡片能够在时间序列更新时刷新其值。请注意,这可能会对性能产生负面影响。如果您的用例不需要下游卡片反映流式更新,则在时间轴配置中启用流式传输单个轴设置将比此设置提供更好的性能。
- 流式传输刷新率: 控制启用了流式传输的轴上的时间序列图表轮询新数据的频率。
- 初始默认时间轴范围: 当创建默认时间轴时(例如,首次将时间序列属性添加到分析中),将使用此值作为其初始范围。设置此范围有三种方式:
- 完整数据范围: 轴将初始化为其上时间序列绘图的开始和结束日期。对于大型时间序列,这可能会对性能产生负面影响。这是在此全局设置添加之前创建的分析的默认设置。
- 固定范围: 轴将初始化为静态的开始和结束日期,例如从
2025-5-21到2025-06-04。 - 相对范围: 将视图范围设置为相对于今天的范围,例如从
2周前到现在。默认情况下,范围的结束日期设置为现在,但可以通过选择右上角的设置为相对时间切换开关来输入特定时间。新分析的默认设置是相对范围2周前到现在。 - 显示插值线: 启用后,当外部插值设置为非 NONE 时,Quiver 将显示一条虚线(标记前后)。
- 在图例中显示隐藏的绘图: 启用后,隐藏的绘图将在其图表图例中以灰色状态显示。
- 在图例中显示数值: 启用后,时间序列的最后一个数据点将显示在其图表图例中的名称下方。
- 显示时间轴擦洗器: 启用后,每个图表的 x 轴上会显示一个"擦洗器"。擦洗器用于独立控制图表的开始和结束显示。
- 轴上的缩写数字: 控制数字是使用字母缩写还是完整显示(例如,120.0k 是 120,000 的缩写)。
- 按数据分组绘图: 启用后,具有相同根对象(root object)和数据提供者(data provider)的时间序列绘图将在图表编辑器和图例中分组在一起。将根据根对象显示其他实用工具,从而更容易在根对象之间进行切换。
- 默认叠加 Y 轴: 启用后,Y 轴默认将叠加在图表数据之上。禁用后,Y 轴默认会将图表数据移到一侧。
- 默认 Y 轴位置: 控制 Y 轴显示在图表的左侧还是右侧。
- 默认图例位置: 控制图例显示在图表的左侧还是右侧。
时间序列日期/数字格式
- 启用 UTC 时间格式: 默认情况下,Quiver 使用您当前所在的时区(根据您的浏览器)显示时间戳。切换此开关后,时间戳将改为以 UTC 显示。
- 启用 24 小时制: 默认情况下,Quiver 使用上午/下午(AM/PM)格式显示时间。切换此开关后,时间将以 24 小时制显示。请注意,这仅影响图表 x 轴上的时间显示,不影响绘图工具提示。
- 显示的有效数字位数(1-15): 控制绘图悬停工具提示中显示的有效数字位数(默认为 6)。
其他设置
视图模式设置
选择您偏好的视图模式,以便您的分析始终按您的偏好打开。点击分析右上角的视图模式设置切换开关,了解特定模式下的新功能,并比较画布模式和图形模式的功能。然后选择您偏好的模式。
如果您选择自动选择选项,当您添加的第一个数据与时间序列相关时,新分析将默认使用画布模式。所有其他数据类型将默认使用图形模式。